If you started making twice the amount of money that you do today, how would your spending habits change?
Consider if the tables were turned, and you instead were reduced to half of your current income. Where would you likely make cuts to spending?

Check out our H2 hedge fund letters here.
The reality is that the money you have coming in has big implications on how expenses get prioritized – and so it’s interesting to see how people in different income brackets allocate what they have.
Visualizing Spending
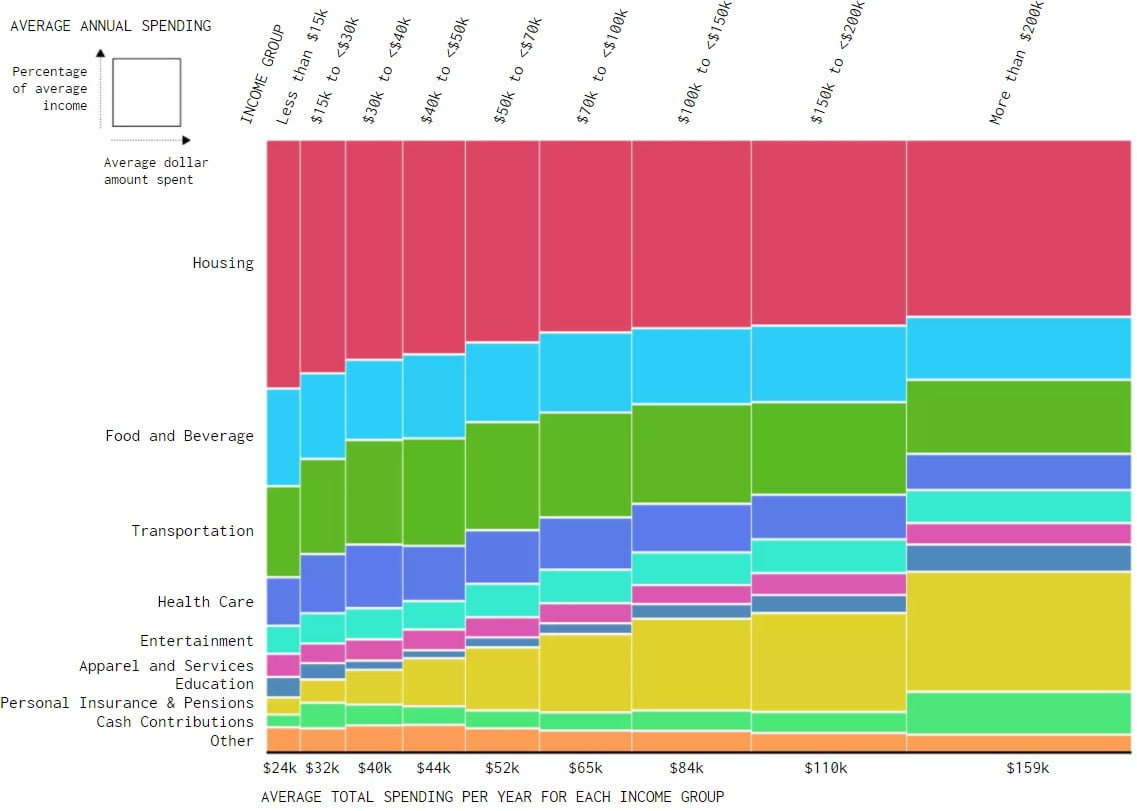
Today’s series of graphics come to us from data visualization expert Nathan Yau at FlowingData, and they show how money is being spent by different income groups.
It uses data from the 2016 Consumer Expenditure Survey, an annual survey by the Bureau of Labor Statistics. Meanwhile, embedded words in the graphics come from Yau, as he makes observations on the data.
To Buy or Rent a House?
How do income groups differ in spending for housing?

Housing Expenses
How is money spent on utilities, furniture, and other household expenses?
Food Expenses
Do income groups spend more eating at home, or eating out?
Travel and Transportation
The cost of vehicles, gas, and other travel expenses.
Health Expenditures
What about money spent on health insurance, services, or drugs?
Pensions and Social Security
Lastly, the money going to retirement, pension, social security, and insurance plans.
For more data analysis, as well as many other great visualizations on income, we highly recommend checking out FlowingData.
Article by Jeff Desjardins, Visual Capitalist


