President Trump promised that he would take no salary if elected, and thus far he has donated his compensation to worthy causes. That’s all well and good, but with the 2018 election season heating up, it got us thinking about the differences in compensation for executives at the state level. So we did a little research and created our new map of the governor’s salary for every state in the country.

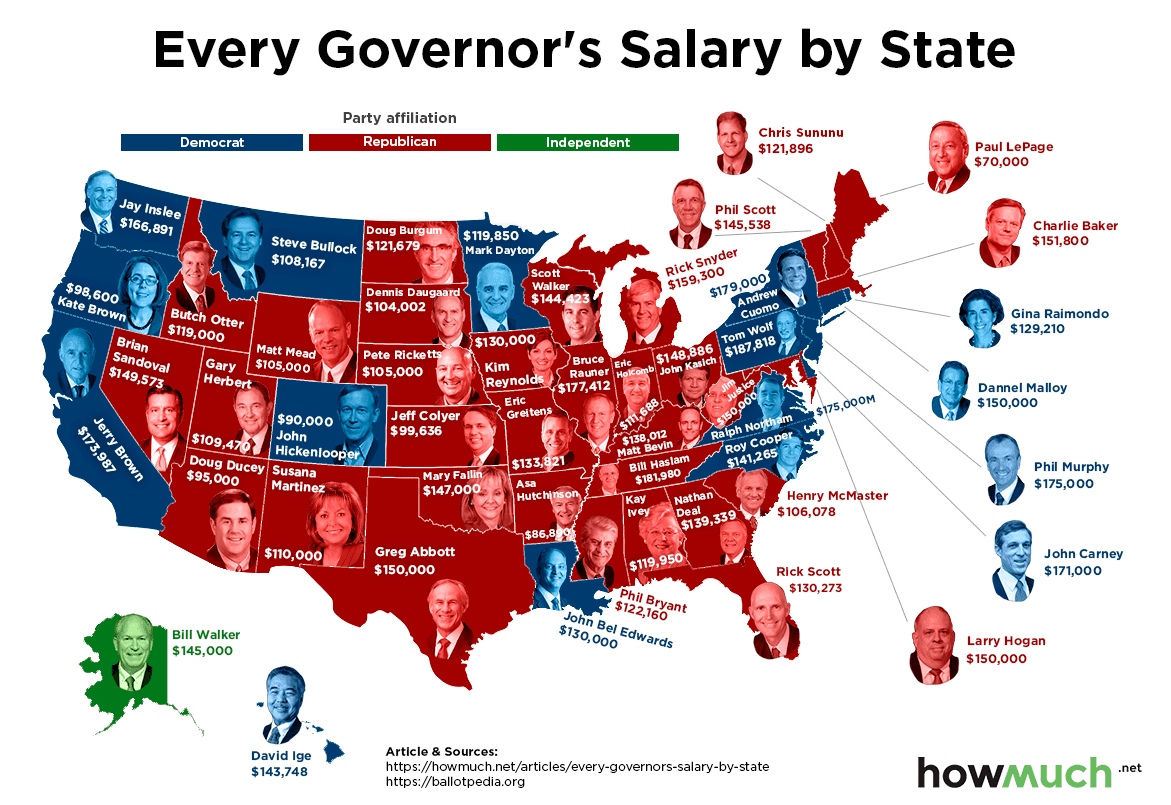
We used salary figures from Ballotpedia, a website that works to inform voters in a nonpartisan way about how the government operates and what elected officials are doing. We colored each state based on the political affiliation of the governor, then added a photo of the chief executive together with his or her salary. This approach creates a quick snapshot of their compensation, allowing for an easy comparison between states and political parties.
First off, there are a lot more red than blue states on our map simply because Republicans tend to win governorships more often than Democrats. There are a lot of reasons for that, including how many gubernatorial elections happen during off-Presidential election cycles (there are 36 this year). More to the point, listing a salary on a map reveals the stark differences in compensation for governors in states right next to each other. For example, Jerry Brown (D) in California makes $75K more each year than Kate Brown (D) in Oregon. Brian Sandoval (R) in Nevada pulls in $50K more than Doug Ducey (R) next door in Arizona.
Keep in mind governors serve four-year terms, which makes the discrepancies that much more significant over time. OK, governors in Vermont and New Hampshire only serve two-year terms, but here’s the point. Let’s take the most extreme example. The highest paid governor in the country is Tom Wolf (D) from Pennsylvania, who pulls in an impressive $187,818 each year. That’s good work if you can get it. The lowest is Paul LePage (R) in Maine, who only makes a measly $70,000. Think about that—after four years, Wolf will make $471,272 more than LePage. Pennsylvania is a lot different than Maine, but they have the same job. An annual salary of $70K is certainly quite low for a governor, but it’s still quite a bit higher than the median income in the U.S., so let’s not shed too many tears for LePage.
Another way to analyze the data is by making partisan comparison between Republicans and Democrats, and to make things fair, let’s compare the two groups by looking at averages. The average Democratic governor’s salary is $146,221 compared to $128,327 on the Republican side. As a matter of fact, 7 out of the 10 highest paid governors are Democrats, even though there are just 16 Democratic governors in the country compared to 33 Republicans (Gov. Bill Walker from Alaska is the lone independent).
- Pennsylvania: Tom Wolf (D) at $187,818
- Tennessee: Bill Haslam (R) at $181,980
- New York: Andrew Cuomo (D) at $179,000
- Illinois: Bruce Rauner (R) at $177,412
- New Jersey: Phil Murphy (D) at $175,000
- Virginia: Ralph Northam (D) at $175,000
- California: Jerry Brown (D) at $173,987
- Delaware: John Carney (D) at $171,000
- Washington: Jay Inslee (D) at $166,891
- Michigan: Rick Snyder (R) at $159,300
For whatever reason, Democratic governors are comparatively more expensive for taxpayers than Republicans. We will leave it to you to draw your own conclusions about exactly why.
Data: Table 1.1
Article by How Much


