The stock market crash of 2018 might go down in history in several respects. While the momentary flash crash of May 2010 was algorithmically driven – a discernable pattern was detected that “spooked” the computer-based market making system – the market recovered quickly as the longer-term trend momentum signals ignored the hick-up. But the winter 2018 crash had both fundamental similarities and differences – but the action might not be over, says a Bank of America Merrill Lynch report.

The 2010 Flash Crash came as a complete surprise to market participants. The event was initially blamed on a “fat finger” for public consumption – blame the human for the problem -- but market structure insiders knew differently. To put the event in the parlance of a trading pit, the computer-based markets makers got intimidated, and they were all spooked at the same time. Unlike a trading pit, where some participants might be alarmed while others remain resolute, in a computer-based model the math-based formulas can tend to draw the same conclusions and quickly crowd.
When BAML global investment strategist Michael Hartnett looks at the recent market sell-off and then stout reversal, he looks at mathematical metrics but demonstrates that truly understanding takes connecting discretionary dots.
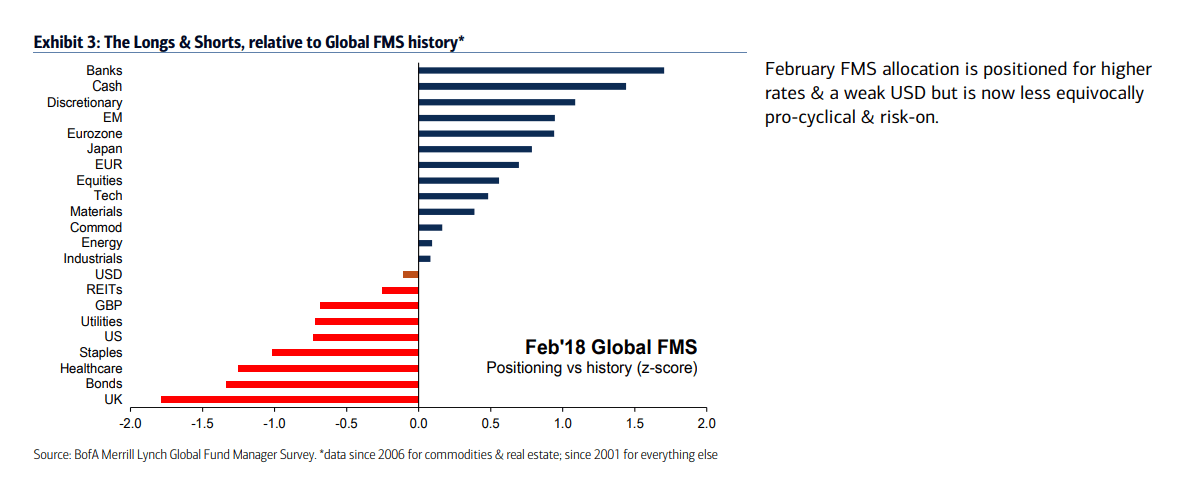
Take his FMS metrics on a “pain trade.” The very thesis of the concept is that a human is feeling emotional hurt over a position. But other measures are decidedly more mathematically logical. His FMS cash rule, which essentially measures cash balances, or the available purchasing power on the sidelines, is currently at 4.7%, just above its ten-year average, which moves this indicator into a buy signal. NAML notes:
A record net 24% of global equity investors consider corporate balance sheets overleveraged, a response even higher than at the height of the financial crisis
But no one signal tells the whole story. The Bull & Bear indicator “remains in 'sell' at 8.4 with cash not rising sharply enough to cause a drop below the 8.0 ‘sell’ signal threshold.”
Hartnett, looking at one indicator, thinks it is “suggesting likely test of recent market lows.”
With “thinning macro ice,” a world where 91% say a recession is “unlikely,” the crowd is looking one way, and Hartnett is looking the other. The recent sharp bounce off the near-term S&P 500 low of 2581 reached February 8 has moved higher quickly, but unlike the 2010 flash crash, it was an economic concern – rising interest rates – that triggered the initial sell-off, as systematically driven funds piled on amid alleged manipulation of the VIX index and it’s out of the money option pricing structure.
Volatility analyst Chris Cole, whose Artemis Vega Fund performed as it should during market turmoil – providing a cushion for wild stock market price swings – thinks more volatility is to come. His work pointed to an expert analysis in the alleged VIX manipulation allegations but who was not charged or alleged to have been involved in the manipulation, sees the technical hick-up as more than just technical. “The other shoe is going to drop,” he told ValueWalk, pointing to fundamental concerns.
Those wildly whispered “issues” with a central bank unwind that to date have gone well might be an event without historical precedent. Never before in central bank history has a balance sheet been so bloated and the factors of economic supply and demand so distorted. Cole and numerous analysts have watched as the tranquility of artificial stimulus have raised all boats. If the inflation monster rears its ugly head too quickly, the Fed might be forced to burst a bubble rather than gently leading it to normalized levels.
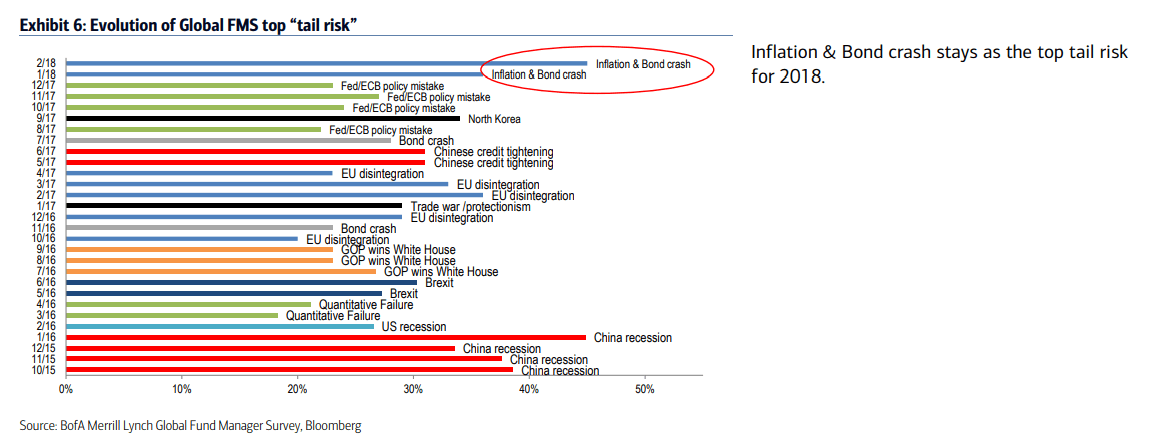
Hartnett, for his part, uses more mathematically logical language, noting that “bonds crash the party.”
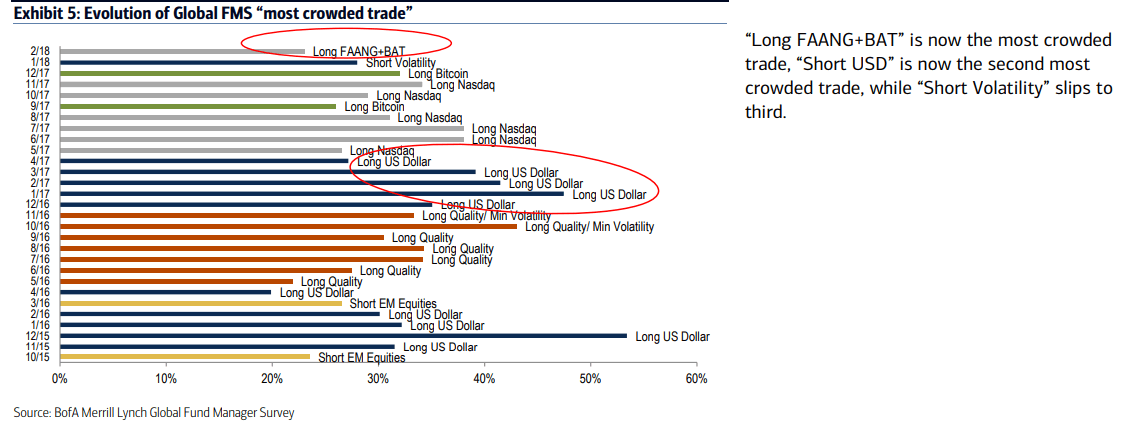
60% say Inflation & bonds most likely catalyst for cross-asset crash (#2 was US/EU corporate bonds @15%), bond allocations cut to lowest since 1998, REIT exposure cut to 6-year low; top 3 “crowded trades”...#1 long FAANG/BAT, #2 short US$, #3 short volatility; strong US$ & lower yields would be painful.
The investing world has felt the knife of a short volatility trade and Hartnett, like Cole, are looking at all probability paths with one being flaccid volatility is a thing of the past.