How to look at the recent sell-off in Equity and Bonds? Three possibilities come to mind.
- NOISE: this is simply a minor correction in the secular bull market
- NORMALISATION: Equity and Bonds are finally re-pricing, but nothing Change in vol regime in a bull market, on the path to normalization.
- ADJUSTMENT APPROACHING: these are the early tremors as we near the tipping point of a critical transition, after years of ‘Fake Markets’ (as defined here)

Half way through the week, while markets were still battling for a clear direction after Monday nasty volatility shock, an emerging consensus had already asserted itself among opinion makers, shaping the dominant narrative: the VIX-shock is no more than a technical accident, a statistical outlier, a random chance. John Authers on the FT spoke of ‘’a speculative attack, where a few traders ganged up to force out of business a few rather small instruments that allowed investors to bet against volatility’’. Many echoed the technicality of an orchestrated squeeze: now that most short vol ETPs are cleared, incident closed. To disassociate themselves from clues of systemic selling during downturns, risk parity managers from AQR to Bridgewater also reassured that they had no role in the turmoil. The White House itself spoke of a ‘big mistake’ in the face of strong economic growth. Further, most commentators even had a theory as to why it may last longer than few days, but still not matter: unwinding of residual VIX hedging related positions may take a while.
Unsurprisingly, as we long argued for impending criticality in markets due to a synchronicity of imbalances and evidence of long-run saturation, calling for the possibility of a deep reset (twin bubbles meet QT), we are naturally inclined to categorize the event in confirmation of our market thesis, as an early warning signal of what is to come.
Confirmation Or Invalidation Of Market Thesis: What Are The Signposts
A. The fact that a 10% correction could happen fast and furious after the blue-sky of record days of VIX below 10 and longest streak ever without a 5% correction (approx. 400 days), and do so in the absence of news, hints to what we argued all along, that the structure of the market if inflammable, and the trigger to a re-pricing can be endogenous – no need for external catalysts such as a devaluation in China, a bomb in North Korea, a bad inflation After years of QE and ZIRP/NIRP, there is an extreme concentration across investment strategies, life-dependent on up-trend in prices and down-trend in volatility (two factors explain all: Trend Factor, Volatility Factor).
B. The VIX-shock is the story of an entirely predictable wipe-out: but, being predictable, how could it be shocking? As many argued last year, short vol ETPs were an accident waiting to happen, the day would come when they would get Our own analysis was filled with even more drama, as we pinpointed 20 VIX as the threshold above which havoc would spread out (here and pages 44-49 here):
‘’It is one thing for short-vol ETPs to be exposed to rising levels of volatility up to the point where they face wipe-out event risk. Any investment can go sour, and even very badly so. It is quite another for such small moves in volatility to be enough to trigger a wipe-out event. What strikes is then how close we drifted to the cliff, thus with how big a probability it will happen at some point down the line. Indeed, doubling up from where volatility stands now is easy, and simply means moving towards historical averages.’’
C. The point being, such pathos for an event many thought inevitable speaks volumes of excess complacency and blindness to truly systemic risks on the part of the investment community. Further, the rapidity and magnitude of the slide is also relevant and informative. Despite the tiny size of the short vol ETPs complex (less than $3bn, although a vega notional adj is required), its initial impact was big, as equity shed more than $1trn in value. It likely relates to broad system fragility: if not, for the butterfly it was, why did it matter?
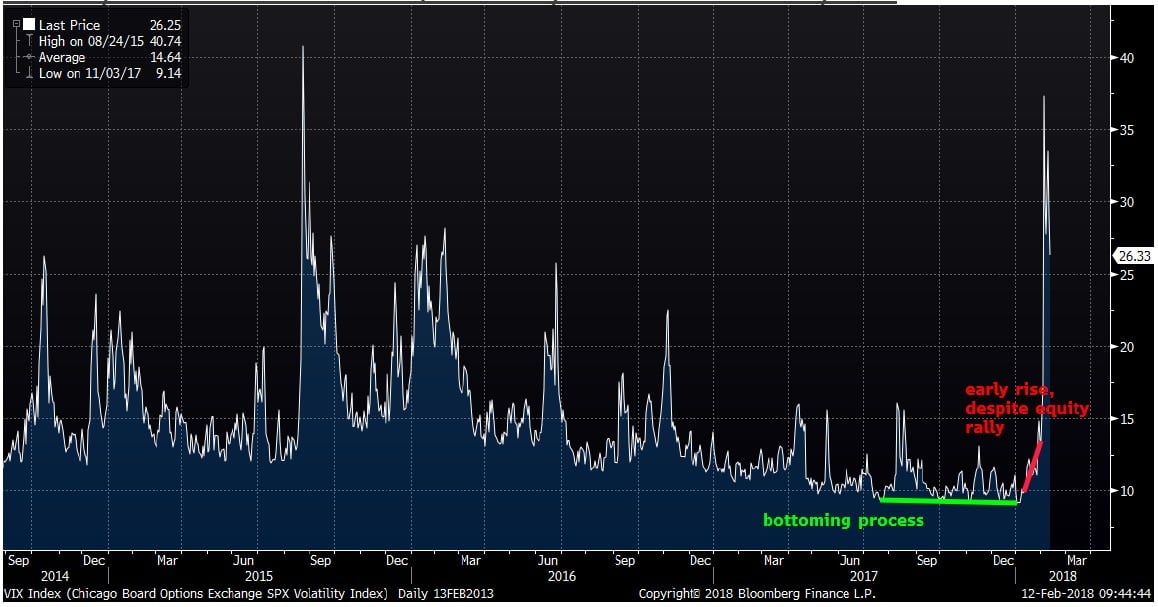
C. Volatility had started re-pricing already over the last six months, and particularly so in January 2018. Implied volatility as measured by the VIX floored at 9-10 already six months ago – a low of 84 was recorded already on July 2017, just a fraction above the all-time intra- day low of 8.56 in November 2017. Ever since, it started a bottoming process, which led to it rising from ashes in the month of January, surprisingly in lockstep with a booming equity market. The positive correlation between vol and equity in January was informative: no causal relationship, but a meaningful coincidence. Finally, in the days leading to the VIX- shock, volatility of volatility (VVIX) rose markedly, reflecting that investors were growingly on edge, despite the VIX remaining low. Given all this, the idea that a speculative attack was the death kiss to those fragile ETPs is hard to match with ground evidence. It was more likely an explosion after lengthy volcanic activity. The scale itself of hostilities is telling: according to MS, ETPs had to buy 282,000 VIX futures to rebalance their short gamma: "this was the largest VIX buy in history, dwarfing the previous record of 78,000." Dealers hedging their short gamma exposures likely contributed to VIX futures demand as well (ZeroHedge notes here).
Volatility bottomed out in mid-2017 and slowly resurrected in January 2018
Source: Bloomberg
Volatility rising in tandem with equity during January
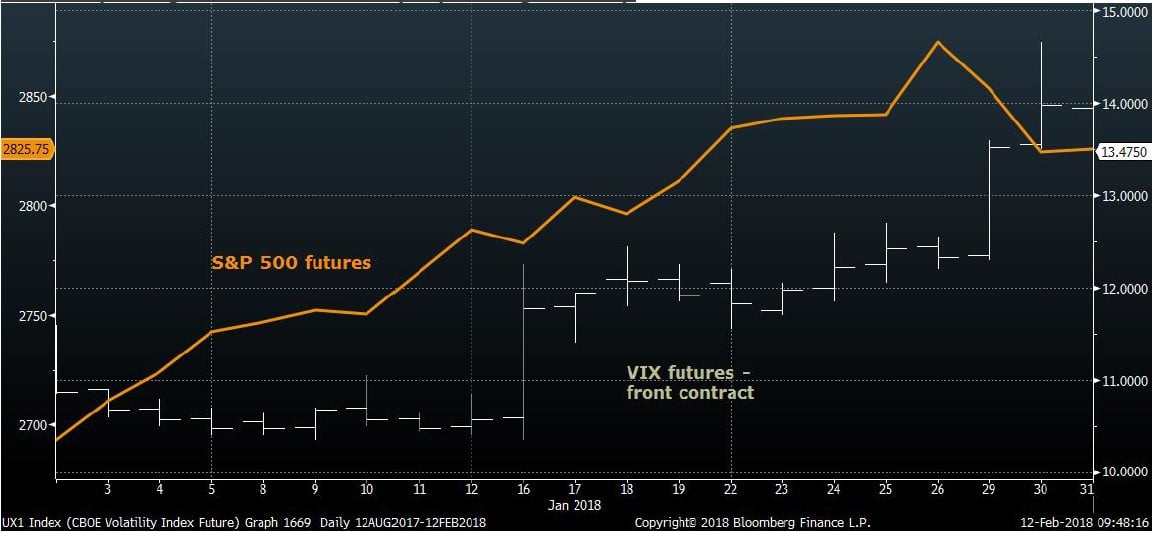
Source: Bloomberg
Volatility of volatility was already on the rise going into the VIX-shock event
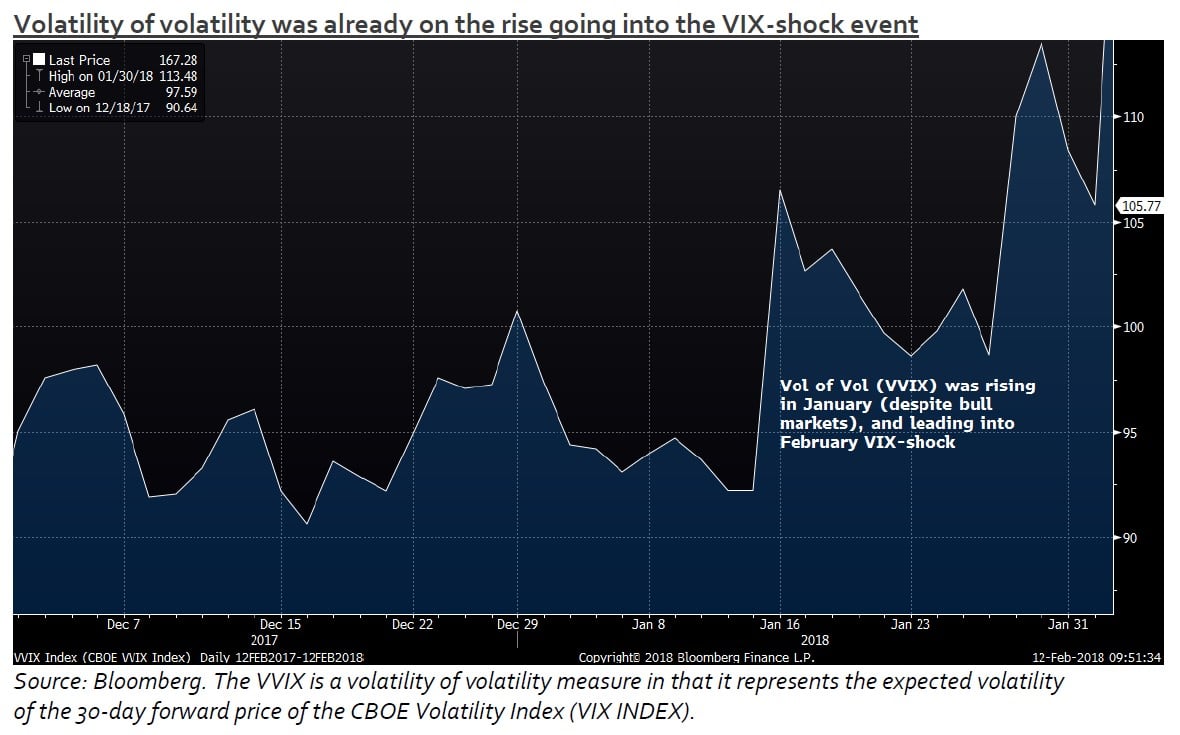
Source: Bloomberg. The VVIX is a volatility of volatility measure in that it represents the expected volatility of the 30-day forward price of the CBOE Volatility Index (VIX INDEX).
D. Noticeably, medium-term volatility has not fully reacted yet. This matters, as Risk Parity funds, Vol Target funds and even some CTAs are referenced to longer-dated realized volatility measures, given their lower rebalancing frequency and longer reference It will be interesting to monitor this relationship in coming weeks.
Longer-term volatility still subdue: VIX Futures Curve
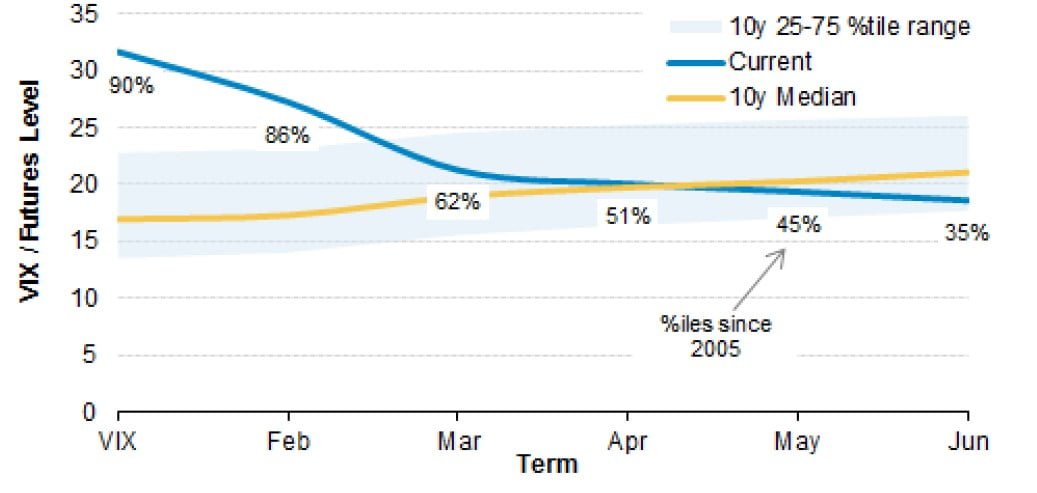
Source: Morgan Stanley QDS: ‘’right now, the options market does not fully price in a higher volatility environment for longer, and the inverted curve means forward volatility is relatively inexpensive. June VIX futures are only in the 35th 10-year percentile, while even further out volatility between June and Dec of 2018 is only in the ~10th 10-year percentile’’
E. The correlation between Equity and Bonds flipped to positive over the month of January. Risk parity funds, and more generally balanced funds with or without leverage, are on notice here. It does not have an overnight impact, as they do not trade that often and are ‘turtles’, but the reaction function is simple, and one should expect it to play out in the subsequent months.
Rolling Correlation between Equity and Bonds
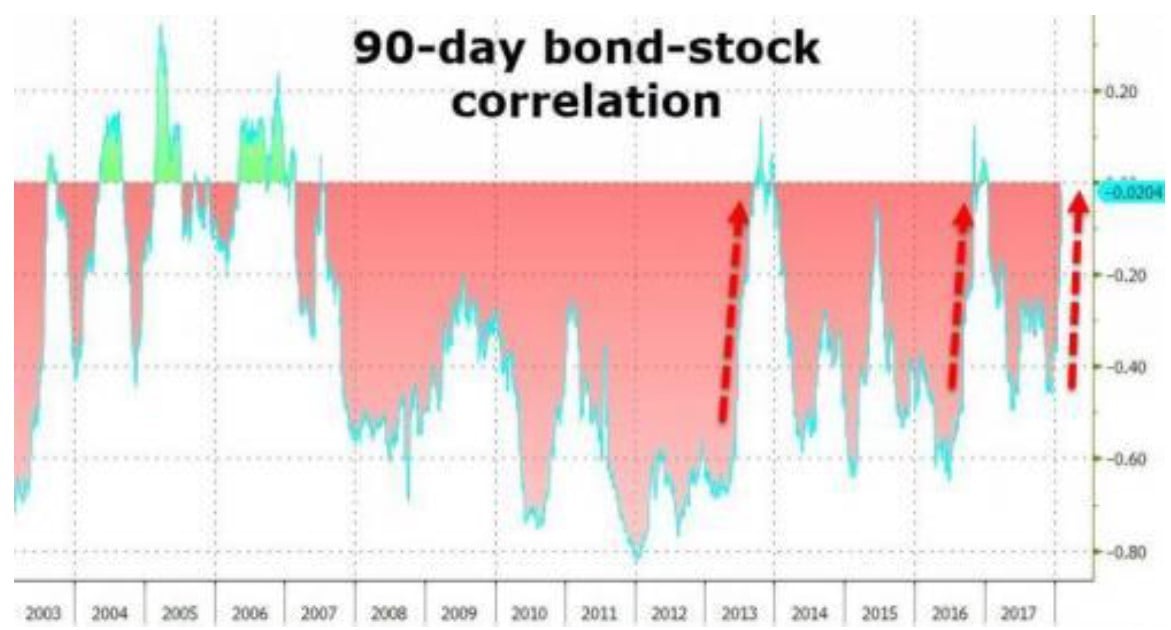
Source: ZeroHedge, here
F. Flows matter, especially in a QE world. QE flows themselves are fading, as we all know, for 1trn in 2018 More interestingly, private flows seem to be at a critical juncture. Due to higher volatility and higher rates, the change in inflows / outflows month-on-month was the largest in 10 years, leading to record outflows from equity funds for $30bn just last week. This chart from BAML’s Michael Hartnett is self-explanatory.
Record outflows ($30.6bn) from equity fund
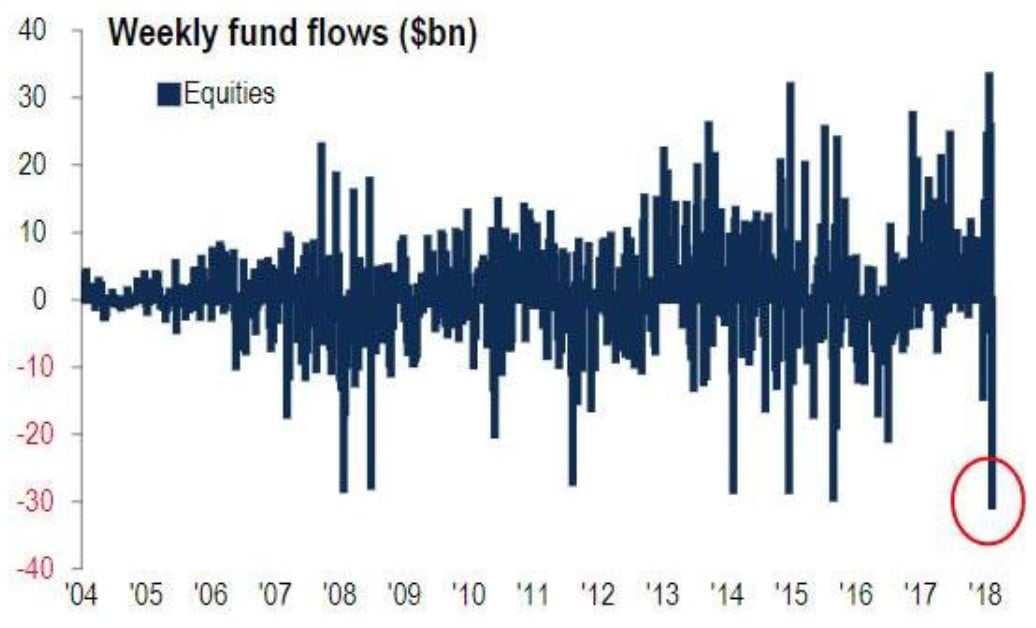
Source: BofAML, EPFR Global, ZeroHedge, here
G. If you are in look of a bubble, chances are that you are in need of a blow-off phase beforehand. A moment where the trend goes vertical, a final climax before That was the case oftentimes over financial history, the cherry-on-the-cake of a bubble formation. It does not need to be there (non-necessary condition), but any exponential acceleration is a signpost - so was the equity market in January, where certain stocks such as Netflix could rise 52% (and reach the market cap of companies with 10X the revenues, like GE), where the Italian stock market could rise 9% ahead of a critical election a month later, and other amenities (we analyzed a few in this chartbook).
S&P in vertical rise in January
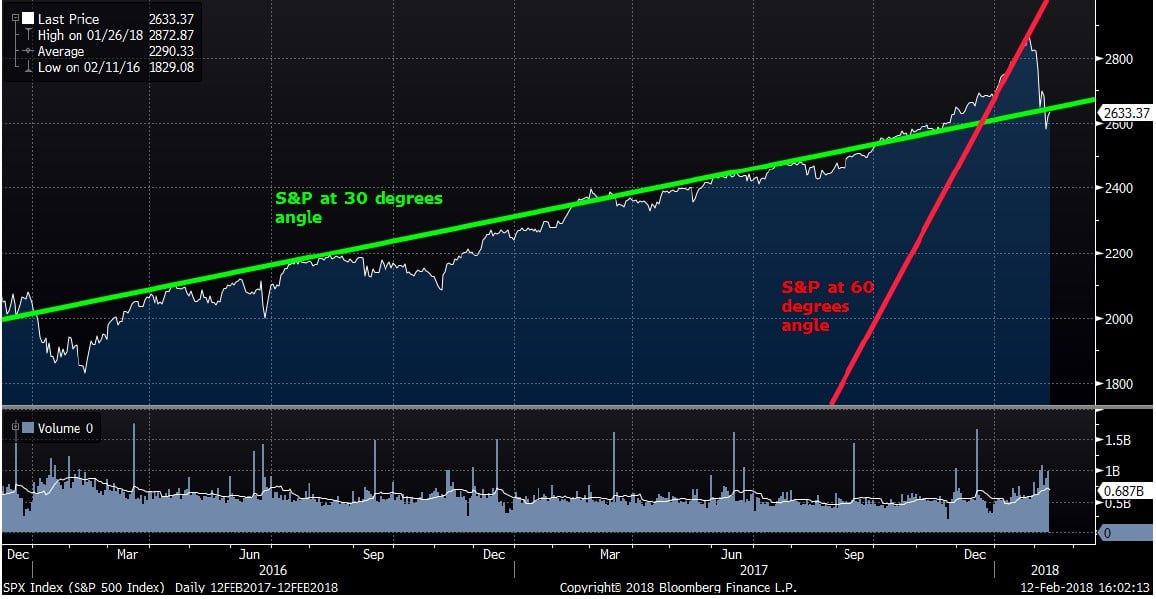
Source: Bloomberg
What Next? How QE’s Positive Feedback Loops Act In Reverse. Delayed Effects.
While the crisis may be over for the time being, a dominos of cause-effect relationships triggered, which leads to a possibly tough Q2/Q3 if volatility persists. The autolytic reaction is now jumpstarted, but will take time to spread across. If this scenario proves right, what may we see from here?
- Volatility (implied and later realized) further spreading to nearby asset
- Volatility staying sustained, finding a floor well above the previously held line of 9-10 No return to status quo.
- Critical slowing down. This is a general property of a system approaching critical transitioning into an alternative stable state, according to professor Marten Scheffer (as described in edge of chaos). The speed with which markets return to new highs, assuming they do, is slower than previous recoveries (Nov16 Trump election, Jun16 Brexit, Jan16 commodity slide, Aug15 Renminbi deval, Oct14 slide, among others).
- Correlation increasing across asset The sneaky Beta to the downside risk which surfaces during times of stress.
- At some point along the way, CTAs and trend-chasing algos will delever portfolios due to the persistence of higher volatility, but not intra-day or daily volatility, as they often rebalance with lower frequency than daily and referencing longer-dated measures of volatility (which has not reacted fully yet, as shown above)
- Somewhere along the fine line, a second failed Buy-The-Dip (possibly around the 200 days moving average on the S&P) may convince momentum strategies to follow through, beyond pre-defined strikes, and pre-identified weak points / fault lines on order books . After that, CTAs again, and those behavioral Risk Premia funds linked to momentum factor style or volatility factor, or both (multi-factor portfolios), directly or indirectly. Trend-driven investors more generally, including retail, are likely to Those machine learning quant funds that learned to buy-all-dips over recent years may also learn to sell.
- Finally, Risk Parity funds and other Target Vol vehicles at large, may sell assets, if realized volatility and correlation persist and gets recorded in monthly If we are to believe what we are told these days by RP largest promoters, they will all sell later (Jeff Gundlach may say, ‘’at a lower price’’). Cliff Asness of AQR: ‘’we have done pretty much no trading in risk parity [these days]’’. Bob
Prince of Bridgewater described the fund as ‘’the most boring thing really, it is definitively not driving global asset prices. It just sits there like a turtle’’. Technically, if volatility persists, the longer they wait the higher the chance that the rebalancing may reflect redemptions, instead of higher realized volatility.
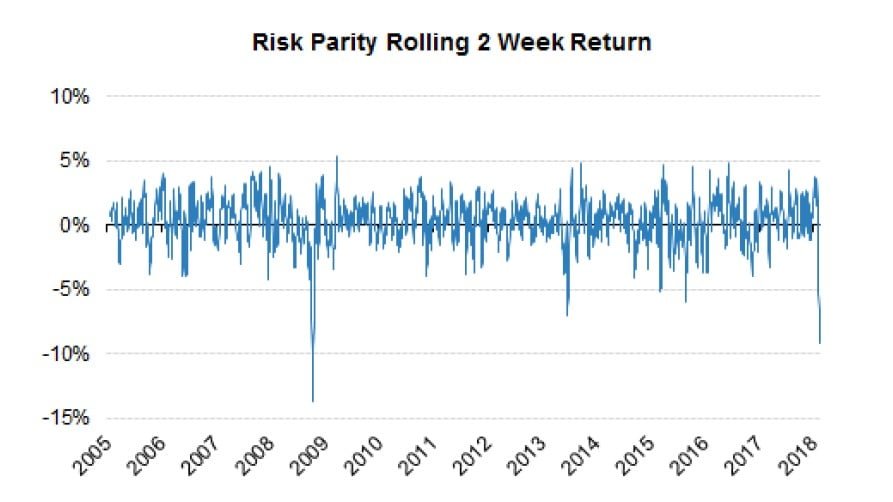
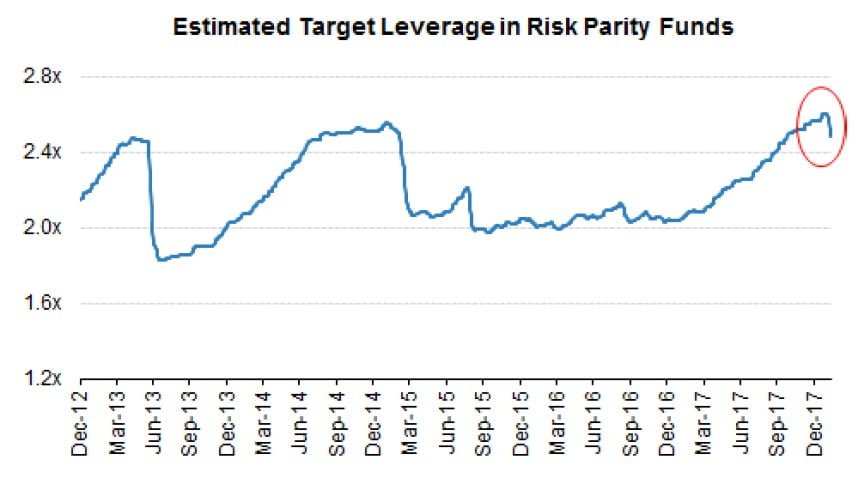
Source: Morgan Stanley QDS: ‘’On the systematic supply side, risk parity funds have now had the worst two week return since the financial crisis (on QDS models, others may show something +/- but clearly performance is poor). While they do use longer-term realized vol to drive their models, there has to be some deleveraging going on now / next week given the increase in volatilities and poor performance. Modeling the exact timing of these flows is hard and nobody should pin an exact dollar figure on any given day. But in general the trend is clear – stocks and bonds are both more volatile, bonds at best are not diversifying stocks and at worst falling with them. This could mean tens of billions of equity supply. Notably August 2015 saw a similar dynamic where bonds were ~flat and did not cushion the equity drawdown – which did bring in risk parity funds.’’
Naturally, ETFs and passive index funds are programmed to follow through, whatever the circumstances, mechanically and
Value investors, who in previous occasions came to the rescue and picked up good names, will buy at the margin as the market falls, providing some counterbalancing flows, with any dry powder left and the little AUM that has not transitioned yet to passive strategies or long
Eventually, it becomes a game of musical chairs. The motto goes: if you need to panic, panic early. Especially true for institutional investors, as the imposition to sell can come for one of two reasons: model-driven, due to an increase in realized volatility, a broken trend, a flipping correlation... or client-driven, due to redemptions. The earlier of the two.
The Structure Of The Market Is Combustible
The structure of the market is the key driver of market dynamics in a QE world, above all over-fitting economic narratives: the interaction of Trend/Momentum, Volatility, Correlation. Factors such as Trend and Volatility, disseminated across the industry in the last several years, under the push of QE and NIRP, and created Correlation across 90% of the investment strategies (here), leading to an unstable equilibrium vulnerable to small perturbations. They can now all act in tandem again, but in reverse.
The autolytic reaction needs to be jumpstarted, which is what tiny short vol ETPs may have just done.
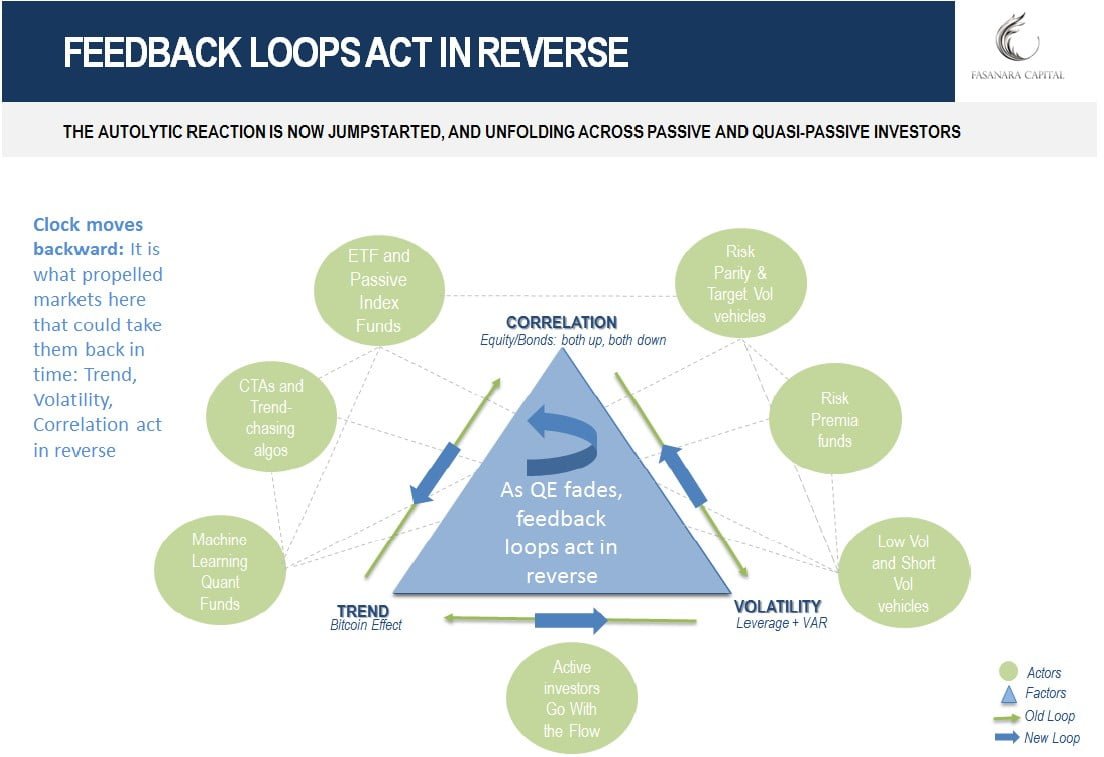
Source: Fasanara Capital ltd. Investment categories as in previous chart on ‘’positive feedback loops and financial instability’’: here. ‘’The positive feedback loops between monetary flooding and the private investment community are culpable for transforming an ever present market risk into a systemic risk, and for masking as peaceful what is instead an unstable equilibrium and market fragility.’’
Article by Fasanara Capital.
See the full PDF below.


