
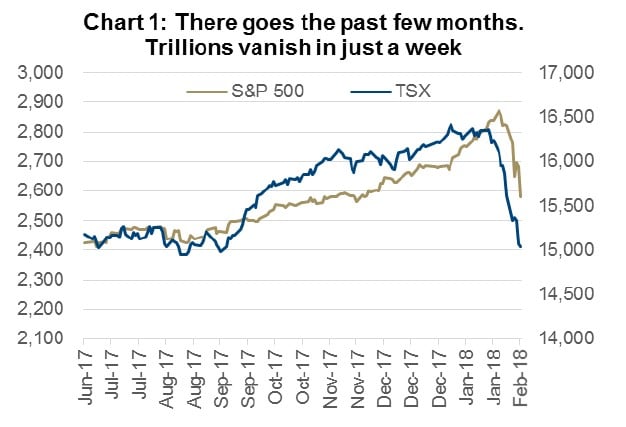
Last week we wrote a piece titled “Hey Equity Markets, Bond Yields Toll for Thee.” Well, bond yields tolled alright, and equity markets found their bell rung in terms of handling rising bond yields. The U.S. ten-year topped out twice last week at precisely 2.88%. The S&P 500 declined 5.2% and the SP/TSX Composite fell 5.4% respectively with both indices falling into correction territory (10%+) from their highs in January. Welcome to the first correction in 722 days, one of the longer streaks ever without a significant pullback. After Friday’s late day bounce equity markets closed the week just under -10% from their respective peaks quickly wiping out months of gains. (Chart 1)

Corrections are pretty extreme risk-off events impacting not just equities but all financial markets. Volatility skyrockets impacting stocks, bonds as well as currencies. Typically, corrections are triggered by some sort of exogenous event, however despite the never ending narratives after the fact, the initial cause of this correction is not as tangible as past corrections. There is no geopolitical event or breaking news on which to place the blame.
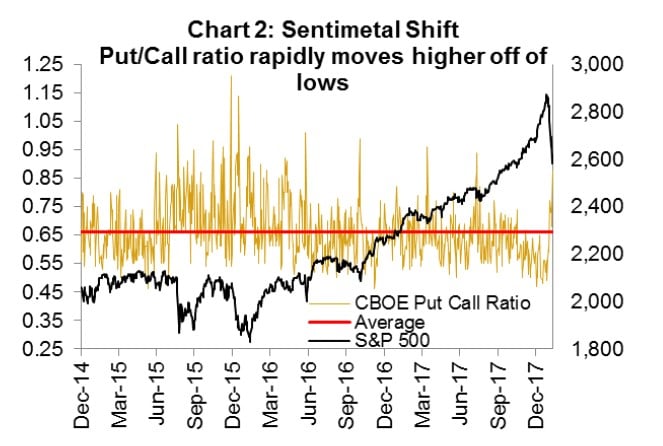
It comes as no surprise that after the worst week for U.S. equity markets since January 2016, investors are panicking, trying to understand what is going on. The S&P 500 lost $2.25 trillion in market cap since its peak on January 26th. This has caused a tectonic shift in investor sentiment; the AAII U.S. Investor Sentiment reading has moved from near euphoria readings in January to a reading decidedly less so. Complacency was prevalent in the markets in January, and why shouldn’t it have been? The put/call ratio (Chart 2) reached multi-year lows in January a sign that investors were not concerned with portfolio insurance. Volatility was low and markets were rising at an ever increasing pace. Things seemed so good until they didn’t.
Technical not fundamental
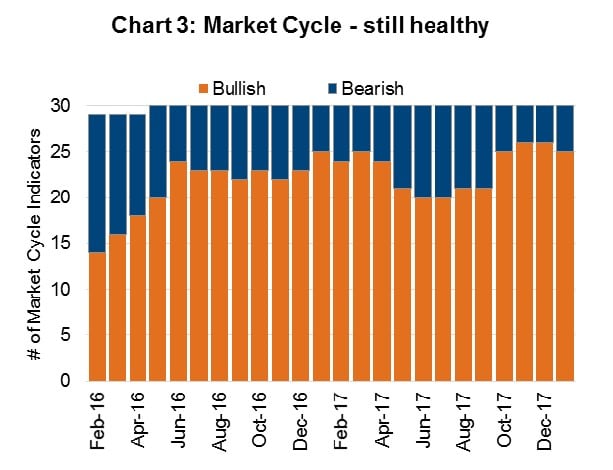
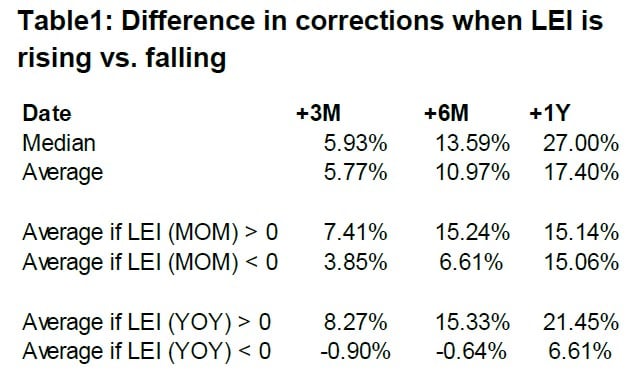
The damage has been done, and markets will move as they will in the short-term, but we will note that the ingredients are still in place to remain constructive for the markets. Unlike many previous corrections, the economic backdrop remains strong. Our market cycle clock still has 25/30 indicators in positive territory (Chart 3), we typically do not get worried about a recession looming until that number falls below 15. The more commonly used LEI (Conference Board U.S. Leading Index Ten Economic Indicators) is also trending higher and has been since the middle of last year. In our study of previous corrections we compared subsequent performance of market corrections from 1988 depending on whether the LEI was positive or negative. The results can be found in Table 1. What we see is that the near term performance, both three and six month numbers are substantially more positive when we have a rising LEI.
With economic conditions still positive, this leads us to believe that this correction is largely technical rather than fundamental. As much as it goes against your gut feelings, when the consensus is too far in one direction it typically pays off to bet against the herd and buy the dip or fade the rally. In our gut we all know this is what we should be doing, but why is it so hard? In behavioural finance the concept of Prospect Theory is a well-known principle. Losses on average feel over twice as bad as the equivalent gain feels positive. Let’s circle back to the ‘day’s lost’ line in the opening table. U.S. markets are just back to where they were in November, yet the pain felt last week was over double the pleasure felt from watching our investments grow over the past few months.
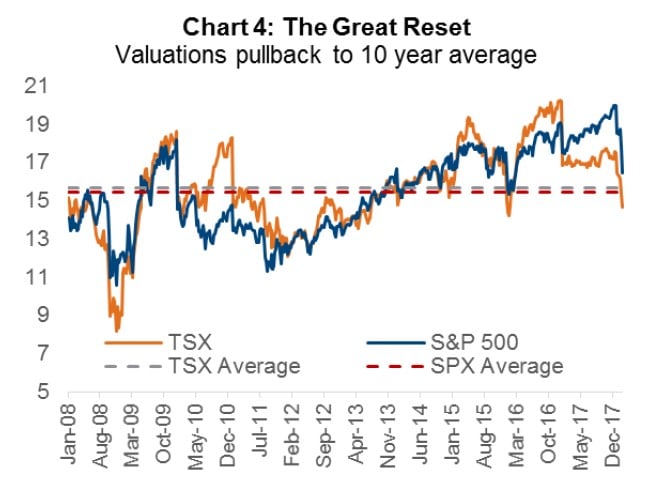
This equity market pull-back appears similar to a clearing storm in a forest, it can seem devastating at the time but flushes out the excesses and can make room for healthier growth. Excessive overgrowth has been cleared and valuations have normalized back to more rational levels. In Chart 4 you can see that valuations for both the TSX and the S&P 500 are back near their respective 10- year averages. The TSX is actually now under its average. A great buying opportunity.
Questioning why
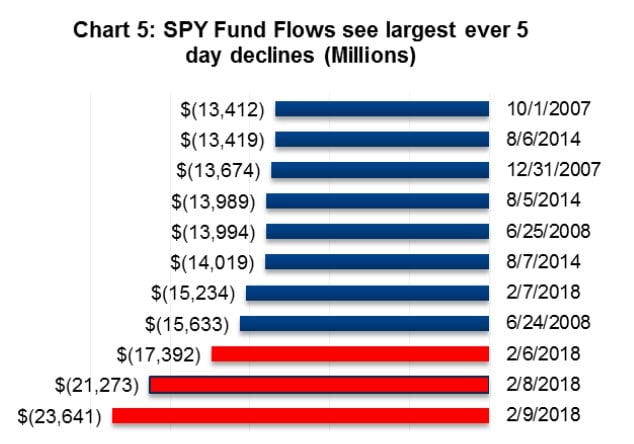
There is a cause and effect to everything, so what caused this recent rapid pullback? There are two catalysts that seem to be getting most of the blame. Firstly, it seems the implosion of short volatility investment products at least exasperated the sell-off. These strategies have ballooned in popularity as volatility in the market remained benign for an extended period. We view these strategies similar to picking up nickels in front of a steam roller. It is really easy money until your shoelace gets stuck and you get flattened. That moment happened last Monday when the S&P Volatility Index (VIX) more than doubled in one trading session causing these products to implode. The strategy of being short equity volatility goes beyond a few popular ETFs to managers employing risk parity, shorting long volatility and other similar strategies. The massive amount of capital in this trade sucked up a lot of the liquidity in the market, because those investors had to sell stocks to cover their shorts, switch to bonds or chase the losing trade, in hopes that volatility will normalize. As evidence of the unwind out of equities, the largest ETF in the world SPY saw three of its largest ever rolling 5-day outflows last week with the fund shrinking by $23.6 billion last week. (Chart 5)
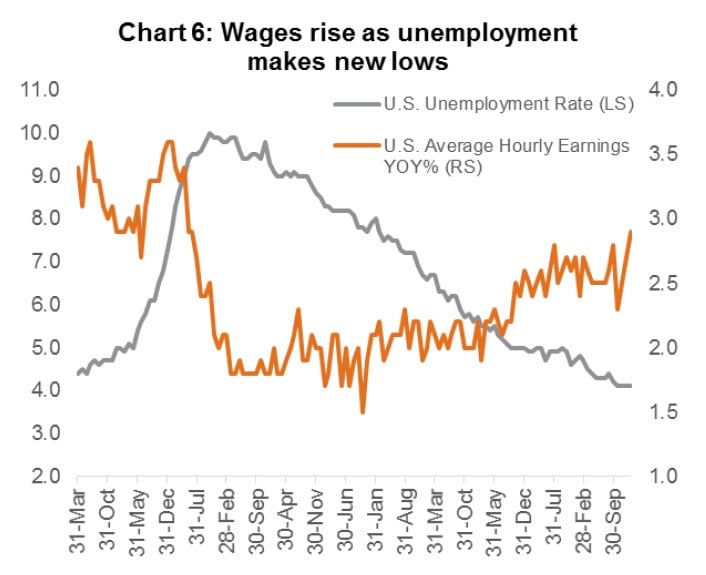
The other potential cause, and one to which we are paying more attention, came from the jobs report last Friday, when the U.S. reported the largest average hourly earnings increase since 2009. (Chart 6) Labour is the biggest input cost in almost every business and the fear is that higher wages and a tighter labour market will spur inflation. Benign inflation has been the reason why the Federal Reserve (FED) has been able to be so accommodative for so long. Despite the FED hiking rates for over a year, they have been tepid, cautious and very data dependent. Should the “FED put” (the feeling that the FED will back stop the markets) be removed and rate hikes happen more rapidly, that could invert the yield curve, derail growth and potentially tip the economy into a recession.
We are on guard, looking for green shoots of inflation and were going to write about it in this Ethos but then the DOW Jones industrial average traveled 20,000 points over the week, so we pivoted our publication.
Portfolio Implications
Our thoughts are that inflation is still being undervalued by the market and that the rise in bond yields will continue. This will be negative for long duration assets like bonds or high yielding, interest rate sensitive equities but positive for cyclicals. We have positioned our fundamental portfolios to tilt toward cyclical stocks with a yield and underweighting interest rate sensitive securities. This positioning has been working as of late and is likely how we will remain positioned until we see yields reaching a crescendo, where they would start to move lower. In the meantime, we have been taking advantage of the recent market weakness using dry powder (cash) to buy names on our shopping list that are now looking much more attractive.
Article by Craig Basinger, Chris Kerlow, Derek Benedet, Shane Obata, Richardson GMP


