Counter cyclical stocks, those in the consumer staples, health care, real estate, telecom and utilities sectors, continue to have a tough go at things. In fact, as of two days ago this group of bond proxies made a new low compared to all developed market stocks, thereby continuing and reinforcing a trend that has been in place since the middle of 2016. Why is that? Simply put, since the middle of 2016 it became clear that the US economy would soon close its output gap – the difference between actual and potential GDP – for the first time since 2007. The closing of the output gap is and was a significant development because it implies that the economy is growing at a faster rate than can be sustained without causing prices to rise. Said differently, in order to run the economy with a positive output gap, prices must rise. When prices rise, or rather, when market participants think prices will rise, investors will tend to assign a lower relative value to bonds and stocks that have similar characteristics as bonds (AKA counter cyclical stocks).

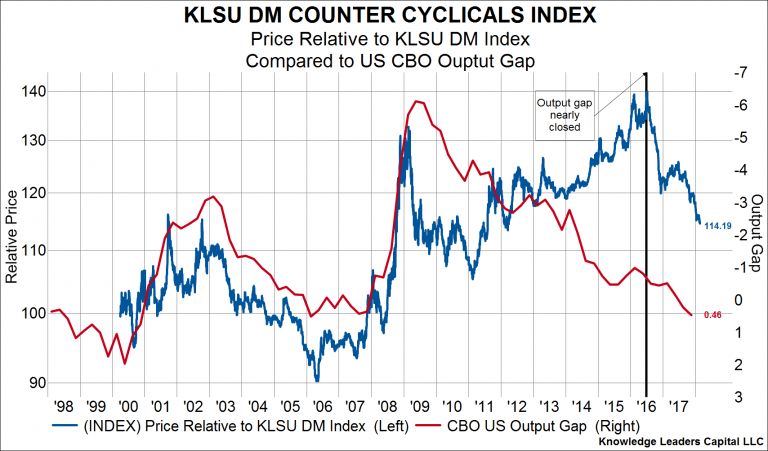
In the first chart below we show the price of developed market counter cyclical stocks relative to all developed market stocks (blue line, left axis) and overlay the Congressional Budget Office’s estimation of the output gap (red line, right axis, inverted). The relative outperformance trend of counter cyclical stocks ended when it became clear that the US output gap would eventually close.

This next chart below again shows counter cyclical stocks vs all developed market stocks, but this time we overlay the price of oil with the red line on the right, inverted axis. The price of oil rising is one symptom of the output gap closing, because the demand for oil increases with a closed output gap. The price of oil troughed in early 2016, just months before counter cyclical stocks stopped outperforming and began handily underperforming. Recently, counter cyclical stocks have made another leg lower as oil prices have risen towards $65/barrel.
Next, we show inflation expectations as priced by the bond market on the right, inverted axis. Inflation expectations began rising at the same time oil prices stopped falling, which again was just months before the relative performance of counter cyclical stocks peaked. As mentioned, a closed output gap will tend to push prices higher, and the bond market began pricing in such a scenario two years ago as the output gap was nearly closed. The fact that inflation expectations are now at a three and a half year high and rising is certainly consistent with counter cyclical stocks underperforming all stocks.
Finally, the last chart below overlays the US dollar index (red line, right axis) on top of the relative performance of counter cyclical stocks. The declining purchasing power of the US dollar is a residual of the higher inflation environment the financial markets are expecting. And, needless to say, the US dollar breaking to new lows not only implies more inflation ahead as import prices rise, but it’s also consistent with the new low in relative performance seen among counter cyclical stocks.


