“Go west, young man, and grow up with the country.”
Popularized by Horace Greeley, the editor of the New-York Tribune, these words formed one of the great catchphrases at the height of the Manifest Destiny era in the 19th century.

Although that period is still a few chapters back in the history books, the fact is the West Coast is still relatively new today. Los Angeles was only incorporated in 1850, Portland in 1851, and Seattle in 1869.
And throughout the 20th century – Americans were moving westward in droves, ultimately culminating in California taking over the title of the most populous state in the union by the year 1960.
Population Rank by State
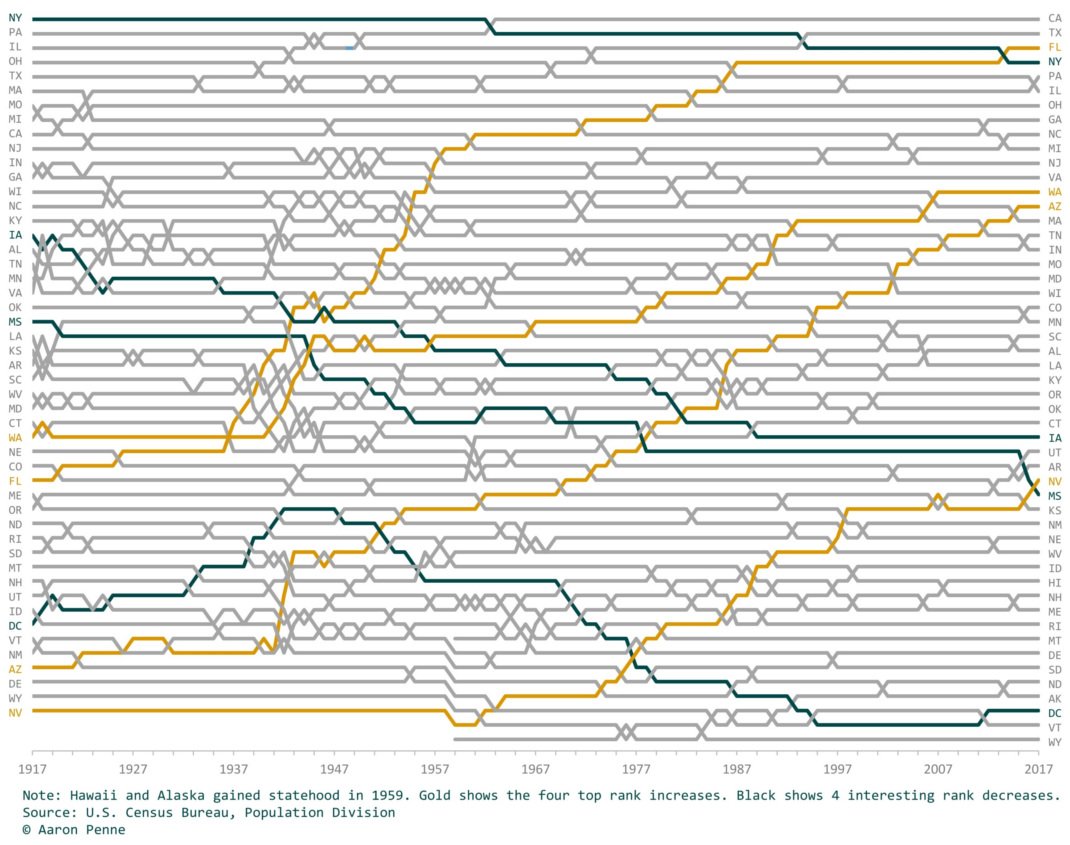
Today’s visualization is a bump chart from Aaron Penne, and it shows the population rank of U.S. states and D.C. over the timeframe of a century (1917-2017) using data from the U.S. Census Bureau.
When a state passes another in population in a given year, it “bumps” the other state from that place in the ranking. Big movers are also highlighted in orange (up) and black (down) on the graph.
Let’s look at the numbers for the first year on the graph, which is 1917:
| Rank | State | Population (1917) |
| #1 | New York | 9,993,000 |
| #2 | Pennsylvania | 8,578,000 |
| #3 | Illinois | 6,313,000 |
| #4 | Ohio | 5,510,000 |
| #5 | Texas | 4,563,000 |
| #6 | Massachusetts | 3,738,000 |
| #7 | Missouri | 3,470,000 |
| #8 | Michigan | 3,451,000 |
| #9 | California | 3,171,000 |
| #10 | New Jersey | 2,976,000 |
PreviousNext
New York led the pack with just short of 10 million people, which made up 10% of the population of the country as a whole. Meanwhile, California had only 3.2 million people – and amazingly, Nevada only had 81,000 people in 1917.
Now let’s jump forward 50 years to 1967, when the U.S. population was closer to 200 million.
| Rank | State | Population (1967) |
| #1 | California | 19,176,000 |
| #2 | New York | 17,935,000 |
| #3 | Pennsylvania | 11,681,000 |
| #4 | Illinois | 10,947,000 |
| #5 | Texas | 10,599,000 |
| #6 | Ohio | 10,414,000 |
| #7 | Michigan | 8,630,000 |
| #8 | New Jersey | 6,928,000 |
| #9 | Florida | 6,242,000 |
| #10 | Massachusetts | 5,594,000 |
In just half of a century, California gained 16 million people, and jumped to the #1 spot in the process. That’s a 504% increase over its 1917 population.
The Largest Increases in Population
For a final table data, we’ll show you the 2017 state populations compared to the 1917 state populations.
The table is sorted by the percentage increase over the course of that 100 years of time.
| Rank | State | Population (1917) | Population (2017) | % Increase |
| #1 | Nevada | 81,000 | 2,998,039 | 3,601% |
| #2 | Florida | 895,000 | 20,984,400 | 2,245% |
| #3 | Arizona | 311,000 | 7,016,270 | 2,156% |
| #4 | California | 3,171,000 | 39,536,653 | 1,147% |
| #5 | Utah | 444,000 | 3,101,833 | 599% |
| #6 | Texas | 4,563,000 | 28,304,596 | 520% |
| #7 | Colorado | 910,000 | 5,607,154 | 516% |
| #8 | New Mexico | 361,000 | 2,088,070 | 478% |
| #9 | Washington | 1,287,000 | 7,405,743 | 475% |
| #10 | Oregon | 763,000 | 4,142,776 | 443% |
Not surprisingly, Nevada takes the cake with a 3,601% gain, going from 81,000 people to today’s 2,998,039.
Meanwhile, North Dakota had the smallest gain – it only added 14% more people over a whole century of time.
Article by Jeff Desjardins, Visual Capitalist


