“Extended positioning argues at a minimum for a breather and more likely a pullback soon,” notes a January 31 cross-asset allocations research report from Deutsche Bank’s Asset Allocation research team The above statement, which as it turns out was highly accurate, is based on conclusions drawn from analysis of market positioning heading into the last week of January.

The report, compiled by Chief Strategist Binky Chadha and team, notes that momentum has been the primary driver of asset class returns for some time and these moves have “seen positioning build to extremes across asset classes, with many 1-3 standard deviations above average levels seen over the course of this cycle.”
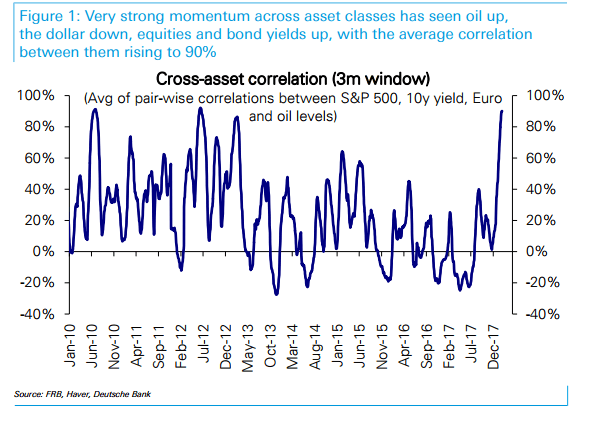
The overall correlation between bonds (10-year), equities (S&P 500), euro and oil has now surged to more than 90%, one of its highest levels ever reported.
Asset correlations rising on long positioning
Positioning in oil is particularly overextended. Deutsche’s figures show net long oil positioning is 2.8 standard deviations above average with net positioning growing more than 300% between June and the end of January. Even though there have been some fundamental improvements in the underlying oil market over the past two years, the rise in oil prices “has been closely tied to increased positioning, in our view leaving them vulnerable to an unwind.”
It's not just oil where extreme positioning is being recorded. According to Chadha’s report, positioning in the euro and yen is also very extended with long euro positioning at 1.7 standard deviations above average and short positioning in the yen at 1.4 standard deviations.
Short rates positioning meanwhile, is “back to all-time extremes reached post the 2016 Presidential election.”
The report goes on to say:
“From a fundamental perspective, we see rates as extremely mispriced relative to growth. The 10y yield was tightly tied to the manufacturing ISM for the 7 years during 2010-Mar 2017. The current level of the ISM points to the 10y 80bps higher. This disconnect between rates and growth began with the slowing in inflation which moves with long lags to growth and the dollar and we expect to move back up.”
And finally, with regards to equities long positioning is 1.5 standard deviations above average as margin debt has risen to extremes while cash balances have fallen below the normal range. However, at the time the report was issued Deutsche’s team saw no reason to believe that investors should be concerned about this positioning because recent inflows into equity funds “look largely to be a catch up for prior outflows.” 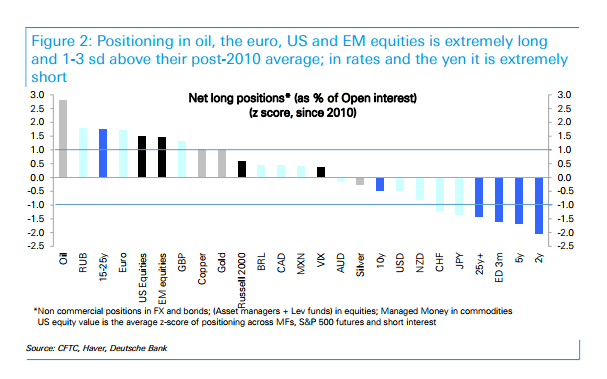
The report continues, “US equities have seen almost no inflows cumulatively since the start of the 15-month rally.” The report highlights oil as being the most vulnerable to any sort of positioning based correction:
“Oil looks most vulnerable from the vantage point of positioning. While it has been supported by a series of positive factors, a turn in any, especially a lagged increase in supply as is typical after periods of rising oil prices, risks a sharp positioning unwind.”


