Wedgewood Partners letter for the fourth quarter ended December 31, 2017; titled, “The Great Bull Market of 2009-2018: The Greatest.”
H/T Dataroma
I am the Greatest of All Time…I’m fast…I can’t possibly be beat…I’m pretty…I shook up the World! - Muhammad Ali
Review and Outlook
Our Composite (net-of-fees)i gained +20.4% during 2017. The benchmark Russell 1000 Growth Index gained a stunning +30.2%. The S&P 500 Index gained 21.8% during 2017.
Top 2017 performance detractors include Schlumberger, Celgene, Core Labs, Kraft Heinz and T.J. Maxx. Top 2017 performance contributors include PayPal, Apple, Visa, Berkshire Hathaway and Priceline.
Our Composite (net-of-fees) gained +8.5% during the fourth quarter of 2017. The benchmark Russell 1000 Growth Index gained +7.9%. The S&P 500 Index gained 6.6% during the quarter.
Top fourth quarter performance detractors include Celgene, Priceline, Schlumberger, Cognizant Technology and Kraft Heinz. Top fourth quarter performance contributors include Qualcomm, Fastenal, Ross Stores, Tractor Supply and PayPal.
During the fourth quarter, we increased our positions in Celgene and Edwards Lifesciences. We trimmed PayPal.
In an investing environment where every major index (and asset class) is at an all-time, nearly 9-year highs, we are still able – because of our focus – to construct a portfolio of growth companies with much better growth and profitability profiles but at quite favorable valuations. Specifically, our portfolio’s future annual EPS growth rate (IBES consensus) is projected to be approximately 15%. (Our internal growth rate is higher still.) The forward 12-month P/E is 22X. Our prospective growth rate is +29% higher than our benchmark and +51% higher than the S&P 500. Our forward 12-month P/E is -4% lower than our benchmark and at parity versus the S&P 500.
The Greatest
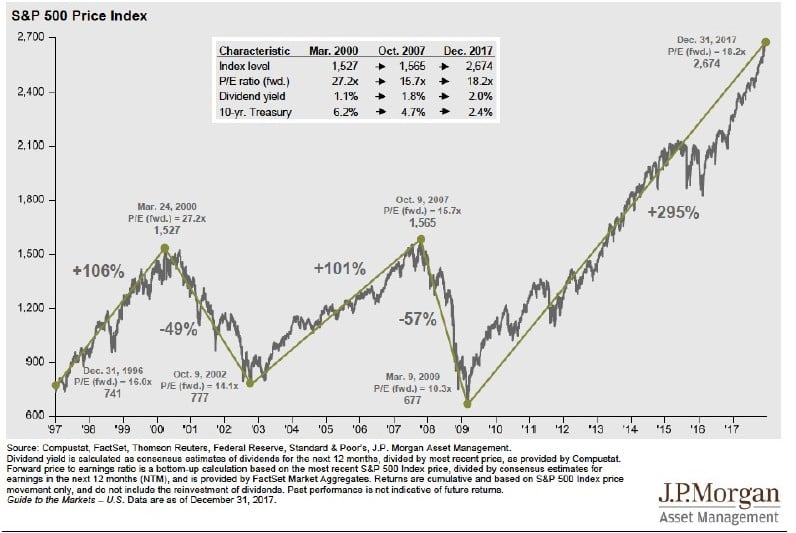
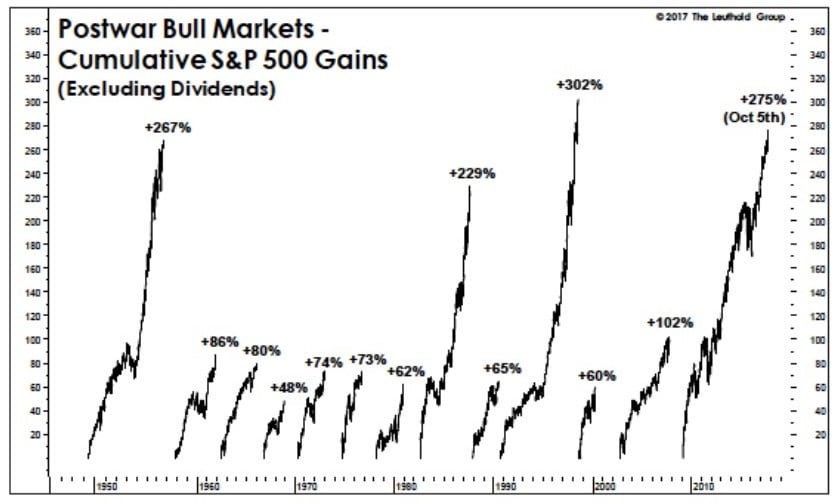
Back in 2016, we spent a goodly portion of our client letters putting this incredible bull market into historical context. 2017 was more of the same, whether it was the continued length of the bull market or the near-historic gains (set to eclipse the record +302% gains of the 1990s). In addition, we have chronicled historically high valuations that continue to get pushed into risky territory, as well as the incredible monies allocated to passive investing from active managers, the historically low volatility, etc. As we now look back upon 2017, we admit that we are running out of superlatives. This incredible bull market is now just two short months shy of its ninth anniversary.
The fourth quarter continued what began during the third quarter, in that more than a few of our non-tech portfolio holdings finally started to “catch a bid.” The hit parade during much of this bull market has been dominated by technology stocks – particularly the largest capweighted technology stocks. Indeed, the five largest stocks in our benchmark (Apple, Alphabet, Microsoft, Amazon and Facebook) now makeup an astonishing 24% of the Russell 1000 Growth Index.
Further, the benchmark’s tech stock weighting (using S&P GICS, which does not include Amazon) is nearly +38% and now above where it peaked back in those heady tech stock days in March of 2000. Even in our focused portfolio, we struggle to find that much compelling opportunity without significantly compromising future returns.
Technology’s current weighting contrasts with the financial and energy sectors, the latter two of which collectively represent less than 5% of the entire Russell 1000 Growth Index. Our bottom-up investment process makes us hardly a “bull” on any industry, but a prospective “equal-weight” in a roughly 20-stock portfolio is about 5%, so a single holding can easily skew our industry weightings, given that the fine folks at Russell seem to be OK with carrying sub-1% weightings in very large sectors of the U.S. economy. Suffice it to say that we find enough compelling growth in the underrepresented industries to warrant inclusion of a few holdings in our portfolio.
Peering across the stylistic grid, it is no secret that the Russell 1000 Value Index must also be particularly lop-sided – indeed, with a 26% weighting in financials and 11% weighting in energy, it is also not surprising that Growth has dramatically outperformed Value in 2017, not to mention most of the duration of this bull market (more on this later).
As long-term, multiyear investors in highly profitable, growing, large-cap businesses, such businesses accumulate significant amounts of retained earnings. As shareholders, these retained earnings, that capital, is “ours.” As long-term shareholders, we typically don’t demand that such retained capital be returned to shareholders in the form of stock buybacks or via dividends (we don’t care to own bond proxies). In effect, our attitude is that we, as shareholders (partners, really), are effectively providing capital to management to be reinvested back into our companies. Thus, we heartily encourage and expect our companies to reinvest large enough amounts in retained capital to create enough value by generating further high returns on a growing capital base. This compounding effect is the financial mother’s milk to then, in turn, drive future double-digit earnings growth.
Today, our double-digit return hurdle relative to the market has rarely seemed higher, as we observe marginally-profitable, large businesses able to borrow at interest rates that are negative.2 We think our demand for double-digit returns looks positively quaint (pun intended) in this narrow light. But if debt and equity are substitutes, it begs to wonder what a guaranteed loss of principle looks like in the equity realm. We imagine the equity analog looks something like a large company that regularly loses money, but regularly issues stock. We have seen several large technology companies that issue 5 to 10% of their stock every year, for years on end. The influx of capital to fund those numerous, and regular offerings has been truly remarkable, but also completely undemanding from a profitability perspective. As a competing source of finance, we think indexation has risen to prominence on a kernel of truth, and a mountain of indiscriminate return requirements, as over $10 trillion in capital has been injected into public markets over the past decade, courtesy of the three largest central banks on the planet.
Alas, we can nearly always complain about monetary stimulus, if only because it has run completely counter to our philosophy as investors. On a brighter note, we expect recent fiscal stimulus to benefit our great businesses that do generate pre-tax profits, in the form of lower corporate tax rates. After all, few if any growth companies can invest 100% (or more) of their excess capital, year in and year out, and get a return on every single dollar (or even a majority of those dollars) – we think even the shrewdest, most successful businesses and management teams are right 60-70% of the time. So, we are more than forgiving when our companies generate copious amounts of pre-tax profitability. As such, many of our internally-funded businesses – particularly those focused on the U.S. market – should reap a windfall of cost-less (at the margin) capital, and put them on a more even playing field relative to those businesses that regularly access negative cost capital.
How good is the stock market right now?? Freeze time. This is as good as it gets for the stock market!
- The gain from the March lows of 2009 is +310% which equals the incredible bull market gain of the 1990’s – but so many more stocks and sectors have soared relative to the tech/telecom 1990’s bull market.
- Up 20 out past 21 quarters.
- Up past 14 months in a row.
- 2017 – the 8th year, mind you, of this Great Bull Market – was up +20% and up EVERY month during the year!
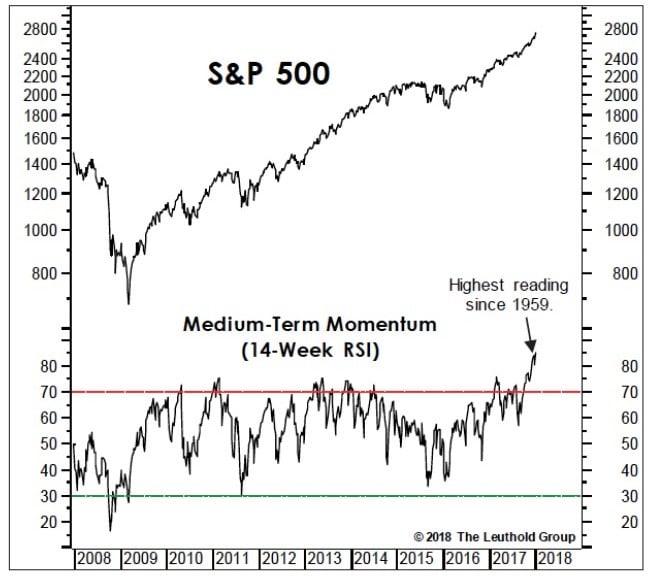
- The current momentum is literally off the charts. The Dow Jones Industrial Average’s Relative Strength Index is at 90! That’s the highest since 1959! The S&P 500 Index’s RSI is almost 97! That’s the highest since 1929!!!
This moment in time is Wayne Gretsky scoring 92 goals in a single season. This is Joe DiMaggio hitting safely in 72 out of 73 games; Wilt Chamberlain scoring 100 points in a single game for the old Philadelphia Warriors. This is Ted Williams batting .406. This is Secretariat at the Belmont. Good grief, this is Spinal Tap going to 11!
See the full PDF below.


