
Wes asked that I contribute to the ongoing debates regarding the construction of value and momentum portfolios.

There are three key research pieces on the topic, all with different viewpoints:
I encourage everyone to dig into the three articles above and then tackle my article below. And if you are interesting in learning more about factor investing, you can sign up for our free newsletter here.
Hope you learn something…
Introduction
Being a Value investor is difficult, given that the stocks of a Value portfolios tend to have inherent issues, otherwise, these stocks would not be cheap. Being a B/M-focused value investor over the past decade has been especially hard, as the factor returns were effectively zero – plenty of pain, but no gain. Experiencing this factor cyclicality often leads investors to contemplate adding other factors in the hope of improving performance. An obvious candidate would be Momentum, as cheap and rising stocks are more appealing than cheap stocks. However, it is not quite straightforward for investors to add Momentum to a Value portfolio as there are several options available. In this short research note, we will analyze Value & Momentum portfolios created by three common multi-factor model approaches – the combination, the intersectional and the sequential models.
Methodology
We focus on the Value and Momentum factors in the US stock market. The factors are created by constructing long-short beta-neutral portfolios of the top and bottom stocks ranked by the factors. Portfolios rebalance monthly and include 10bps of transaction costs. Only companies with a market capitalization of larger than $1 billion are included.
The following three multi-factor models are utilized:
- Combination model: Single factor portfolios are created and combined into one portfolio
- Intersectional model: Stocks are ranked by several factors simultaneously
- Sequential model: Stocks are sorted by factors sequentially
The portfolios are created so that they approximately contain the same number of stocks, which equates to the top and bottom 10% of the universe of 1,800 stocks. For a detailed report on these three models please see our white paper Multi-factor Models 101.
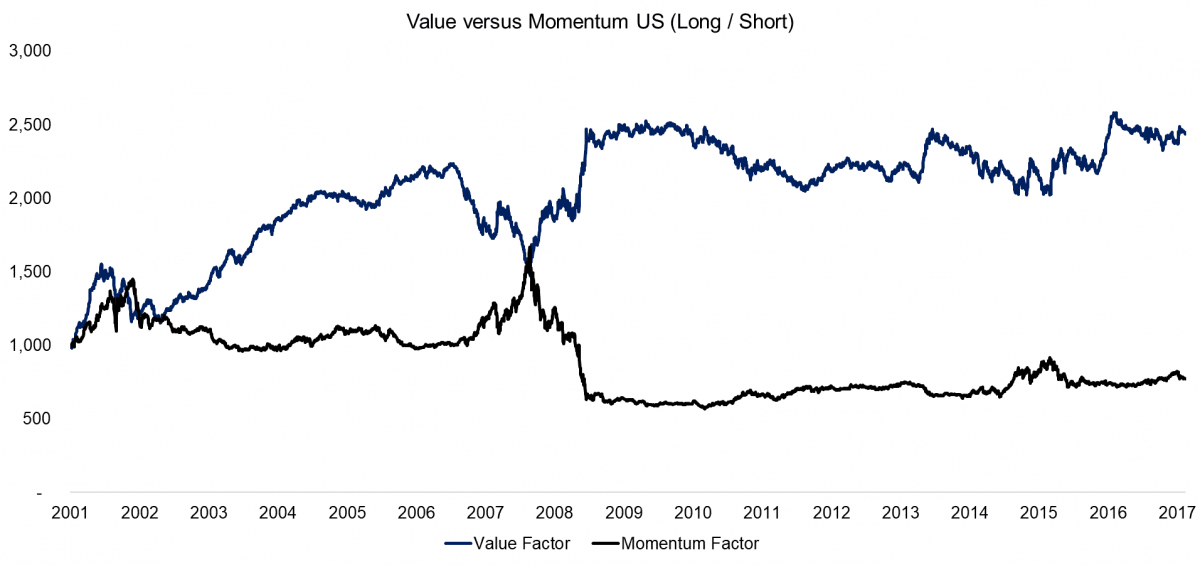
Value Versus Momentum (Long / Short)
The chart below shows the performance of the Value and Momentum factors in the US. We can observe that there were periods, e.g. during the Global Financial Crisis in 2007 to 2009, where the two factors exhibited significant negative correlation. The Momentum crash of 2009 is also clearly visible, which occurred when markets started recovering and the short side of Momentum outperformed the long side significantly. In theory, it should be attractive to add Momentum to a Value portfolio from a diversification perspective given the low or negative correlation.
Source: FactorResearch. The results are hypothetical results and are NOT an indicator of future results and do NOT represent returns that any investor actually attained. Indexes are unmanaged, do not reflect management or trading fees, and one cannot invest directly in an index.
Value & Momentum Factor Portfolios: Combination Vs Intersectional Model
The chart below shows the performance of two Value & Momentum factor portfolios, one created via the combination and the other via the intersectional model. We can observe that the trends are quite similar, but that the intersectional portfolio shows far higher returns. The combination model creates Value and Momentum portfolios separately and then combines these two portfolios, which likely contains conflicting positions as Value and Momentum are often negatively correlated, e.g. a stock in the long portfolio of Value might be in the short portfolio of Momentum. The intersectional model selects the stocks at the intersection of the two factors.

Source: FactorResearch. The results are hypothetical results and are NOT an indicator of future results and do NOT represent returns that any investor actually attained. Indexes are unmanaged, do not reflect management or trading fees, and one cannot invest directly in an index.
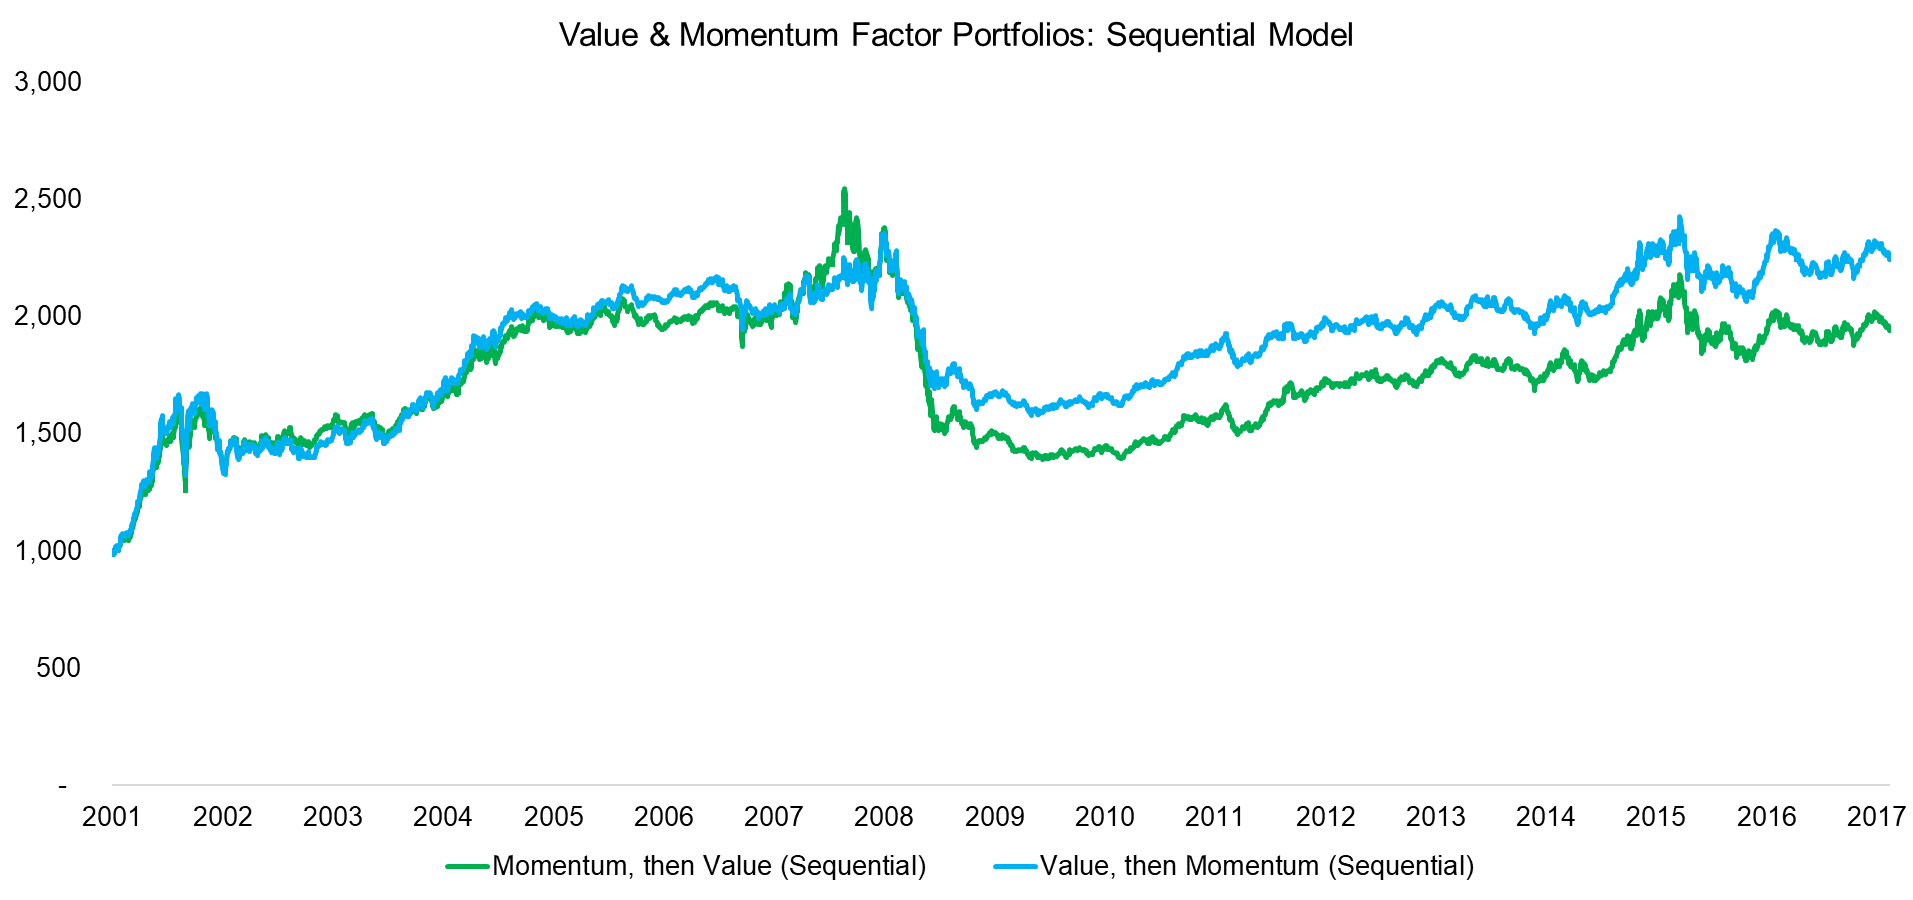
Value & Momentum Factor Portfolios: Sequential Model
The sequential model ranks stocks for factors sequentially, which requires investors to prioritize factors. This approach is unique given that after each ranking the universe of stocks shrinks significantly, resulting in a very concentrated portfolio. The chart below shows the performance of two portfolios, one ranked first on Value and then Momentum and the other one in the inverse order. We can observe that the profiles look almost identical, which is somewhat surprising. We do see that the portfolio ranked first on Momentum experienced a steeper decline during the Momentum crash, but the diversification benefits seem to be much lower compared to the combination or intersectional model.
Source: FactorResearch. The results are hypothetical results and are NOT an indicator of future results and do NOT represent returns that any investor actually attained. Indexes are unmanaged, do not reflect management or trading fees, and one cannot invest directly in an index.
Value & Momentum Portfolios: Model Comparison
The chart below contrast all models and we can see that the results are overall comparable in terms of trend. Based on this analysis the intersectional model seems to be most attractive, but it somewhat depends on the observation period. If there are no strong increases or decreases in factor performance, then all models are comparable in terms of performance. However, when factor performance is particularly strong or very negative, e.g. for Momentum in 2009, then intersectional model seems to do better, which may be explained by less extreme portfolios.

Source: FactorResearch. The results are hypothetical results and are NOT an indicator of future results and do NOT represent returns that any investor actually attained. Indexes are unmanaged, do not reflect management or trading fees, and one cannot invest directly in an index.
Risk Metrics
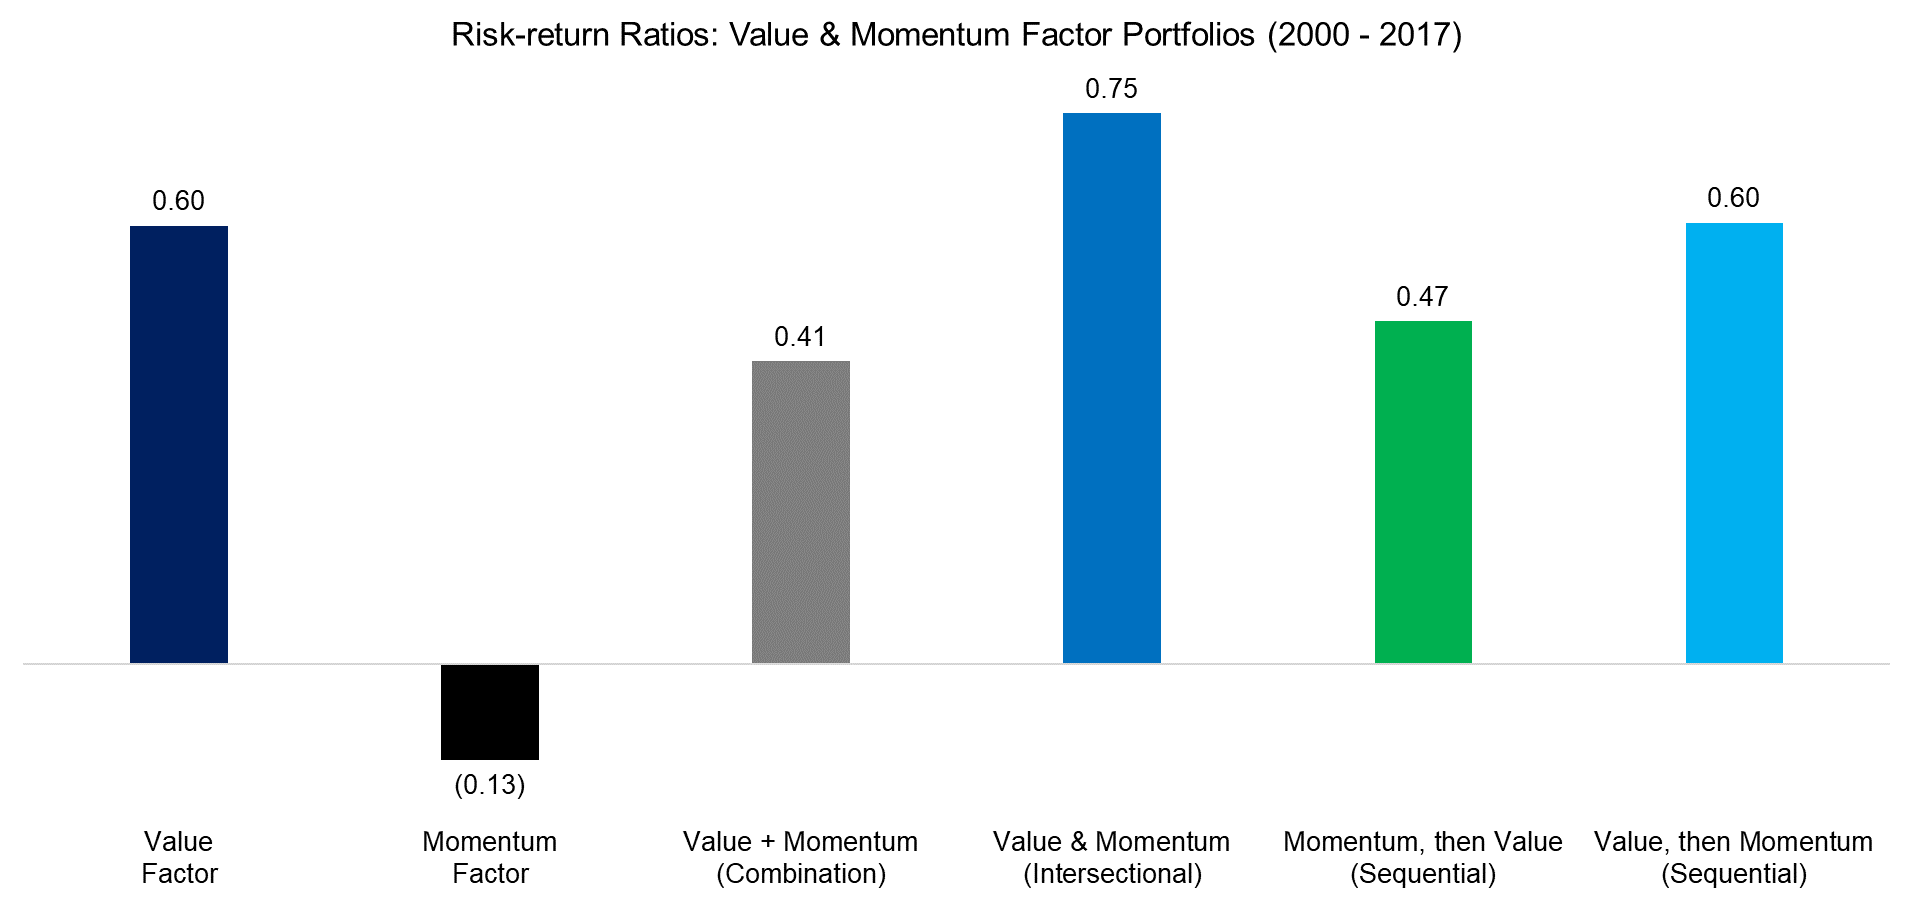
In addition to displaying the performance, we can also analyze the risk metrics of the different portfolios. The graphic below highlights that the intersectional portfolio generated the highest risk-return ratio for the period from 2000 to 2017 and is the only portfolio that achieves a higher ratio than the Value factor on a stand-alone basis. It is worth highlighting that Momentum crashes a very rare (1932 & 2009) and if we would have picked a different observation period, then adding Momentum might have led to more attractive multi-factor portfolios.
Source: FactorResearch. The results are hypothetical results and are NOT an indicator of future results and do NOT represent returns that any investor actually attained. Indexes are unmanaged, do not reflect management or trading fees, and one cannot invest directly in an index.
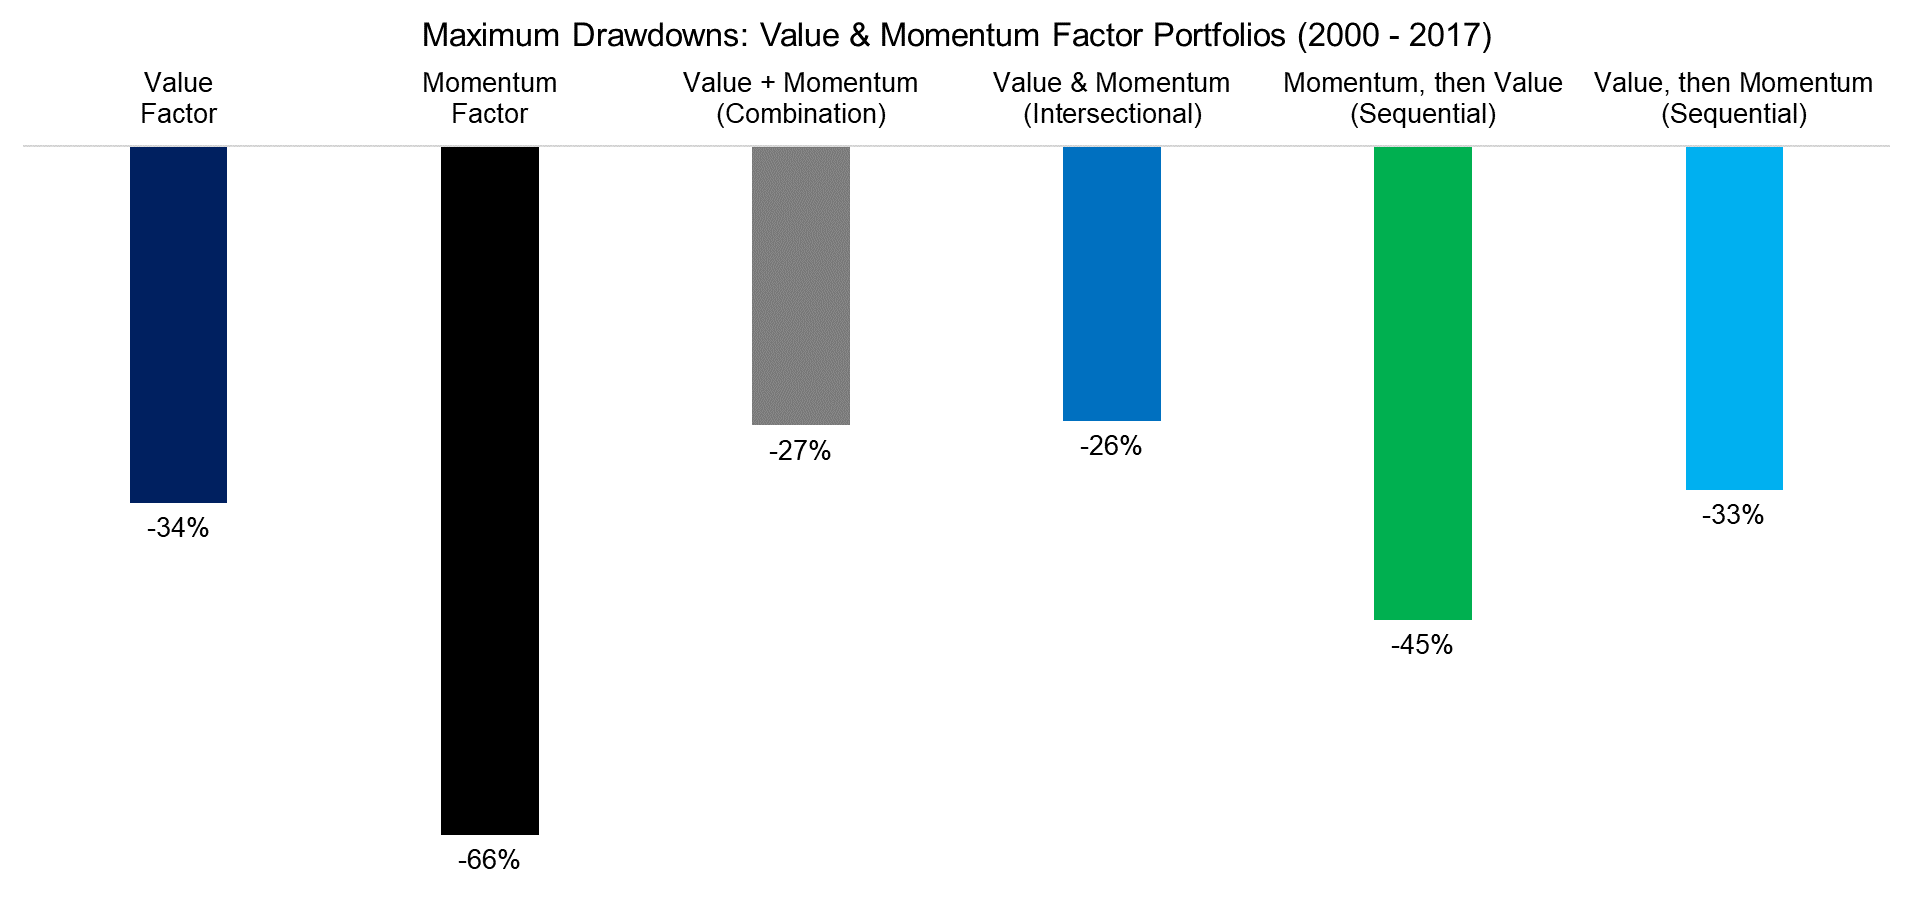
We can also analyze the maximum drawdowns, which highlight diverse results for the multi-factor portfolios. The drawdowns of the combination and intersectional portfolios are lower than that of the stand-alone Value portfolio, while this is not the case for the sequential portfolios.
Source: FactorResearch. The results are hypothetical results and are NOT an indicator of future results and do NOT represent returns that any investor actually attained. Indexes are unmanaged, do not reflect management or trading fees, and one cannot invest directly in an index.
This short research note highlights different ways of combining Value and Momentum factors. In hindsight adding other factors, e.g. Low Volatility, should have been more profitable as Momentum in the US did not generate attractive returns during the last two decades. However, the long-term track record for these two factors is quite favorable and adding factors that have done better, i.e. performance chasing, is unlikely a recipe for success.
- The views and opinions expressed herein are those of the author and do not necessarily reflect the views of Alpha Architect, its affiliates or its employees. Our full disclosures are available here. Definitions of common statistics used in our analysis are available here (towards the bottom).
- Join thousands of other readers and subscribe to our blog.
- This site provides NO information on our value ETFs or our momentum ETFs. Please refer to this site.
Article By Nicolas Rabener, Alpha Architect


