The goal of most investors is to either:
- Maximize returns given a fixed level of risk
- Minimize risk given a particularly level of desired returns
Perhaps the best metric for analyzing both risk and return is the Sharpe Ratio. With that in mind, we’ve compiled a list of all stocks in the S&P 500 sorted by 5-Year Sharpe Ratio, which you can access below.
ValueWalk readers can click here to instantly access an exclusive $100 discount on Sure Dividend’s premium online course Invest Like The Best, which contains a case-study-based investigation of how 6 of the world’s best investors beat the market over time.
The list of S&P 500 stocks sorted by Sharpe Ratio available for download above has the following metrics for each of the constituents of the index:
- Sharpe Ratio
- Dividend yield
- Price-to-earnings ratio
- Market Capitalization
- 5-Year Beta
Keep reading this article to learn more about using the Sharpe Ratio to analyze publicly-traded investments.
How To Use The Sharpe Ratios List To Find Compelling Investment Ideas
Having an Excel document with all the S&P 500 stocks sorted by their 5-year Sharpe Ratios can be extremely useful.
The resource becomes even more powerful when combined with a rudimentary knowledge of how to use the filter function of Microsoft Excel to find investment ideas.
With that in mind, this section will show you step-by-step how to implement a particular investing screen using the Sharpe Ratio stocks list. More specifically, we’ll show you how to screen for stocks with 5-year Sharpe Ratios above 1 and forward price-to-earnings ratios below 20.
Step 1: Download the Sharpe Ratio Stocks List by clicking here.
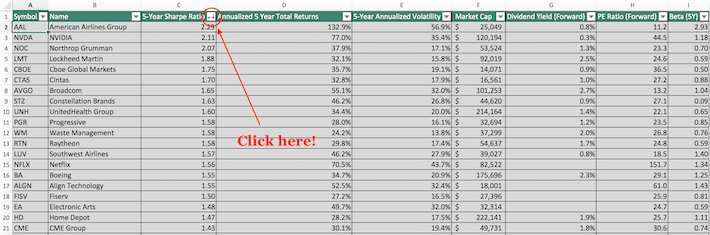
Step 2: Click the filter icon at the top of the Sharpe Ratio column, as shown below.
Step 3: Change the filter setting to “Greater Than” and input 1 into the field beside it, as shown below. This filters for S&P 500 stocks with Sharpe Ratios higher than 1.

Step 4: Close out of the filter window (by clicking the exit button, not by clicking the “Clear Filter” button in the bottom right corner). Then, click the filter icon at the top of the price-to-earnings ratio column, as shown below.

Step 5: Change the filter setting to “Less Than” and input 20 into the field beside it, as shown below. This filters for S&P 500 stocks with forward price-to-earnings ratios less than 20.

The remaining stocks in this Excel document are S&P 500 stocks with trailing 5-year Sharpe ratios higher than 1 and forward price-to-earnings ratios less than 20.
You now have a solid fundamental understanding of how to use the Sharpe Ratios list to find investment ideas.
The remainder of this article will provide more information on how to analyze stocks using the Sharpe ratio.
What Is The Sharpe Ratio?
The Sharpe ratio is the financial industry’s favorite measure of risk-adjusted returns. It tells investors whether they are being appropriately rewarded for the risks they’re assuming in their investments.
The Sharpe ratio is calculated with the following formula:

There are three components to the Sharpe Ratio calculation:
- Investment return
- Risk free rate of return
- Investment standard deviation
Investment return and investment standard deviation are relatively straightforward and require no explanation.
The risk free rate of return can be different depending on your use case. For most investors, a suitable risk free rate of return is the current yield on 10-year U.S. government bonds. That is the convention used in the Sharpe ratio spreadsheet available for download at the top of this article.
The Sharpe ratio is rarely calculated by hand in practice. Instead, investors generally use a tool such as Microsoft Excel for the purpose of Sharpe ratio calculations.
How To Manually Calculate Sharpe Ratios Using Yahoo! Finance
At Sure Dividend, we use YCharts for much of our data analytics. YCharts requires a paid subscription that many of our readers do not have. Accordingly, we want to show you how to manually calculate Sharpe Ratio for publicly-traded stocks over a given time period.
More specifically, this tutorial will show you how to calculate a 3-year Sharpe ratio for Apple, Inc (AAPL).
Step 1: Navigate to Yahoo! Finance.
Step 2: Type the ticker of your desired stock into the search bar at the top of the Yahoo! Finance bar. In our case, it’s Apple (AAPL), as shown below.

Step 3: Click on historical data, as shown below.

Step 4: Change the dates to the range of your choice, and then click “Apply.” After that, click “Download Data” (which is just below the Apply button).

Step 5: The Excel document that will download as a result of your process so far will have six columns: Open, High, Low, Close, Adjusted Close (or “Adj Close” in the top row of the spreadsheet), and Volume. It’s Adjusted Close that we’re interested in, as this accounts for stock splits and dividend payments.
Using the adjusted close column, calculate the stock’s annualized returns during the time period under investigation. In the example shown below, this is done by dividing the current price by the oldest price and then raising this to the inverse power of the number of years during the sample. The equation is shown below.

Step 6: Next, a time series of daily returns needs to be calculated. This is done in column I in the spreadsheet shown below.

Step 7: Calculate the standard deviation of daily price returns using the STDEV.P() function, and then convert this number to an annualized figure by multiplying by the square root of 252. We use 252 instead of 365 (the number of days in a year) because there is approximately 252 trading days in an average calendar year. The formula to calculate the annualized standard deviation figure is shown below.

Step 8: Use the annualized return and annualized standard deviation data to calculate a Sharpe ratio. An example of how to do this is shown below, using 2.4% as the risk free rate of return.

The resulting number is the Sharpe ratio of the investment in question. In this case, Apple had a 3-year Sharpe ratio of 0.62 at the time of this writing.

Final Thoughts
Looking for stocks with strong historical Sharpe ratios is a useful way to find investment ideas.
With that said, this strategy is not the only way to find high-quality investments. To conclude this article, we’ll provide additional resources that you can use in your investment due diligence.
If you are looking for high-quality dividend growth stocks suitable for long-term investment, the following databases will be useful:
- The Dividend Aristocrats List: 25+ years of consecutive dividend increases.
- The Dividend Achievers List: 10+ years of consecutive dividend increases.
- The Dividend Kings: Widely considered to be the “best-of-the-best” when it comes to dividend growth streaks, the Dividend Kings are an exclusive group of dividend stocks with 50+ years of consecutive dividend increases.
You may also be looking for appealing stocks from a certain stock market sector to ensure appropriate diversification within your portfolio. If that is the case, you will find the following resources useful:
- The Complete List Of All Dividend-Paying Utility Stocks
- The Complete List Of All Dividend-Paying Healthcare Stocks
- The Complete List Of All Dividend-Paying Technology Stocks
- The Complete List Of All Dividend-Paying Telecommunications Stocks
- The Complete List Of All Dividend-Paying Materials Stocks
- The Complete List Of All Dividend-Paying Industrial Stocks
- The Complete List Of All Dividend-Paying Consumer Cyclical Stocks
- The Complete List Of All Dividend-Paying Consumer Staples Stocks
- The Complete List Of All Dividend-Paying Energy Stocks
- The Complete List Of All Dividend-Paying Financial Stocks
You may also wish to consider investments within the major market indices. The most well-known benchmarks for large- and small-cap U.S. stocks can be accessed below:
- The Complete List Of S&P 500 Stocks
- The Complete List Of Russell 2000 Stocks
Another great place to look for investment opportunities is in the international stock markets. If that appeals to you, the following international stock market indices will be useful:
- The Complete List Of FTSE 100 Stocks
- The Complete List Of Nikkei 225 Stocks
Thanks for reading this article. Please send any feedback, corrections, or questions to [email protected].
Article by Sure Dividend
The world’s best investors have trounced the market decade-after-decade. The course Invest Like The Best uses actionable cases studies from investors like Warren Buffett, Peter Lynch, Seth Klarman (and more) to teach you the tools and techniques of super investors. Click here to enroll today and save $100.


