Original article on TimeMoney.com
Previously, we did an article showing why the above average Shiller PE is bad for long term future stock returns. That’s a straightforward argument. The multiple is high, which means stocks are expensive. In a normal PE calculation, markets and stocks can be the worst buys when they have low multiples because earnings are the highest at the peak of the cycle, but the Shiller PE adjusts for cyclicality. However, in adjusting for cyclicality it’s ignoring the possibility that earnings growth could be faster in the future. This leads us to the first point in our discussion of why stocks might not underperform over the next 10 years even though the CAPE is high.

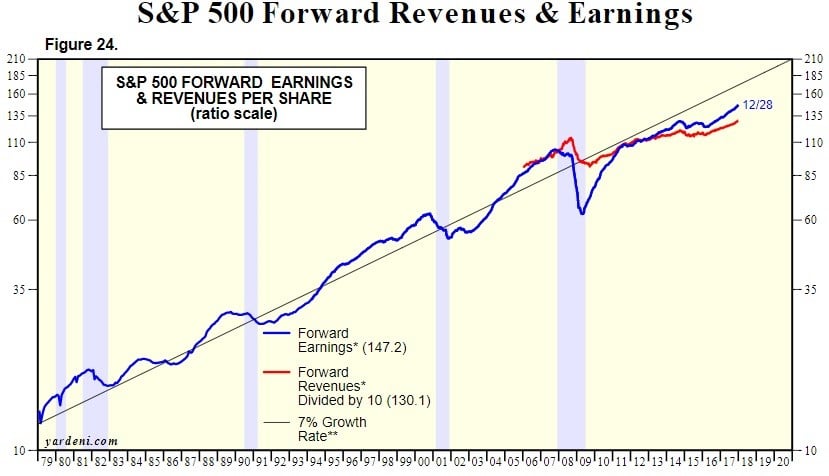
If earnings stay on the trajectory that forecasts expect, it’s not surprising to see the Shiller PE higher than normal because it includes old data. Stocks are valued based on future earnings, so it’s immaterial if the past earnings have a high multiple. As you can see, even with this expansion being the 3rd longest ever, earnings haven’t recovered to the long term 7% growth trend line.

Earnings Growth Could Catch Up To The Long Term Trend
Making up ground means faster than 7% growth for a couple years. Therefore, even though the Shiller PE claims to be cyclical, it doesn’t do a perfect job of correcting for changes in the acceleration of earnings growth.
Earnings Blip Pushes CAPE Too High
The best argument the bulls have against CAPE is that it includes an artificially low 2008 earnings period during the depths of the financial crisis. While the Shiller PE is supposed to include recessions, this decline was larger than normal. You can see the crash in the green line in the chart below. This as reported metric will roll off in a year, lowering the CAPE and making it more accurate. A lower CAPE is less bearish.
2008 Had A Bigger Than Usual Decline
Cyclicality In Correlation
It’s ironic that the Shiller PE, which is supposed to adjust for cyclical changes in earnings, is cyclical as well. The chart below shows the rolling correlation between the CAPE and equity returns.
CAPE’s Effectiveness Is Variable
The returns over 10 year periods are not always in line with what the CAPE suggests. It’s ability to forecast returns varies. For example, in January 1996, the Shiller PE was 24.76 which might indicate you should sell your stocks. However, stocks outperformed for the nest few years as the bull market was just starting its rally. The fact that such booms and busts exist provide huge opportunities for traders, but not for those using the Shiller PE. You can argue they were too disciplined in the 1990s which is a nice way of saying they were wrong and missed out years of gains.
Weighting Changes Show Why It’s Different This Time
The stock market has changed over time. The dynamic which shows how the market is different is the sector weighting. An analogy for this situation is how you think of some emerging market countries as proxy bets on commodities. Their economies are reliant on raw materials related sectors more than others. This makes their valuations differ from other countries. Just as the US stock market is different from emerging markets, the market of today is different from the past. As you can see from the chart below, the S&P 500 is completely different now than it was in 1989.
More Tech Means The CAPE Should Be Higher
Technology companies have almost 5 times the index weighting now than 28 years ago. Tech firms push the CAPE higher because they have high margins. This means the current stagnant way the CAPE is constructed is overly bearish. The only justification for this is the implication that margins come down in every industry over time. Investors who were bullish have laughed all the way to the bank, as software companies have high margins for years, while bearish investors wait for the competition to bring down margins.
New Metric: CATY
There are other metrics which are effective at valuation besides CAPE. One of them is CATY which was created by Morningstar.
CATY Shows Stocks Aren’t That Expensive
CATY is the cyclically adjusted total yield which takes into account cash payouts such as buybacks and dividends because cash flow is a better proxy of valuations than earnings. The correlation between the two is 91%, but they sometimes diverge because of changes in capital returned to shareholders. In the 1950s, firms retained more earnings which made the CATY higher than the CAPE. Now firms are giving out more cash to shareholders (buybacks especially) which makes the CAPE higher than the CATY. Since 1970 the CATY has done better than CAPE at explaining the variability in returns. CATY explains 23.6% and CAPE explains 8.8%. Therefore, a more accurate valuation shows stocks are less expensive than the CAPE leads investors to believe, meaning you should temper your bearishness.
Consider Buying Value Stocks
Since we discussed buying emerging markets if you’re bearish because of CAPE, in this article we’ll give a suggestion to look into for bullish investors. The suggestion is to look into going long value stocks. From 2007 to 2017, the Russell 1000 growth fund was up 139% while the Russell 1000 value fund was only up 49%. For the Russell 2000 the performance was 133% and 56% respectively. The chart below shows when the Fed is hiking rates, value stocks usually outperform growth stocks. With the Fed’s hike cycle expected to go at least another one year, value stocks might be the dog that has its day in 2018.
Buy Value If You’re Bullish
Conclusion
The goal of this discussion is to show where the Shiller PE can go wrong. Relying on any one metric can be perilous since market dynamics change over time, as we have explained, making the comparisons apples to oranges, not apples to apples. It can be wrong if earnings growth is faster than the past as it catches up to the long term average of 7%. Its variability makes it wrong sometimes as it has bad timing. If tech margins stay high, this market is different than the past, so the average CAPE is irrelevant. A more relevant metric has been CATY since 1970. If you’re bullish on stocks, consider buying value stocks. Not all stocks are created equal.
Disclaimer: This content is for general informational and entertainment purposes only and should not be construed as financial advice. You agree that any decision you make will be based upon an independent investigation by a certified professional. Please read full disclaimer first on TimeMoney.com.


