According to Bank of America’s Chief Investment Strategist Michael Hartnett, if the S&P 500 continues to rally as it has done for the first few weeks of the year, by the end of 2018, the index will have surpassed 6,000. Only a few weeks (and around 100 S&P points later) after Hartnett publish this staggering observation, BoA Investment Strategist James Barty re-ran the numbers and concluded that a target of 7,000 is now more appropriate. After taking into account this forecast, it’s no surprise that Barty’s report concludes that the market is now looking “a little stretched”, although the 7,000 is a bit more surprising.
Pension Outflows This Month Will Be Largest Ever Recorded: Morgan Stanley

Stocks Look Overbought
Published at the end of last week, Barty's report is titled "It’s all starting to get a little stretched," a conclusion reached based on market technicals. Indeed, the report points out that while the fundamentals look "good" technically, markets are overstretched.
We have been bullish equities and defensive rates for a long time but sometimes you can have too much of a good thing. Equity markets have completely ripped since the start of the year, so much so that Michael Hartnett has calculated that the S&P 500 would top 6,000 by year end if we carried on like this (we re-calculated and as of now
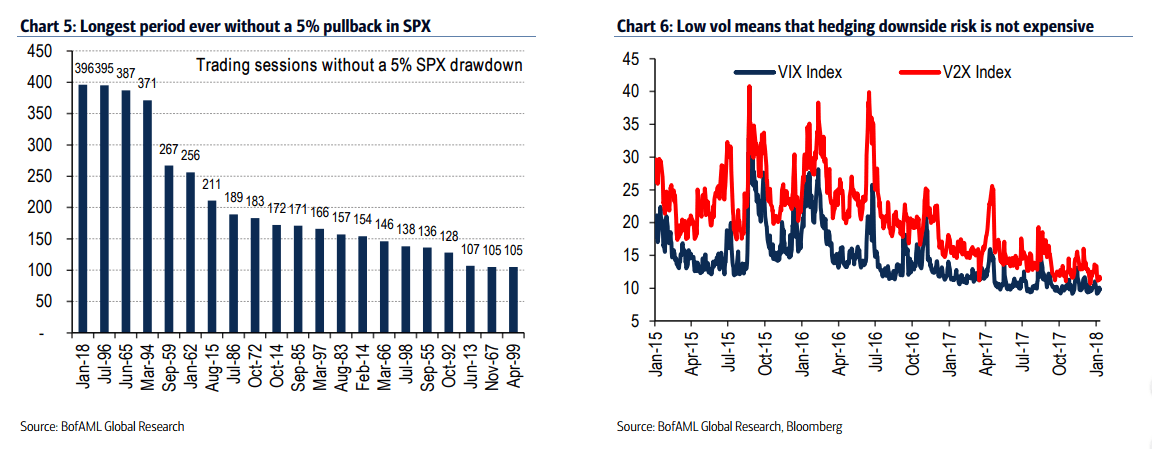
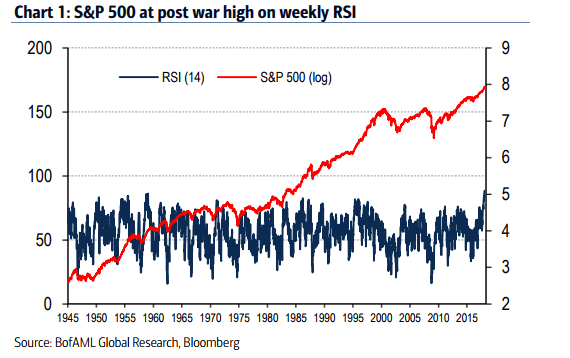
it’s >7k!)."The period without a 5% pullback is now at an all time high and the weekly RSI on the S&P 500 is at a post war high. As we noted on the front page it doesn’t stop at the S&P, other equity markets are following suit with the RSI on the HSI at 88! "
It's not just the technicals that are hinting at the idea that the market is starting to move into "melt-up" territory. Last week, BoA's flows data showed a massive $23.9 billion one week flow into equities, while the 4-week flow was the biggest ever at $58 billion. A total of $21 billion of that money was poured into exchange-traded funds while a record $2.1 billion flowed into tech stocks, $8.1 billion into emerging market shares, $7 billion into US markets as well as $4.6 billion and $3.4 billion respectively into European and Japanese stocks.
It's not just ETFs that are seeing rising flows. For the first time in several years, active fund managers are making a comeback. Four week flows into active equity funds rose to a four year high according to BoA's data.
The big question is: are we seeing a 1999/2000s style melt-up right now? Even though earnings growth (BoA has penciled in double-digit US earnings growth for 2018) explains some of the recent rise in equity values, market returns of 6% per month are not sustainable in the long run. As Barty's report concludes, the longer the market goes without a significant pullback, the more likely it is that it will experience one:
"So what to do? Could there be a melt up, like 1999/2000? Well anything is possible and FOMO (or the fear of missing out) can be a powerful driver. Nevertheless, our job is to look at markets in probabilistic terms. Can we carry on at 6%+ per month? No. Are markets overbought? Yes. Are our models telling us it is getting a bit frothy? Yes. Are we finally meeting clients who are more bullish than us? Yes. In addition we have now broken the record for the longest period of time without a 5% correction in the S&P500. Sooner or later we will have one of those corrections and the more markets melt up the more likely it is."
Caveat emptor!


