Key Takeaways
- The recent lack of volatility in the U.S. stock market has been historic on many levels.
- The long absence of market volatility greatly increases the odds that 2018 may see multiple pullbacks.
- We believe strong global fundamentals may offer an opportunity to use potential pullbacks as a chance to add to portfolio positions.

The equity market action over the past year is truly historic on many levels. It is important to recognize how unique this time frame has been and that a more volatile 2018 may be likely, and quite frankly normal. This week we will highlight some of the amazing streaks that have taken place, list a few of the reasons why we should anticipate a pickup in volatility, and explain how any possible weakness can provide suitable investors with an opportunity in diversified portfolios.
How Rare Have Things Been?
Below are five S&P 500 Index observations to illustrate just how unique the recent market activity has been:
- The year 2017 was the first in history that the S&P 500 closed higher on a total return basis (including dividends) all 12 months of a calendar year. Should the S&P 500 close higher in January (up 7.2% as of January 26, 2018), this would be a record 15 consecutive months higher on a total return basis. The previous record (since 1950) was 11 consecutive months set twice during the 1950s, most recently in 1958–59.*
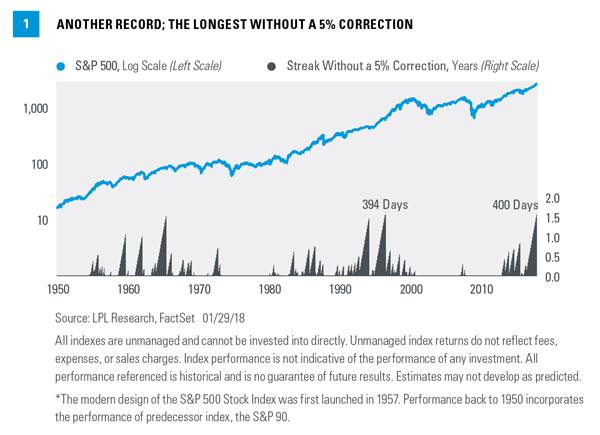
- The index has officially gone 400 trading days without a 5% correction, which is the longest stretch in history. A week ago today the index broke the previous record of 394 trading days set during the mid-1990s. As Figure 1 shows, the current streak started right after the Brexit vote in the United Kingdom in June 2016 and is now more than 18 months old. It is worth noting that previous long streaks took place during bull markets, but once the streaks ended the bull markets continued for some time.
- The S&P 500 was positive year to date every single day last year, marking 1 of only 10 years since 1950 to accomplish that feat. In fact, the index hasn’t been negative year to date since late June 2016, now the fifth longest streak ever without a negative year-to-date day.
- Incredibly, the S&P 500 hasn’t posted a 1% drop in 112 trading days, tying the longest streak since 1985. This is all the more amazing considering there was a 109-day streak that ended in March 2017. In other words, two of the four longest streaks without a 1% drop over the past 50 years took place within the past 15 months.
- January is picking up right where 2017 left off, as the S&P 500 is up approximately 7% for the month. This would be the best January to start a year since 1989. It doesn’t end there though, as the S&P 500 has closed at a new high 14 times so far this month — the most ever during the month of January and the most for any month since June 1955.
Though good starts to a year can be a positive sign, that doesn’t mean the ride will be smooth. For example, since 1950, when the month of January finishes up 5% or more, the remaining 11 months have been higher 11 of the past 12 times; but during those years, the average intra-year maximum drawdown (peak-to-trough decline) has been 10.7%. In other words, this strong January for stocks could signal a continuation of the bull market but also more potential volatility as well.
*The modern design of the S&P 500 Stock Index was first launched in 1957. Performance back to 1950 incorporates the performance of predecessor index, the S&P 90.
Potential Warning Signs?
For investors, it is always important not to confuse genius with a bull market. The historical lack of volatility can easily be accompanied by complacency, as various sentiment and fund flow indicators recently suggested. Although the market will always do what the market wants to do, we think the possibility for increased volatility is strong, and that several historical patterns may once again surface in the coming weeks or months. Take a look at three potential warning signs:
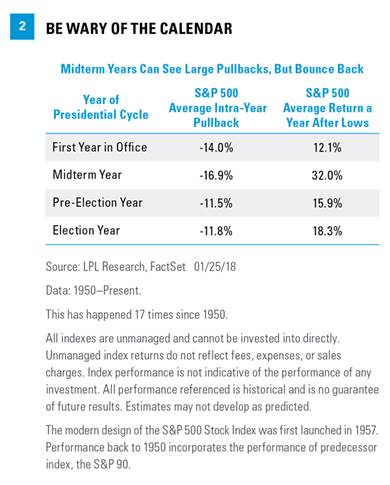
- Presidential cycle. Midterm election years can be troublesome, with the S&P 500 down on average 16.9% at its lows for the year — the worst out of the four years of a president’s term (based on data dating back to 1950) [Figure 2]. Although this is worrisome in the short term, the good news is that a strong bounce back is common. In fact, a year after the lows are made in a midterm election year, the S&P 500 is up 32.0% on average. We took a closer look at this phenomenon on our blog.
- Markets tend to test new Federal Reserve (Fed) chairs. Since Charles Hamlin was sworn in as the very first Fed chair in 1914, there have been 15 others, with Jerome Powell set to become the sixteenth on February 3, 2018. History has shown that markets can indeed test new Fed chairs. In fact, going back more than 100 years, the Dow has been down 0.3% on average during the first six months after a new Fed chair takes office. Turning to more recent history, since 1950, the average intra-year drawdown for the S&P 500 during the first calendar year of a new Fed chair has been 15.0%.
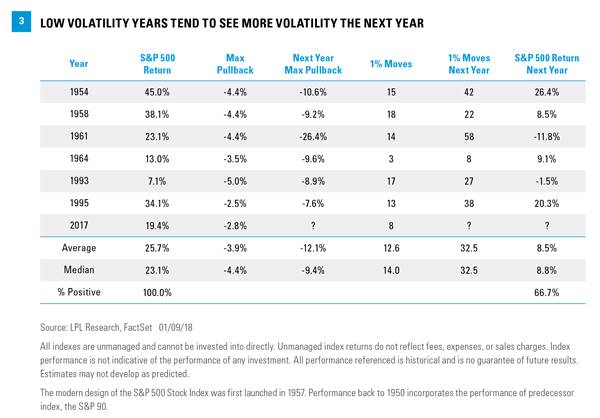
- Low volatility years are followed by higher volatility years. The S&P 500 pulled back only 2.8% from peak to trough last year, for the second smallest annual pullback ever. There have only been five other years without a 5% correction, and every single time the pullback the next year was larger.
In fact, the average pullback the following year was 12.1%, with a median pullback of 9.4%; those declines were accompanied by a surge in 1% daily changes the following year. Yet, as Figure 3 shows, the good news is that in many cases the bull market continued, though with a bumpier ride, climbing an average of 8.5% in the following year.
Diversification And Rebalancing
Stocks may experience more frequent — and larger — pullbacks in 2018 for these or possibly other reasons, such as geopolitical risk, an unexpected increase in inflation, or a sharp rise in interest rates. But the historical data cited above make a good case for buying dips in 2018 when they come.
The fundamentals support buying dips as well. Global economic growth is accelerating. Corporate profits are rising at a solid pace globally and U.S. profits should get a nice boost this year from the new tax law. As we get more clarity from corporate America about the impact of the tax law during the ongoing earnings season, the risk to our $147.50 S&P 500 earnings forecast for 2018 is to the upside.*
We continue to view any pullback as an opportunity to add, as rebalancing to target allocations is prudent for long-term portfolios. Despite the strong start to the year for stocks, and the S&P 500 approaching the upper end of our year-end fair value range at 2900, we still believe further gains may lie ahead. We maintain cyclical positioning in our model portfolios, including targeting small cap and value tilts.
Conclusion
The recent streak of market tranquility is one for the ages and we do not think it will continue much longer. This isn’t a bad thing, though, as any weakness could present an attractive buying opportunity for suitable investors. Buying the dips has been a prudent strategy during midterm election years historically, and throughout this bull market, while the macroeconomic backdrop is supportive, including accelerating global economic growth, strong earnings gains, and the impact of the new tax law. Bottom line, stay the course, look for further gains over the balance of the year, but be prepared for the possibility of a typical, yet bumpier ride.
Special thanks to Jeffrey Buchbinder for his contributions to this week’s publication.
Article by LPL Financial


