The Dividend Aristocrats are among the best-of-the-best when it comes to dividend growth stocks. The requirements to be a Dividend Aristocrat are:
- 25+ years of consecutive dividend increases
- Membership within the S&P 500
- Certain minimum size and liquidity requirements

Click here to download your Dividend Aristocrats Excel Spreadsheet List now.
It takes a strong and defensible competitive advantage for a company to raise its dividend each year for more than two decades. Accordingly, the Dividend Aristocrats are some of the most recession-resistant stocks around.
This article will analyze the performance of every current Dividend Aristocrat during the Great Recession of 2007-2009 by looking at both their earnings-per-share and stock price performance.
Table of Contents & Methodology
We analyze each Dividend Aristocrats by looking at their earnings trends during the 2007-2009 financial crisis as well as their stock price performance. You can view the finalized ranking of the Aristocrats’ recession performance by clicking here.
We also have a video analyzing the performance of this elite group of dividend stocks, which you can view below:
Alternatively, you can skip to analysis on any individual Dividend Aristocrat by clicking below.
- AbbVie Inc. (ABBV)
- Abbott Laboratories (ABT)
- Archer-Daniels-Midland Co. (ADM)
- Automatic Data Processing (ADP)
- Aflac Inc. (AFL)
- Air Products and Chemicals (APD)
- Becton-Dickinson & Co. (BDX)
- Franklin Resources (BEN)
- Brown-Forman Corporation (BF.B)
- Cardinal Health Inc. (CAH)
- Cincinnati Financial Corporation (CINF)
- Colgate-Palmolive Co. (CL)
- Clorox Co. (CLX)
- Cintas Corporation (CTAS)
- Chevron Corporation (CVX)
- Dover Corporation (DOV)
- Ecolab Inc. (ECL)
- Consolidated Edison Inc. (ED)
- Emerson Electric Co. (EMR)
- Federal Realty Investment Trust (FRT)
- General Dynamics (GD)
- Genuine Parts Co. (GPC)
- W.W. Grainger Inc. (GWW)
- Hormel Foods Corporation (HRL)
- Illinois Tool Works (ITW)
- Johnson & Johnson (JNJ)
- Kimberly-Clark Corporation (KMB)
- The Coca-Cola Company (KO)
- Leggett & Platt (LEG)
- Lowe’s Company Inc. (LOW)
- McDonald’s Corporation (MCD)
- Medtronic Inc. (MDT)
- McCormick & Company Inc. (MKC)
- 3M Company (MMM)
- Nucor Corporation (NUE)
- PepsiCo Inc. (PEP)
- Procter & Gamble Company (PG)
- Pentair PLC (PNR)
- PPG Industries Inc. (PPG)
- Sherwin-Williams Company (SHW)
- S&P Global (SPGI)
- Stanley Black & Decker Inc. (SWK)
- Sysco Corporation (SYY)
- AT&T Inc. (T)
- Target Corporation (TGT)
- T. Rowe Price Group Inc. (TROW)
- V.F. Corporation (VFC)
- Walgreens Boots Alliance (WBA)
- Wal-Mart Stores Inc. (WMT)
- Exxon Mobil Corporation (XOM)
AbbVie Inc. (ABBV) Recession Performance
AbbVie is a large bipharmaceutial company known for its flagship drug Humira, which is the highest-grossing drug in the world and contributes more than 60% to AbbVie’s total revenue.
AbbVie was spun-off from Abbott Laboratories in early 2015, so the company was not actually its own publicly-traded entity at the time of the Great Recession. For information on how AbbVie’s previous parent company performed during the Great Recession, see the historical data from Abbott Laboratories below.
Return To The Table Of Contents
Abbott Laboratories (ABT) Recession Performance
Abbott Laboratories is a diversified healthcare company with a market capitalization of $102 billion. The company was founded in 1888 and is headquartered in Lake Bluff, Illinois.
As a healthcare company, Abbott Laboratories is very recession-resistant. The company’s fundamental financial performance during the 2007-2009 financial crisis can be seen below:
- 2007 adjusted earnings-per-share of $2.84
- 2008 adjusted earnings-per-share of $3.03 (6.7% increase)
- 2009 adjusted earnings-per-share of $3.72 (22.8% increase)
- 2010 adjusted earnings-per-share of $4.17 (12.1% increase)
Remarkably, Abbott Laboratories managed to increase its adjusted earnings-per-share during each year of the 2007-2009 financial crisis. This growth was not slow, either – Abbott Laboratories’ earnings-per-share expanded at a cumulative annualized growth rate (CAGR) of 13.7% during this time period.
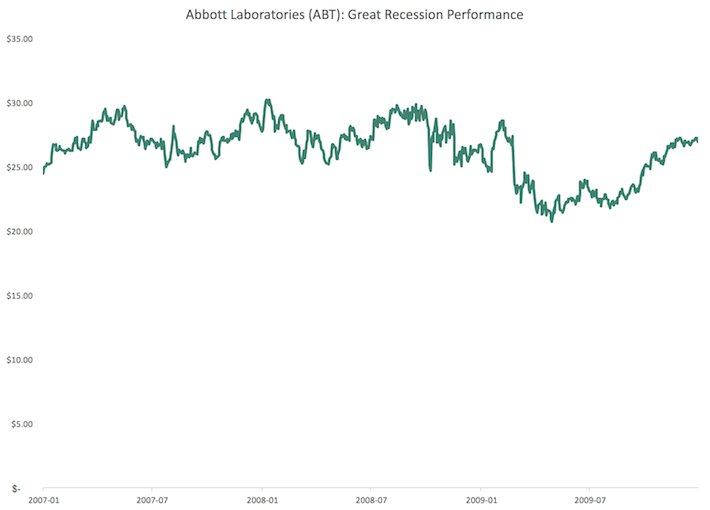
Abbott Laboratories’ stock price performed similarly well during this economic catastrophe. The company’s stock price from 2007-2009 can be seen below.
Source: YCharts
Between the beginning of 2007 and the beginning of 2009, the company’s stock traded at a high of $30.25 and a low of $20.76 for a peak-to-trough decline of 31%. This ranks in the 98th percentile among Dividend Aristocrats. Abbott Laboratories is one of the most recession-resistant stocks among this already-defensive group of high-quality businesses.
Return To The Table Of Contents
Archer-Daniels-Midland Co. (ADM) Recession Performance
Archer-Daniels-Midland is an agricultural giant that operates in more than 160 countries and generates more than $60 billion of annual revenue.
The company’s adjusted earnings-per-share trend during the Great Recession can be seen below:
- 2007 adjusted earnings-per-share of $2.38
- 2008 adjusted earnings-per-share of $2.84 (19% increase)
- 2009 adjusted earnings-per-share of $3.06 (7.7% increase)
- 2010 adjusted earnings-per-share of $3.06
Archer-Daniels-Midland’s adjusted earnings-per-share continued to rise through the Great Recession. This is because the company’s performance is much more reliant on commodity prices than economic activity.
Still, the company’s share price declined noticeably during this time period, as shown below.

Source: YCharts
Archer-Daniels-Midland’s stock fluctuated from a high of $48.18 to a low of $15.29 during calendar years 2007-2009 for a peak-to-trough decline of 68%. This ranks in the 10th percentile among Dividend Aristocrats.
Accordingly, Archer-Daniels-Midland is far from the most recession-resistant Dividend Aristocrat (although its stock did rebound shortly thereafter and continued its long history of steady dividend increases).
Return To The Table Of Contents
Automatic Data Processing (ADP) Recession Performance
Automatic Data Processing is a business services outsourcing company that was founded in 1949. The company is the leading payroll and human services technology company with more than 700,000 clients in more than 110 countries worldwide.
The company’s adjusted earnings-per-share performance during the Great Recession can be seen below.
- 2007 adjusted earnings-per-share of $1.83
- 2008 adjusted earnings-per-share of $2.20 (20% increase)
- 2009 adjusted earnings-per-share of $2.39 (8.6% increase)
- 2010 adjusted earnings-per-share of $2.39 (flat)
Automatic Data Processing’s adjusted earnings-per-share rose each and every year of the 2007-2009 financial crisis. The company’s share price also performed reasonably well and can be seen below.

Source: YCharts
During the 2007-2009 financial crisis, Automatic Data Processing’s stock price declined from a high of $50.11 to a low of $31.03 for a peak-to-trough decline of 38%. This ranks in the 78th percentile of Dividend Aristocrats, making this stock an excellent recession-resistant business for the conservative, risk-averse investor.
Return To The Table Of Contents
Aflac Inc. (AFL) Recession Performance
Aflac is a globalized insurance company with significant operations in Japan and the United States. The company’s adjusted earnings-per-share performance during the Great Recession can be seen below:
- 2007 adjusted earnings-per-share of $3.27
- 2008 adjusted earnings-per-share of $2.62 (20% decline)
- 2009 adjusted earnings-per-share of $3.91 (49% increase)
- 2010 adjusted earnings-per-share of $5.13 (31% increase)
Aflac’s earnings experienced a 20% decline during the recession but rebounded quickly to new highs in subsequent fiscal years.
Although its earnings managed to hold up reasonably well during the recession, its stock price dropped like a rock – presenting a compelling buying opportunity. Aflac’s share price performance in the recession can be seen below.

Source: YCharts
Aflac’s stock price declined from a high of $68.22 to a low of $11.49 during the 2007-2009 financial crisis. This represents a peak-to-trough decline of 83.1% – which is in the 2nd percentile among Dividend Aristocrats. Aflac is one of the least recession-resistant Dividend Aristocrats, although it did continue its long history of steady dividend increases during this difficult operating environment.
Return To The Table Of Contents
Air Products and Chemicals (APD) Recession Performance
Air Products & Chemicals is one of the leading collectors and distributors of process and atmospheric gases for industrial customers. The company’s earnings-per-share performance during the 2007-2009 financial crisis can be seen below.
- 2006 adjusted earnings-per-share: $3.50
- 2007 adjusted earnings-per-share: $4.40
- 2008 adjusted earnings-per-share: $4.97
- 2009 adjusted earnings-per-share: $4.06
- 2010 adjusted earnings-per-share: $5.02
Air Products & Chemical’s earnings declined by 18% during the Great Recession. The company’s share price also experienced a noticeable decline, as shown below.
Source: YCharts
During the 2007-2009 financial crisis, Air Products & Chemicals’ stock price declined from a high of $98.03 to a low of $38.51 for a peak-to-trough decline of 60.7%. This is in the 28th percentile among Dividend Aristocrats, meaning that the company is only moderately recession-resistant when compared to the other high-quality businesses within this exclusive list.
Return To The Table Of Contents
Becton-Dickinson & Co. (BDX) Recession Performance
Becton-Dickinson is a global medical supply company that has been in business for nearly 120 years and employs approximately 40,000 people in more than 50 countries.
The company’s adjusted earnings-per-share performance during the Great Recession can be seen below:
- 2007 earnings-per-share of $3.84
- 2008 earnings-per-share of $4.46 (16% increase)
- 2009 earnings-per-share of $4.95 (11% increase)
- 2010 earnings-per-share of $4.94 (0.2% decline)
The company experienced a very minor $0.01/share decline in earnings during fiscal 2010, but its performance otherwise was very strong.
Becton-Dickin’s stock price performance can be seen below.
Source: YCharts
Becton-Dickinson’s stock price declined from $92.34 to $60.26 during the 2007-2009 financial crisis. This represents a decline of 34.7%, ranking n the 88th percentile among the Dividend Aristocrats. Accordingly, Becton-Dickinson is one of the most defensive businesses among this exclusive list of dividend stocks.
Return To The Table Of Contents
Franklin Resources (BEN) Recession Performance
Franklin Resources provides asset management services to retail and institutional investors under the working name Franklin Templeton Investments.
The company’s earnings-per-share performance during the Great Recession can be seen below:
- 2007 earnings-per-share of $2.37
- 2008 earnings-per-share of $2.24 (5.5% decline)
- 2009 earnings-per-share of $1.30 (42% decline)
- 2010 earnings-per-share of $2.12 (63% increase)
- 2011 earnings-per-share of $2.89 (36% increase)
Franklin Resources’ earnings declined from $2.37 to $1.30 during the financial crisis but rebounded to $2.89 during fiscal 2011. The company’s earnings are clearly susceptible to contractions in overall economic activity.

Source: YCharts
Franklin Resources’ stock price dropped from $47.98 to $12.89, representing a peak-to-trough decline of 73.1%. This ranks in the 6th percentile among the Dividend Aristocrats. Franklin Resources’ business model is prone to rapid declines in earnings during recessions, which can be seen in both its fundamental financial performance and its stock price movement during the 2007-2009 financial crisis.
Return To The Table Of Contents
Brown-Forman Corporation (BF.B) Recession Performance
The Brown-Forman Corporation is a manufacturer and distributor of alcoholic beverages most well-known for its flagship Jack Daniels whiskey brand.
The company’s adjusted earnings-per-share performance during the 2007-2009 financial crisis can be seen below:
- 2007 adjusted earnings-per-share of $0.95
- 2008 adjusted earnings-per-share of $0.96 (1% increase)
- 2009 adjusted earnings-per-share of $1.03 (7.3% increase)
- 2010 adjusted earnings-per-share of $1.19 (15% increase)
Brown-Forman managed to increase its earnings each year of the financial crisis, a rare accomplishment that demonstrates the defensiveness of its business model.
Unfortunately, the following image shows how its stock price did not perform as well, losing more than half of its pre-recession market value.
Source: YCharts
Brown-Forman’s stock price declined from a higher of $26.16 to a low of $12.33 during the 2007-2009 financial crisis, which marks a peak-to-trough decline of 52.8%. This ranks in the 52nd percentile among the Dividend Aristocrats. Accordingly, the company is only moderately recession-resistant when compared to the other securities in this investment universe.
Return To The Table Of Contents
Cardinal Health Inc. (CAH) Recession Performance
Cardinal Health is one of the “big three” medical distribution companies along with AmerisourceBergen (ABC) and McKesson (MCK).
The company’s earnings-per-share trend during the 2007-2009 Great Recession can be seen below:
- 2007 adjusted earnings-per-share of $3.41
- 2008 adjusted earnings-per-share of $3.80 (11% increase)
- 2009 earnings-per-share of $2.26 (40% decline)
- 2010 earnings-per-share of $2.22 (1.8% decline)
On the surface, this performance looks terrible (especially for a healthcare company). Importantly, the largest factor influencing Cardinal Health’s financial performance during this time period is the company’s spinoff of CareFusion. The company’s segment earnings, segment revenues, and dividends continue to rise despite this spinoff.
The impact of the spinoff can also be seen in Cardinal Health’s stock price performance, which is shown below.
Source: YCharts
Cardinal Health’s stock price declined from a high of $75.28 to a low of $24.97 during the 2007-2009 financial crisis. This marks a peak-to-trough decline of 66.8% which ranks in the 14th percentile among Dividend Aristocrats.
Again, this seems to indicate that Cardinal Health is not very recession-resistant when compared to other Dividend Aristocrats. This is not the case.
As mentioned before, this is partially due to the spinoff of CareFusion. Cardinal Health’s healthcare-focused business model means it is far more recession-resistant than its quantitative history would suggest.
Return To The Table Of Contents
Cincinnati Financial Corporation (CINF) Recession Performance
The Cincinnati Financial Corporation is a diversified insurance company founded in 1950.
The company’s earnings-per-share performance during the Great Recession can be seen below:
- 2007 adjusted earnings-per-share of $3.54
- 2008 adjusted earnings-per-share of $2.10 (41% decline)
- 2009 adjusted earnings-per-share of $1.32 (37% decline)
- 2010 adjusted earnings-per-share of $1.68 (27% increase)
Cincinnati Financial’s earnings declined precipitously during the Great Recession, as did its stock price (as shown in the following image).

Source: YCharts
Cincinnati Financial’s stock price declined from $47.62 to $18.1 during the Great Recession for a peak-to-trough decline of 62.0%. This ranks in the 22nd percentile among Dividend Aristocrats, so Cincinnati Financial is far from the most recession-resistant member of this exclusive group of dividend growth stocks.
Return To The Table Of Contents
Colgate-Palmolive Co. (CL) Recession Performance
The Colgate-Palmolive Company is a manufacturer, distributor, and marketer of oral care and home cleaning products.
The company’s fundamental performance during the 2007-2009 financial crisis can be seen below:
- 2007 adjusted earnings-per-share of $1.69
- 2008 adjusted earnings-per-share of $1.83 (8.3% increase)
- 2009 adjusted earnings-per-share of $2.19 (20% increase)
- 2010 adjusted earnings-per-share of $2.16 (1.4% decline)
Colgate-Palmolive continued to grow its profits during the recession (despite a slight $0.03/share decline in 2010). Its bottom line performance indicates that it is very recession-resistant.
The company’s stock price performance corroborates this belief:
Source: YCharts
Colgate-Palmolive’s stock price declined from $43.16 to $27.39 during the 2007-2009 financial crisis for a peak-to-trough decline of 36.6%. This ranks among the 82nd percentile of Dividend Aristocrats, showing that this stock makes a solid defensive position for the conservative investor.
Return To The Table Of Contents
Clorox Co. (CLX) Recession Performance
The Clorox Company is a manufacturer, distributor, and marketer of home cleaning products – most notably its namesake “Clorox” cleanser.
The company’s fundamental performance during the Great Recession can be seen below:
- 2007 adjusted earnings-per-share of $3.23
- 2008 adjusted earnings-per-share of $3.24 (0.3% increase)
- 2009 adjusted earnings-per-share of $3.81 (18% increase)
- 2010 adjusted earnings-per-share of $4.24 (11% increase)
Clorox managed to steadily increase its adjusted earnings-per-share during the Great Recession – a remarkable feat for any business. The company’s stock price also fared very well:

Source: YCharts
Clorox’s stock decline from $68.5 to $45.9 during the Great Recession, which represents a peak-to-trough decline of 33.0%. This ranks in the 94th percentile of the Dividend Aristocrats, making this stock one of the most recession-resistant members of this already-defensive universe of marketable securities.
Return To The Table Of Contents
Cintas Corporation (CTAS) Recession Performance
Cintas Corporation is a specialty laundry manufacturer that produces corporate uniforms, entrance mats, and other laundry products.
The company’s bottom line performance during the Great Recession can be seen below:
- 2007 adjusted earnings-per-share of $2.09
- 2008 adjusted earnings-per-share of $2.15 (2.9% increase)
- 2009 adjusted earnings-per-share of $1.83 (15% decline)
- 2010 adjusted earnings-per-share of $1.49 (19% decline)
Cintas’ earnings declined during the Great Recession as corporations reduced their spending on new uniforms and other laundry products.
The company’s stock price also suffered from this trend.
Source: YCharts
Cintas’ stock price declined from $42.81 to $18.15 during the Great Recession. This represents a decline of 57.6% (40th percentile among the Aristocrats). Cintas is slightly below average when it comes to recession resiliency for Dividend Aristocrats.
Return To The Table Of Contents
Chevron Corporation (CVX) Recession Performance
Chevron Corporation is a large multinational energy corporation with a market capitalization of $254 billion. The company’s only domestic competitor of similar size is fellow Dividend Aristocrat Exxon Mobil.
Chevron’s fundamental performance during the global financial crisis is listed below:
- 2006 adjusted earnings-per-share: $7.80
- 2007 adjusted earnings-per-share: $8.77
- 2008 adjusted earnings-per-share: $11.67
- 2009 adjusted earnings-per-share: $5.24
- 2010 adjusted earnings-per-share: $9.48
- 2011 adjusted earnings-per-share: $13.44
Chevron’s earnings fluctuated wildly during the recession, but its stock price performed far better.
Source: YCharts
Chevron’s stock price declined from $103.09 to $56.46 during the financial crisis. This 45.2% decline ranks in the 60th percentile of the Dividend Aristocrats Index. Chevron is surprisingly recession-resistant considering that it is part of the volatile energy sector.
Return To The Table Of Contents
Dover Corporation (DOV) Recession Performance
Dover Corporation is an industrial manufacturing firm with annual revenues that exceed $7 billion.
The company’s adjusted earnings-per-share performance during the 2007-2009 financial crisis can be seen below:
- 2007 adjusted earnings-per-share of $3.22
- 2008 adjusted earnings-per-share of $3.67 (14% increase)
- 2009 adjusted earnings-per-share of $2.00 (45% decline)
- 2010 adjusted earnings-per-share of $3.48 (74% increase)
Dover’s earnings fell by 45% during the recession but regained most of their losses in the subsequent fiscal year. The company’s stock price performed similarly poorly, as you can see below:
Source: YCharts
Dover Corporation’s stock price fell from $54.44 to $22.06 during the 2007-2009 recession, which is a 59.4% decline and ranks in the 32nd percentile of the Aristocrats Index. The company is below average – compared to these other high-quality dividend stocks, at least – in its ability to endure economic contractions.
Return To The Table Of Contents
Ecolab Inc. (ECL) Recession Performance
Ecolab is a manufacturer of chemical cleaning products with a market capitalization of $40 billion. The company’s earnings-per-share performance during the Great Recession can be seen below:
- 2006 adjusted earnings-per-share of $1.43
- 2007 adjusted earnings-per-share of $1.66 (16% increase)
- 2008 adjusted earnings-per-share of $1.86 (12% increase)
- 2009 adjusted earnings-per-share of $1.99 (7% increase)
- 2010 adjusted earnings-per-share of $2.23 (12% increase)
Ecolab’s fundamental performance was remarkable, as the company compounded its adjusted earnings-per-share at double-digit rates during the recession. Its stock price did not perform quite as well, however, although it still compares nicely to other Dividend Aristocrats:
Source: YCharts
Ecolab’s stock price fell from $52.30 to $29.85 during the global financial crisis. This marks a decline of 45.2% and ranks in the 62nd percentile of the Dividend Aristocrats, which shows that Ecolab has an above-average recession resilience among this group of high-quality dividend stocks.
Return To The Table Of Contents
Consolidated Edison Inc. (ED) Recession Performance
Consolidated Edison is a large regulated utility with a market capitalization of $25 billion.
The company’s fundamental performance during the global financial crisis can be seen below:
- 2007 adjusted earnings-per-share of $3.48
- 2008 adjusted earnings-per-share of $3.36 (3% decline)
- 2009 adjusted earnings-per-share of $3.14 (7% decline)
- 2010 adjusted earnings-per-share of $3.47 (11% increase)
The company experienced a minor downturn in earnings during the recession but managed to regain its lost ground quickly once economic conditions normalized.
The company’s stock price also remained quite stable, as you can see in the following image.
Source: YCharts
Consolidated Edison’s stock price fell from $52.63 to $32.70 during the Great Recession of 2007-2009. This represents a stock price decline of 37.9% and falls in the 80th percentile of Dividend Aristocrats.
Like most utilities, Consolidated Edison is exceptionally recession resistant.
Return To The Table Of Contents
Emerson Electric Co. (EMR) Recession Performance
Emerson Electric is a global industrial manufacturer that operates in more than 150 countries.
The company’s bottom line performance during the Great Recession can be seen below:
- 2007 adjusted earnings-per-share of $2.66
- 2008 adjusted earnings-per-share of $3.11 (17% increase)
- 2009 adjusted earnings-per-share of $2.27 (27% decline)
- 2010 adjusted earnings-per-share of $2.60 (15% increase)
- 2011 adjusted earnings-per-share of $3.24 (25% increase, new post-recession high)
Emerson’s earnings experienced a 27% decline during this significant economic contraction. Emerson Electric’s stock price performance during the recession can be seen below:
Source: YCharts
Emerson Electric’s stock price declined from $58.32 to $24.87 during the global financial crisis, dropping 57.3% and ranking in the 42nd percentile of the Dividend Aristocrats. Among this group of dividend stocks, Emerson Electric is slightly below average in its ability to weather recessions (at least at the security level).
Return To The Table Of Contents
Federal Realty Investment Trust (FRT) Recession Performance
Federal Realty Investment Trust is a real estate investment trust (REIT) and the only REIT to be a Dividend Aristocrat.
The trust’s fundamental performance during the Great Recession can be seen below:
- 2007 FFO-per-share of $3.63
- 2008 FFO-per-share of $3.87 (6.6% increase)
- 2009 FFO-per-share of $3.87 (flat)
- 2010 FFO-per-share of $3.88 (0.3% increase)
- 2011 FFO-per-share of $4.00 (3% increase)
Federal Realty’s funds from operations (a REIT-specific financial metrics) were steady and rising during the Great Recession – a time period that was particularly hard for real estate companies.
Unfortunately, the company’s stock price performed far worse.
Source: YCharts
Federal Realty Investment Trust’s stock price dropped from $97.12 to $38.32 during the 2007-2009 recession. This represents a share price decline of 60.0% and ranks in the 30th percentile of the Dividend Aristocrats.
Return To The Table Of Contents
General Dynamics (GD) Recession Performance
General Dynamics is a military and defense contractor with a market capitalization of $63 billion.
The company’s adjusted earnings-per-share performance during the Great Recession can be seen below:
- 2007 adjusted earnings-per-share of $5.10
- 2008 adjusted earnings-per-share of $6.13 (20% increase)
- 2009 adjusted earnings-per-share of $6.20 (1.1% increase)
- 2010 adjusted earnings-per-share of $6.82 (10% increase)
General Dynamics’ adjusted earnings-per-share increased each and every year of the 2007-2009 financial crisis.
Depiste this robust fundamental performance, the company’s stock price actually performed poorly:
Source: YCharts
General Dynamics’ stock price fell from $94.6 to $36.31 during the 2007-2009 financial crisis, declining by 61.6% and ranking in the 26th percentile of dividend growth stocks.
Return To The Table Of Contents
Genuine Parts Co. (GPC) Recession Performance
Genuine Parts Company is an automotive parts supplier most well-known for its NAPA Auto Parts retail outlets.
The company’s earnings trend during the 2007-2009 financial crisis can be seen below:
- 2007 adjusted earnings-per-share of $2.98
- 2008 adjusted earnings-per-share of $2.92 (2.0% decline)
- 2009 adjusted earnings-per-share of $2.50 (14% decline)
- 2010 adjusted earnings-per-share of $3.00 (20% increase)
Genuine Parts Company experienced a 14% decline in adjusted earnings-per-share before rebounding to a new high in the following fiscal year. It appears the company has a moderate amount of recession-resistant, a hypothesis which is supported by its stock price performance:
Source: YCharts
During the 2007-2009 financial crisis, Genuine Parts Company’s stock fell from $51.43 to $25.06. This represents a stock price decline of 51.3% and ranks in the 54th percentile of the Dividend Aristocrats. Genuine Parts Company is a touch above average for recession resiliency within the Dividend Aristocrats.
Return To The Table Of Contents
W.W. Grainger Inc. (GWW) Recession Performance
W.W. Grainger is a business-to-business distributor of maintenance, repair, and operations (MRO) supplies.
Grainger’s earnings-per-share performance during the 2007-2009 recession is listed below:
- 2007 adjusted earnings-per-share of $4.94
- 2008 adjusted earnings-per-share of $6.09 (23% increase)
- 2009 adjusted earnings-per-share of $5.25 (14% decline)
- 2010 adjusted earnings-per-share of $6.81 (30% increase)
Grainger’s per-share earnings declined by 14% in the Great Recession but rebounded to a new high in the next year.
The company’s stock price performance is similarly strong:
Source: YCharts
W.W. Grainger’s stock price declined from $101.43 to $59.92 during the 2007-2009 financial crisis. Although this represents a decline of 40.9%, this still ranks in the 72nd percentile of the Dividend Aristocrats – nearly the fourth quartile! Accordingly, Grainger is one of the more defensive members of this exclusive list of dividend growth stocks.
Return To The Table Of Contents
Hormel Foods Corporation (HRL) Recession Performance
Hormel Foods Corporation is a manufacturer of branded foods products including SPAM, Jennie-O Turkey, and Muscle Milk.
The company’s adjusted earnings-per-share trend during the 2007-2009 recession can be seen below:
- 2007 adjusted earnings-per-share of $0.54
- 2008 adjusted earnings-per-share of $0.52 (3.7% decline)
- 2009 adjusted earnings-per-share of $0.63 (21% increase)
- 2010 adjusted earnings-per-share of $0.76 (21% increase)
Hormel experienced a very minor ~4% decline in earnings in 2008, which was followed up by two years of very strong 21% growth.
Unsurprisingly, the company’s stock also performed quite well:
Source: YCharts
Hormel Foods’ stock price dropped from $10.62 to $6.525 during the Great Recession. This marks a decline of 41.1% and ranks in the 70th percentile among the Dividend Aristocrats. Hormel Foods’ consumer staples business model allows it to perform reasonably well in all economic environments, including the turmoil that was broadly experienced during 2007-2009.
Return To The Table Of Contents
Illinois Tool Works (ITW) Recession Performance
Illinois Tool Works is a manufacturer of tools and other industrial supplies.
The company’s performance during the 2007-2009 financial crisis is shown below:
- 2007 earnings-per-share of $3.36
- 2008 earnings-per-share of $3.05 (9% decline)
- 2009 earnings-per-share of $1.93 (37% decline)
- 2010 earnings-per-share of $3.03 (57% increase)
Illinois Tool Works experienced a pretty significant decline in earnings during the financial crisis. Accordingly, the company’s stock price was indicative of this fundamental performance deterioration:
Source: YCharts
Illinois Tool Works’ stock price declined from a high of $60.00 to a low of $26.19 during the Great Recession for a peak-to-trough decline of 56.4%, ranking in the 46th percentile among the Dividend Aristocrats. The company is moderately recession-resistant is near the average for this exclusive group of high-quality dividend stocks.
Return To The Table Of Contents
Johnson & Johnson (JNJ) Recession Performance
Johnson & Johnson is a diversified healthcare conglomerate and one of the most stable businesses in the world.
With that in mind, it is unsurprising that the company’s Great Recession performance was very strong:
- 2007 adjusted earnings-per-share of $4.15
- 2008 adjusted earnings-per-share of $4.57 (10% increase)
- 2009 adjusted earnings-per-share of $4.63 (1% increase)
- 2010 adjusted earnings-per-share of $4.76 (3% increase)
Johnson & Johnson’s adjusted earnings-per-share increased each year of the financial crisis. In fact, the company is on a streak of consecutive years of constant-currency earnings growth that has spanned more than 3 decades.
With this track record, it is unsurprising that the company’s stock price demonstrated relatively low volatility during the recession:
Source: YCharts
Johnson & Johnson’s stock price declined from $72.22 to $46.60 during the Great Recession, which represents a peak-to-trough decline of 35.5% and ranks in the 84th percentile of the Dividend Aristocrats. Even among this group of high-quality dividend stocks, Johnson & Johnson is highly dependable during economic recessions.
Return To The Table Of Contents
Kimberly-Clark Corporation (KMB) Recession Performance
The Kimberly-Clark Corporation is a manufacturer, distributor, and marketer of paper towels, diapers, tissues, and other consumer goods.
The company’s earnings-per-share trend during the Great Recession can be seen below:
- 2007 adjusted earnings-per-share of $4.25
- 2008 adjusted earnings-per-share of $4.06 (4.5% decline)
- 2009 adjusted earnings-per-share of $4.52 (11% increase)
- 2010 adjusted earnings-per-share of $4.45 (1.5% decline)
Kimberly-Clark experienced two minor declines in earnings during the Great Recession but recovered quickly. The company is also well above-average in its stock price’s ability to hold up during recessions.
Source: YCharts
Kimberly-Clark’s stock price dropped from $68.99 to $41.61 during the 2007-2009 recession, which marks a decline of 39.6% and ranks in the 76th percentile of Dividend Aristocrats. This consumer staples business is better than three-quarters of the other Dividend Aristocrats in its ability to perform well during recessions.
Return To The Table Of Contents
The Coca-Cola Company (KO) Recession Performance
The Coca-Cola Company is the world’s largest beverage company. The company’s earnings trend during the 2007-2009 financial crisis can be seen below:
- 2007 adjusted earnings-per-share of $1.29
- 2008 adjusted earnings-per-share of $1.51 (17% increase)
- 2009 adjusted earnings-per-share of $1.47 (3% decline)
- 2010 adjusted earnings-per-share of $1.75 (19% increase)
Coca-Cola experienced a very minor ~3% decline in adjusted earnings during the recession. The performance of its stock price was also above average:
Source: YCharts
Coca-Cola’s stock price declined from $32.78 to $18.93 during the 2007-2009 financial crisis. This represents a peak-to-trough decline of 42.2%, ranking in the 66th percentile of the Dividend Aristocrats. Coca-Cola is more recession-resistant than about two-thirds of this high-quality investment universe.
Return To The Table Of Contents
Leggett & Platt (LEG) Recession Performance
Leggett & Platt is a diversified industrial manufacturer. The company’s fundamental performance during the recession can be seen below:
- 2006 adjusted earnings-per-share of $1.57
- 2007 adjusted earnings-per-share of $0.28 (82% decline)
- 2008 adjusted earnings-per-share of $0.73 (161% increase)
- 2009 adjusted earnings-per-share of $0.74 (1% increase)
- 2010 adjusted earnings-per-share of $1.15 (55% increase)
Leggett & Platt’s earnings dropped like a rock during the recession. The company’s stock also performed poorly.
Source: YCharts
Legget & Platt’s stock price declined from $24.62 to $10.21 during the 2007-2009 financial crisis, which represents a peak-to-trough decline of 58.5%. The company’s stock price performance ranks in the 34th percentile relative to the other Dividend Aristocrats.
Return To The Table Of Contents
Lowe’s Company Inc. (LOW) Recession Performance
Lowe’s is a large home improvement retailer. The company’s main competitor is Home Depot (HD).
Lowe’s earnings performance during the recession can be seen below:
- 2007 adjusted earnings-per-share of $1.86
- 2008 adjusted earnings-per-share of $1.49 (20% decline)
- 2009 adjusted earnings-per-share of $1.21 (19% decline)
- 2010 adjusted earnings-per-share of $1.44 (19% increase)
- 2011 adjusted earnings-per-share of $1.69 (17% increase)
Lowe’s earnings fell during the recession, and so did its stock price:

Source: YCharts
Lowe’s stock price declined from $34.93 to $13.39, which is a peak-to-trough decline of 61.7% that ranks in the 24th percentile among the Dividend Aristocrats. Lowe’s stock is in the bottom quarter of the Dividend Aristocrats when it comes to its recession-resiliency.
Return To The Table Of Contents
McDonald’s Corporation (MCD) Recession Performance
McDonald’s Corporation is the world’s largest fast-food retailer. The company’s low prices and brand recognition helped it to perform exceptionally well during the recession:
- 2007 adjusted earnings-per-share of $2.91
- 2008 adjusted earnings-per-share of $3.67 (26% increase)
- 2009 adjusted earnings-per-share of $3.98 (8% increase)
- 2010 adjusted earnings-per-share of $4.60 (16% increase)
McDonald’s managed to increase its adjusted earnings-per-share at a double-digit CAGR over the Great Recession. Moreover, the company’s stock price performance was nothing short of remarkable:
Source: YCharts
As you can see in the chart above, McDonald’s was one of the few stocks that did not experience a large decline from 2007 to 2009. The company’s stock price actually rose, which is a testament to the extreme durability of its business model.
Return To The Table Of Contents
Medtronic Inc. (MDT) Recession Performance
Medtronic is a medical equipment company with a market capitalization of $116 billion.
The company’s performance during the Great Recession (from an earnings perspective) can be seen below:
- 2007 adjusted earnings-per-share of $2.61
- 2008 adjusted earnings-per-share of $2.92 (12% increase)
- 2009 adjusted earnings-per-share of $3.22 (10% increase)
- 2010 adjusted earnings-per-share of $3.37 (5% increase)
While Medtronic’s earnings performed very well during the recession, the company’s stock price plummeted – which would have been a very compelling buying opportunity for the opportunistic investor.
Source: YCharts
More specifically, Medtronic’s stock price declined from $57.86 to $24.38 during the 2007-2009 financial crisis. This is a drop of 57.8% and ranks in the 38th percentile among Dividend Aristocrats. Despite being in the broadly durable healthcare sector, Medtronic’s recession resiliency is actually low among the Dividend Aristocrats.
Return To The Table Of Contents
McCormick & Company Inc. (MKC) Recession Performance
McCormick is the leader in the worldwide spices and seasoning industry.
The company’s earnings trend during the 2007-2009 Great Recession can be seen below:
- 2007 adjusted earnings-per-share of $1.92
- 2008 adjusted earnings-per-share of $2.14 (11% increase)
- 2009 adjusted earnings-per-share of $2.34 (9.3% increase)
- 2010 adjusted earnings-per-share of $2.65 (13% increase)
McCormick grew its earnings at a phenomenal rate during the Great Recession.
Still, the company’s stock price declined along with the rest of the stock market.
Source: YCharts
McCormick’s stock price fell from a high of $41.97 to a low of $28.53 during the 2007-2009 financial crisis. This represents a drop of just 32.0% and ranks in the 96th percentile among Dividend Aristocrats. Spices and other household products hold up well during tough economic times, which is reflected in McCormick’s stock price performance.
Return To The Table Of Contents
3M Company (MMM) Recession Performance
3M is a diversified industrial manufacturing company. The company’s earnings performance during the Great Recession can be seen below:
- 2007 adjusted earnings-per-share of $5.60
- 2008 adjusted earnings-per-share of $4.89 (13% decline)
- 2009 adjusted earnings-per-share of $4.52 (7.5% decline)
- 2010 adjusted earnings-per-share of $5.75 (27% increase)
3M experienced a moderate decline in earnings, which was matched by a moderate drop in its stock price:
Source: YCharts
3M’s stock price fell from $95.85 to $41.83 during the Great Recession, which represents a drop of 56.4% and ranks in the 44th percentile among Dividend Aristocrats. This shows that 3M is only moderately recession-resistant when compared to its peers.
Return To The Table Of Contents
Nucor Corporation (NUE) Recession Performance
Nucor is behemoth within the steel industry. Unfortunately, this means that its performance can sometimes be volatile depending on movements in the price of raw steel.
The company’s performance during the 2007-2009 financial crisis can be seen below:
- 2007 adjusted earnings-per-share: $4.98
- 2008 adjusted earnings-per-share: $6.01
- 2009 adjusted earnings-per-share: net loss of $0.94
- 2010 adjusted earnings-per-share: $0.42
- 2011 adjusted earnings-per-share: $2.45
Nucor lost all of its profitability during the recession. The company’s stock price reacted accordingly.
Source: YCharts
Nucor’s stock price fell from $82.07 to $25.52 during the Great Recession, a drop of 68.9%. This falls in just the 8th percentile among Dividend Aristocrats. Nucor is one of the worst Dividend Aristocrats to hold at the beginning of a bear market.
Return To The Table Of Contents
PepsiCo Inc. (PEP) Recession Performance
PepsiCo is a beverage and snack company that is famous for its namesake Pepsi soda.
The company’s earnings trend during the Great Recession can be seen below:
- 2007 adjusted earnings-per-share of $3.34
- 2008 adjusted earnings-per-share of $3.21 (3.9% decline)
- 2009 adjusted earnings-per-share of $3.77 (17% increase)
- 2010 adjusted earnings-per-share of $3.91 (3.7% increase)
Pepsi’s earnings fared quite well during the recession, but its stock price fell nonetheless.
Source: YCharts
Pepsi’s stock price dropped from $79.57 to $45.81 during the Great Recession, a decline of 42.4%. The company’s performance during this bear market ranked in the 64th percentile, showing the resiliency of its diversified consumer staples business model.
Return To The Table Of Contents
Procter & Gamble Company (PG) Recession Performance
Procter & Gamble is a diversified consumer goods company that owns a huge number of consumer products. The company’s earnings trend during the Great Recession is listed below:
- 2007 adjusted earnings-per-share of $3.04
- 2008 adjusted earnings-per-share of $3.64 (20% increase)
- 2009 adjusted earnings-per-share of $3.58 (1.6% decline)
- 2010 adjusted earnings-per-share of $3.53 (1.4% decline)
Procter & Gamble’s earnings experienced only minor declines during the recession. The performance of the company’s stock price was also superior to many other marketable securities:
Source: YCharts
Procter & Gamble’s stock price dropped from $74.67 to $44.18 during the 2007-2009 recession, declining by 40.8% and ranking in the 74th percentile among Dividend Aristocrats. The data shows that this company is one of the best dividend stocks to own during periods of economic turmoil.
Return To The Table Of Contents
Pentair PLC (PNR) Recession Performance
Pentair is a water and electricity company with a market capitalization of $13 billion. The company’s earnings performance during the Great Recession can be seen below:
- 2007 adjusted earnings-per-share of $2.08
- 2008 adjusted earnings-per-share of $2.20 (5.8% increase)
- 2009 adjusted earnings-per-share of $1.47 (33% decline)
- 2010 adjusted earnings-per-share of $2.00 (36% increase)
Pentair experienced a noticeable decline in earnings during the recession and so did its stock price. Still, the company’s stock price performance was roughly average when compared to the other Dividend Aristocrats.
Source: YCharts
Pentair’s stock price declined from a high of $39.47 to a low of $17.60 during the 2007-2009 Great Recession, representing a peak-to-trough decline of 55.4% and ranking in the 48th percentile among Dividend Aristocrats. Pentair’s recession resiliency is essentially “middle of the pack” when compared to these other high-quality dividend stocks.
Return To The Table Of Contents
PPG Industries Inc. (PPG) Recession Performance
PPG Industries is a diversified paints and coatings company with a market capitalization of $30 billion.
The company’s earnings trend during the 2007-2009 financial crisis can be seen below:
- 2007 adjusted earnings-per-share: $2.52
- 2008 adjusted earnings-per-share: $1.63
- 2009 adjusted earnings-per-share: $1.02
- 2010 adjusted earnings-per-share: $2.32
- 2011 adjusted earnings-per-share: $3.44
As you can see, the company’s earnings declined noticeably during the Great Recession. So did its stock price:
Source: YCharts
PPG Industries’ stock price fell from $41.10 to $14.24 during the global financial crisis for a peak-to-trough decline of 65.3%. The company’s recession resiliency ranks in the 16th percentile among Dividend Aristocrats, implying there are better alternatives for investors looking for downside protection.
Interestingly, the recession performance of PPG Industries is far worse than that of Sherwin-Williams, its main competitor and a fellow Dividend Aristocrat. You can see Sherwin-Williams’ recession performance analyzed in the next section.
Return To The Table Of Contents
Sherwin-Williams Company (SHW) Recession Performance
Sherwin-Williams is a paint and coatings company with a market capitalization of $40 billion.
The company’s performance during the 2007-2009 financial crisis can be seen below:
- 2007 adjusted earnings-per-share: $4.70
- 2008 adjusted earnings-per-share: $4.00
- 2009 adjusted earnings-per-share: $3.78
- 2010 adjusted earnings-per-share: $4.21
- 2011 adjusted earnings-per-share: $4.14
- 2012 adjusted earnings-per-share: $6.02
Sherwin-Williams’ earnings were certainly impacted by the Great Recession, and its stock price reacted accordingly.
Source: YCharts
Sherwin-Williams’ stock price declined from a high of $72.99 to a low of $42.98 during the financial crisis. This represents a peak-to-trough decline of 41.1% which ranks in the 68th percentile among Dividend Aristocrats.
Interestingly, Sherwin-Williams’ recession performance is far superior to that of PPG Industries, its main competitor and a fellow Dividend Aristocrat. You can see PPG Industries’ recession performance analyzed earlier in this article, or navigate to it directly by clicking here.
Return To The Table Of Contents
S&P Global (SPGI) Recession Performance
S&P Global is a financial research and analytics company with a market capitalization of $45 billion.
- 2007 adjusted earnings-per-share of $2.94
- 2008 adjusted earnings-per-share of $2.51 (15% decline)
- 2009 adjusted earnings-per-share of $2.33 (7% decline)
- 2010 adjusted earnings-per-share of $2.65 (14% increase)
The company’s earnings experienced only a minor decline, but its stock price absolutely plummeted – which created a compelling buying opportunity for investors that spotted this trend.
Source: YCharts
More specifically, S&P Global’s stock price declined from a high of $71.96 to a low of $17.39 during the 2007-2009 financial crisis, representing a peak-to-trough decline of 75.8% and ranking in the 4th percentile among Dividend Aristocrats.
Based on its historical stock price movements, S&P Global (along with Nucor and T. Rowe Price) is among the worst Dividend Aristocrats to own if downside protection is one of your primary concerns.
Return To The Table Of Contents
Stanley Black & Decker Inc. (SWK) Recession Performance
Stanley Black & Decker is a global tool manufacturer with a market capitalization of $27 billion. The company’s fundamental performance during the Great Recession can be seen below:
- 2007 adjusted earnings-per-share of $4.00
- 2008 adjusted earnings-per-share of $3.41 (15% decline)
- 2009 adjusted earnings-per-share of $2.72 (20% decline)
- 2010 adjusted earnings-per-share of $3.96 (46% increase)
Stanley Black & Decker’s earnings declined noticeably during the recession. The markets reacted by allowing its stock price to fall even more than its earnings:
Source: YCharts
Stanley Black & Decker’s stock price declined from $63.92 to $22.75 during the Great Recession. This represents a peak-to-trough decline of 64.4% and ranks in the 18th percentile among Dividend Aristocrats. Stanley Black & Decker is not highly recession-resistant, likely because people will slow their purchasing of tools (instead of making do with older ones) when the economy contracts and disposable income becomes constrained.
Return To The Table Of Contents
Sysco Corporation (SYY) Recession Performance
Sysco Corporation is a food distributor with a market capitalization of $32 billion.
The company’s fundamental performance during the Great Recession is listed below:
- 2007 adjusted earnings-per-share of $1.60
- 2008 adjusted earnings-per-share of $1.81 (13% increase)
- 2009 adjusted earnings-per-share of $1.77 (2% decline)
- 2010 adjusted earnings-per-share of $1.99 (12% increase)
Sysco’s earnings experienced a very minor 2% decrease during the recession. It’s stock price performance was also above average, even when compared to the other members of the Dividend Aristocrats list.
Source: YCharts
Sysco’s stock price declined from $36.72 to $19.45 during the Great Recession, a decline of 47.0% that ranks in the 58th percentile among Dividend Aristocrats. Sysco’s stock performed reasonably well during the recession, likely because people continue to need food regardless of the behavior of the overall economy.
Return To The Table Of Contents
AT&T Inc. (T) Recession Performance
AT&T is the largest telecommunications company in the United States based on its market capitalization of $227 billion.
The company’s earnings trend during the 2007-2009 financial crisis is shown below:
- 2007 adjusted earnings-per-share of $2.76
- 2008 adjusted earnings-per-share of $2.16 (22% decline)
- 2009 adjusted earnings-per-share of $2.12 (1.8% decline)
- 2010 adjusted earnings-per-share of $2.29 (8% increase)
AT&T’s earnings declined by less than 25% during the recession. It’s stock price performance is shown in the following image.
Source: YCharts
AT&T’s stock price declined from $42.83 to $21.72 during the Great Recession. This is a peak-to-trough decline of 49.2% that ranks in the 56th percentile among Dividend Aristocrats. AT&T’s utility-like telecommunications business model helps it to perform reasonably well in all economic environments.
Return To The Table Of Contents
Target Corporation (TGT) Recession Performance
Target Corporation is a discount retailer whose main competitor is fellow Dividend Aristocrat Wal-Mart.
The company’s fundamental financial performance during the global financial crisis is listed below:
- 2007 adjusted earnings-per-share of $3.33
- 2008 adjusted earnings-per-share of $2.86 (14% decline)
- 2009 adjusted earnings-per-share of $3.30 (15% increase)
- 2010 adjusted earnings-per-share of $3.88 (17% increase)
- 2011 adjusted earnings-per-share of $4.28 (10% increase)
While Target’s earnings performed reasonably well during the recession, the company’s stock price actually performed quite poorly (as depicted in the following image):
Source: YCharts
Target’s stock price declined from $70.14 to $25.37 during the Great Recession. This is a decline of 63.8% that ranks in the 20th percentile among Dividend Aristocrats.
Although Target is a discount retailer, the company’s prices are slightly higher than Wal-Mart’s which allows the larger retailer (Wal-Mart) to have superior recession performance. For context, Wal-Mart’s recession performance (as measured by stock price) ranks in the 92nd percentile among Dividend Aristocrats. Skip to an analysis of Wal-Mart’s recession performance by clicking here.
Return To The Table Of Contents
T. Rowe Price Group Inc. (TROW) Recession Performance
T. Rowe Price Group is an asset management firm with a market capitalization of $28 billion.
The company’s earnings trend during the 2007-2009 financial crisis is shown below:
- 2007 adjusted earnings-per-share of $2.40
- 2008 adjusted earnings-per-share of $1.82 (24% decline)
- 2009 adjusted earnings-per-share of $1.65 (9% decline)
- 2010 adjusted earnings-per-share of $2.53 (53% increase)
- 2011 adjusted earnings-per-share of $2.92 (15% increase)
The company’s stock price declined precipitoursly when the financial crisis hit as the markets reacted to falling equity prices and the subsequent effect this had on T Rowe Price’s revenue (which is primarily composed of asset-based management fees). The company’s stock price performance during this period is shown below.
Source: YCharts
T. Rowe Price’s stock price declined from $65.01 to $21.01 during the Great Recession for a peak-to-trough decline of 67.6%. This ranks in the 12th percentile among the Dividend Aristocrats. T. Rowe Price is one of the worst Dividend Aristocrats to own if principal preservation and downside protection is your primary investment objective.
Return To The Table Of Contents
V.F. Corporation (VFC) Recession Performance
V.F. Corporation is branded apparel manufacturer known for the Vans and Timberwolf brands.
The company’s earnings performance during the 2007-2009 financial crisis is shown below:
- 2007 adjusted earnings-per-share of $1.35
- 2008 adjusted earnings-per-share of $1.39 (3% increase)
- 2009 adjusted earnings-per-share of $1.29 (7% decline)
- 2010 adjusted earnings-per-share of $1.61 (25% increase)
V.F. Corporation experienced a minor 7% decline in adjusted earnings-per-share during the financial crisis, but its stock price performance was far worse.
Source: YCharts
V.F. Corporation’s stock price declined from $23.91 to $9.97 during the Great Recession, which represents a stock price decline of 58.3% and ranks in the 36th percentile of the Dividend Aristocrats. The company’s stock price performance during the recession was worse than average, primarily due to its branded consumer cyclical business model.
Return To The Table Of Contents
Walgreens Boots Alliance (WBA) Recession Performance
Walgreens Boots Alliance is an owner and operator of branded pharmaceutical retail chains.
The company’s earnings trend during the 2007-2009 financial crisis is shown below:
- 2007 adjusted earnings-per-share of $2.03
- 2008 adjusted earnings-per-share of $2.17 (6.9% increase)
- 2009 adjusted earnings-per-share of $2.02 (7.2% decline)
- 2010 adjusted earnings-per-share of $2.16 (6.9% increase)
Walgreens reported a very minor 7.2% decline in adjusted earnings-per-share during fiscal 2009, but rebounded to within $0.01 of its previous high in the next fiscal year.
The company’s stock price performance – which is not quite as robust as its earnings performance – is depicted in the following diagram:
Source: YCharts
Walgreens’ stock price declined from $47.93 to $21.40 during the financial crisis, for a peak-to-trough decline of 55.3% that ranks in the 50th percentile of the Dividend Aristocrats. The company is thoroughly middle-of-the-pack in terms of recession-resiliency when compared to other high-quality dividend stocks.
Return To The Table Of Contents
Wal-Mart Stores Inc. (WMT) Recession Performance
Wal-Mart Stores is the world’s largest retailer with a market capitalization of $299 billion. The company’s fundamental financial performance during the 2007-2009 financial crisis is shown below:
- 2007 adjusted earnings-per-share of $3.16
- 2008 adjusted earnings-per-share of $3.42 (8.2% increase)
- 2009 adjusted earnings-per-share of $3.66 (7% increase)
- 2010 adjusted earnings-per-share of $4.07 (11% increase)
Wal-Mart’s earnings increased each and every year during the Great Recession, primarily due to the retailer’s “everyday low prices.” This resulted in a remarkable level of stock price stability during the recession, which is visualized below.
Source: YCharts
Here’s what the numbers look like: Wal-Mart’s stock price declined from $63.17 to $42.27 during the global financial crisis, a peak-to-trough decline of 33.1% and within the 92nd percentile of Dividend Aristocrats.
The company’s stock price performance during the recession was exceptional, primarily due to its brand recognition and low prices. Most notably, Wal-Mart’s recession performance is far superior to its main competitor Target, whose recession performance can be seen by clicking here.
Return To The Table Of Contents
Exxon Mobil Corporation (XOM) Recession Performance
Exxon Mobil is the world’s largest energy company based on its market capitalization of $371 billion. The company’s earnings-per-share trend during the 2007-2009 financial crisis can be seen below:
- 2007 adjusted earnings-per-share of $7.26
- 2008 adjusted earnings-per-share of $8.66
- 2009 adjusted earnings-per-share of $3.98
- 2010 adjusted earnings-per-share of $6.22
Exxon’s earnings were volatile during the recession, but the company remained profitable and continued to pay rising dividends each year. Exxon’s stock was also surprisingly stable, an observation which is visualized in the following image:
Source: YCharts
Exxon Mobil’s stock price declined from $95.05 to $62.22 during the 2007-2009 financial crisis, a peak-to-trough drop of 34.5% that ranks in the 90th percentile of the Dividend Aristocrats. Despite being within the volatile energy sector, Exxon’s stock price remained relatively stable during this period of economic turmoil.
Return To The Table Of Contents
Final Thoughts & Comprehensive Ranking
Every Dividend Aristocrat is ranked by its peak-to-trough decline during the Great Recession in the following list. Stocks are ranked from worst-to-best. Aflac had the worst drawdown during the Great Recession as an example.
- Aflac (AFL): 83.2%
- S&P Global (SPGI): 75.8%
- Franklin Resources (BEN): 73.1%
- Nucor (NUE): 68.9%
- Archer-Daniels-Midland (ADM): 68.3%
- T. Rowe Price Group (TROW): 67.7%
- Cardinal Health (CAH): 66.8%
- PPG Industries (PPG): 65.4%
- Stanley Black & Decker (SWK): 64.4%
- Target Corporation (TGT): 63.8%
- Cincinnati Financial (CINF): 62.0%
- Lowe’s Company (LOW): 61.7%
- General Dynamics (GD): 61.6%
- Air Products & Chemicals (APD): 60.7%
- Federal Realty Investment Trust (FRT): 60.0%
- Dover Corporation (DOV): 59.5%
- Leggett & Platt (LEG): 58.5%
- V.F. Corporation (VFC): 58.3%
- Medtronic (MDT): 57.9%
- Cintas (CTAS): 57.6%
- Emerson Electric (EMR): 57.4%
- 3M Company (MMM): 56.4%
- Illinois Tool Works (ITW): 56.4%
- Pentair (PNR): 55.4%
- Walgreens Boots Alliance (WBA): 55.4%
- Brown-Forman (BF.B): 52.8%
- Genuine Parts Company (GPC): 51.3%
- AT&T (T): 49.3%
- Sysco Corporation (SYY): 47.0%
- Chevron Corporation (CVX): 45.2%
- Ecolab (ECL): 42.9%
- PepsiCo (PEP): 42.4%
- The Coca-Cola Company (KO): 42.3%
- Sherwin-Williams (SHW): 41.1%
- Hormel Foods Corporation (HRL): 41.1%
- W.W. Grainger (GWW): 40.9%
- Procter & Gamble (PG): 40.8%
- Kimberly-Clark Corporation (KMB): 39.7%
- Automatic Data Processing (ADP): 38.1%
- Consolidated Edison (ED): 37.9%
- Colgate-Palmolive (CL): 36.6%
- Johnson & Johnson (JNJ): 35.5%
- McDonald’s Corporation (MCD): 34.9% (Note: this number does not accurately portray McDonald’s recession resilience, as the company’s stock price actually rose steadily during the recession).
- Becton-Dickinson (BDX): 34.7%
- Exxon Mobil (XOM): 34.5%
- Wal-Mart Stores (WMT): 33.1%
- Clorox (CLX): 33.0%
- McKesson (MKC): 32.0%
- Abbott Laboratories (ABT): 31.4%
The Dividend Aristocrats are a great place to find high-quality dividend growth investment opportunities. As this article discussed in detail, many – even most -of the Dividend Aristocrats perform very well during periods of economic turmoil.
With this in mind, it’s important to remember that the Dividend Aristocrats are not the only place where attractive investments can be found. If you’re interested in other dividend growth investment universes, the following databases will be useful:
- The Dividend Achievers: dividend stocks with 10+ years of consecutive dividend increases
- The Dividend Kings: an even more exclusive group of dividend stocks with 50+ years of consecutive dividend increases
- The Complete List Of Monthly Dividend Stocks
- The Complete List Of Stocks With 5%+ Dividend Stocks
- The Blue Chip Stocks List: stocks with 3%+ dividend yields and 100+ year operating histories
Alternatively, you may want to sift through lists of dividend-paying stocks from particular sectors of the stock market. If that is indeed the case, the following databases will be useful:
- The Complete List Of All Dividend-Paying Telecommunications Stocks
- The Complete List Of All Dividend-Paying Consumer Staples Stocks
- The Complete List Of All Dividend-Paying Consumer Cyclical Stocks
- The Complete List Of All Dividend-Paying Industrial Stocks
- The Complete List Of All Dividend-Paying Materials Stocks
- The Complete List Of All Dividend-Paying Technology Stocks
- The Complete List Of All Dividend-Paying Healthcare Stocks
- The Complete List Of All Dividend-Paying Energy Stocks
- The Complete List Of All Dividend-Paying Financial Stocks
- The Complete List Of All Dividend-Paying Utility Stocks
One last resource to find investment opportunities is by looking inside of the major market indices. You can access free databases of some of the world’s most important stock market indices at the following links:
- The Complete List Of All S&P 500 Stocks: the 500 largest public companies in the United States
- The Complete List Of Russell 2000 Stocks: small-capitalization securities
- The Complete List Of Dow Jones Industrial Average Stocks
- The Complete List Of Nikkei 225 Stocks: the largest index of Japanese equities
- The Complete List Of FTSE 100 Stocks: an important index of European stocks
Thanks for reading this article. Please send any feedback, corrections, or questions to [email protected].
Article by Nick McCullum, Sure Dividend


