As another year came to a close, 2017 marked the 9th consecutive year of gains for the S&P 500 in a bull market that began in 2009. It also ended as the only calendar year in the history of the S&P 500 to never experience a down month. In fact, over the last 22 months (since March 2016) the S&P 500 has only been down 1 month. In case investors are getting lulled into a false sense of normalcy, it is important to remember that over the last 40 years the S&P 500 is normally down about 35% of the time, any given month1.

Corporate Tax Cuts, Just Because.
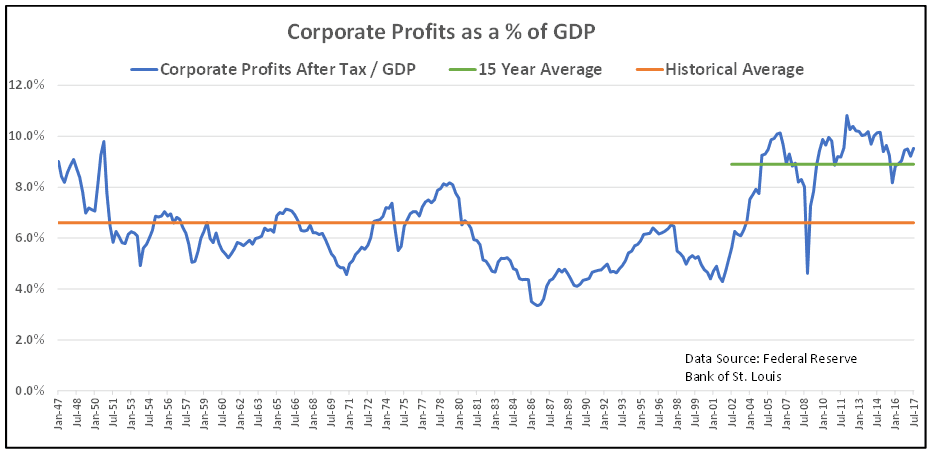
As Congress raced to get tax cuts passed before the new year, many market observers continued to question whether now was really the time for tax cuts at all. Usually tax cuts are used as a tool to stimulate the economy coming out of a recession, not going into the 9th year of an economic expansion. Furthermore, as the chart below shows, corporate profits as a percentage of the economy (measured by GDP) are at historically high levels.
While the President and those in Congress have argued that these corporate tax cuts will flow into higher wages for the average person, history would say otherwise. Companies do not increase wages simply because they become more profitable, companies increase wages as a necessity to attract workers in a competitive labor market.
As the following chart will show, despite corporate after-tax profits doubling as a percentage of GDP since 2000, median inflation-adjusted household income was essentially flat (and was actually negative for the majority of the period).

With the current unemployment rate at 4.1%, the elements are already in place for increasing wages, debt financed tax cuts are unnecessary and could leave us without that option should the economy take a turn for the worse.
Furthermore, while a case could be made that lower corporate tax rates would incentivize corporations to base more of their operations in the United States, most of that benefit will likely be negated due to the specifics included in the territorial tax system that was put in place by the new tax law.
The specifics will likely bore you and I may have already lost your attention anyway, just know that under the territorial tax system the US imposes zero taxes on profits earned overseas, except for a 10% aggregate minimum tax (meaning foreign countries must be taxing them at least 10% in aggregate). However, due to the specifics of the plan, the more factories and equipment a company has overseas which qualify as “routine” profits...the more tax savings they can gain by gaming the system. Therefore, in many situations US corporations would be incentivized to base those operations outside the country.
While nearly everyone would agree there were too many loopholes in our previous corporate tax structure, the new structure appears to have simply created more.
Economic Cycles and Market Returns
Economic cycles and investor emotions often follow very similar paths. When the economy “feels good”, investors usually feel more at ease and are more willing to take risk. When the economy “feels bad”, investor emotions follow suit and they are more skeptical of taking on risk. The unfortunate truth about this investor reality is that it leads investors to make the worst decisions at the worst times.
For example, take the unemployment rate. A low unemployment rate is a great sign of a strong economy. However, history has shown that investors actually experience better future returns when starting from a high unemployment rate and lower future returns when the unemployment rate is low (because an optimistic viewpoint is already priced into the market).
The following chart shows average 5-year returns based on the unemployment rate at the beginning of every period.
As the chart shows, the average 5-year return investors experience when the starting unemployment rate is above 9% is more than double the return investors have experienced when it is below 5%.
The problem with investing based on how the economy “feels” is that it ignores the most important aspect of investing which is “valuation”. One of many valuation measures for the market is the CAPE ratio, which stands for Cyclically Adjusted Price-to-Earnings ratio. The higher the ratio, the more investors are paying for the same level of earnings (or in other words, the more expensive markets are). When the unemployment rate has been under 6%, investors have been willing to pay nearly 40% more for stocks on average vs when the unemployment rate is over 6%.
What does this mean for today? It is just a reminder that, for multiple reasons, investors should lower return expectations for the market. We currently not only sit at a low unemployment rate of 4.1% (by itself not a bad thing) but we also have an expensive market with the S&P 500 at a CAPE ratio of 33.
As we saw previously, returns have historically been lower when starting from a low unemployment rate, but it has been particularly low when combined with an expensive market.
Keeping Your Eyes On The Prize
With so many distractions in today’s fast-paced world, it is easy to get caught up in details and lose sight of the bigger picture, which are your financial goals. I’ll admit this letter probably didn’t help the cause but maybe it’s partly our intent to let you know that we are paying attention to these things, so you don’t have to.
Ultimately, as your advisory team, our objective is being available and proactive in your retirement planning as you move through the “seasons of retirement”. Our mission is to empower you to enjoy retirement & pursue the passions, interests, activities and relationships that are most important to you without worrying about your finances or the economy.
We can’t wait to talk to you all in the new year and look forward to a great 2018! As always, don’t hesitate to contact us should you have any questions or concerns.
Paul R. Ried, MBA, CFP®
President / CEO
Registered Principal*
Timothy R. Kimmel, CFP®
Personal Financial Advisor*
Registered Representative*
Adam Jordan, CIMA®, AAMS®
Director of Investment Research & Management
Registered Principal*
Kelly Kolstad, JD, CFP®
Personal Financial Advisor*
Registered Representative*
Prepared By:
Adam Jordan, CIMA®, AAMS®
Director of Investment Research and Management
Registered Principal*
1 - Morningstar Direct – S&P 500 TR
2 - https://www.bloomberg.com/view/articles/2017-05-12/what-the-jobless-data-say-about-stock-performance
3 - http://www.econ.yale.edu/~shiller/data.htm
Opinions expressed are not intended as investment advice or to predict future performance. All information is believed to be from reliable sources; however, we make no representation as to its completeness or accuracy. All economic and performance information is historical and not indicative of future results. The S&P 500 is an unmanaged group of securities considered to be representative of the stock market in general. You cannot invest directly in an index. Past performance does not guarantee future results.


