
This firm has consistently grown profits, improved margins, and successfully integrated a recent acquisition. Despite the success, the stock’s valuation does not reflect the potential for future profit growth and now holds significant upside potential. These attributes, along with a strong competitive position, make Hooker Furniture (HOFT: $51/share) one of December’s Most Attractive Stocks and this week’s Long Idea.

HOFT’s Impressive Profit Growth
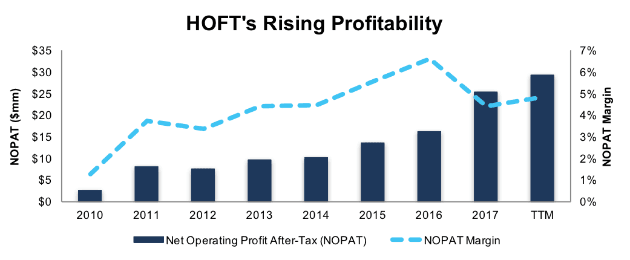
HOFT has grown revenue 14% compounded annually since 2010. Over the same period, after-tax profit (NOPAT) has increased 33% compounded annually, per Figure 1. Improved profit growth has been fueled by rising NOPAT margins, which have improved from 1% in 2010 to 5% TTM. Longer term, HOFT has grown NOPAT by 4% compounded annually over the past decade.
Figure 1: HOFT Profit Growth Since 2010
Sources: New Constructs, LLC and company filings
Not only has HOFT managed to grow NOPAT consistently, it has also done well in managing the capital put into the business. Average invested capital turns have increased from 1.5 in 2010 to 2.2 TTM. Since 2010, HOFT has improved its return on invested capital (ROIC) from 2% to 11% TTM, per Figure 2. This improved profitability is especially impressive given HOFT’s $106 million (37% of invested capital) acquisition of Home Meridian in early 2016.
Figure 2: HOFT’s ROIC Improvement Since 2010

Sources: New Constructs, LLC and company filings
Improving ROIC Correlated with Creating Shareholder Value
Numerous case studies show that changes in stock prices are strongly correlated with ROIC. As such, getting ROIC right is an important part of the investment decision making process. A recent white paper published by accounting firm, Ernst & Young, shows material superiority of our forensic accounting research and measure of ROIC versus the largest research providers.
Per Figure 3, ROIC explains 90% of the difference in valuation for the 14 peers named in Hooker Furniture’s proxy statement. Despite HOFT’s 11% ROIC, which is slightly above the 10% average of the peer group, the firm’s stock trades at a discount to peers as shown by its position below the trend line in Figure 3. If the stock were to trade at parity with its peers, it would be $64/share – 25% above the current stock price. Given the firm’s rising capital efficiency (ROIC and invested capital turns) and profits, one would think the stock would garner a premium valuation.
Figure 3: ROIC Explains 90% Of Valuation for HOFT Peers
Sources: New Constructs, LLC and company filings
HOFT’s Margins & Efficiency Provide Competitive Advantage
Hooker Furniture is a manufacturer of wooden and metal (casegoods), leather, and fabric furniture for residential and commercial use. Its brands include Bradington-Young, Sam Moore Furniture, Hooker Upholstery, Pulaski, Samuel Lawrence, and Right 2 Home. Its position in the furniture market pits it against competitors such as Ethan Allen Interiors (ETH), Bassett Furniture (BSET), RH (RH), formerly known as Restoration Hardware, Haverty Furniture (HVT), and La-Z-Boy (LZB), among others.
Per Figure 4, HOFT’s ROIC ranks at the top of its main competition while its NOPAT margin is near the top of the group. As a consumer goods merchant, selling larger ticket items, pricing is key to HOFT’s success. As such, having margins that either match or beat competition provides a competitive advantage. The firm is able to offer better terms to furniture retailers (such as Costco, which accounted for 10% of sales in fiscal 2017) while still maintaining profitability.
Figure 4: HOFT’s NOPAT Margins Near Top of Peer Group
Sources: New Constructs, LLC and company filings.
In addition to margins, HOFT exceeds all competition when it comes to balance sheet efficiency, per Figure 5. Average invested capital turns measure a company’s revenue relative to its average invested capital. HOFT’s position within its peer group means it generates the most revenue per dollar of capital invested into its business. More importantly, as seen in Figure 4 above, HOFT’s top ROIC means it also generates the most NOPAT per dollar of capital invested into the business.
Figure 5: HOFT’s Balance Sheet Efficiency Leads Peers
Sources: New Constructs, LLC and company filings.
Bear Case: Ignores Strength in Business and Economy
As a consumer goods firm, Hooker’s success is largely tied to the strength of the economy (domestic and abroad). A strong economy, and strong consumer, means customers are willing to spend on furniture items beyond just necessities or even remodel rooms with entirely new collections. Bears of HOFT are betting not only on a weak economy moving forward, but are ignoring the signs of strength within HOFT’s business that could push shares higher.
Management noted in its fiscal 2Q18 conference call that it was optimistic about the fall season. This optimism stems from economic indicators which point to improvements in consumers’ ability to spend. To begin, the three-month moving average of wage growth has improved to 3.4% in October 2017, up from 2.2% in October 2013. Consumer confidence increased for a fifth consecutive month in November and remains at its highest level since November 2000. Lastly, the unemployment rate was 4.1% in October 2017, which ranks as the lowest rate since before the 2008/2009 recession.
The strong economy has tangible results on the industry, which can be seen not only at Hooker, but other furniture providers/retailers. After Black Friday/Cyber Monday, Wayfair (W), an online furniture retailer, reported direct sales increased 53% year-over-year during the holiday. The company noted its sales equated to a customer purchasing a sofa every 13 seconds, a mattress every eight seconds, and a rug every two seconds. Such impressive sales bode well for firms such as Hooker, which sells its furniture through Wayfair’s website.
More importantly, Hooker is looking to maximize its recent acquisition of Home Meridian, its strongest segment in fiscal 2Q18. The company is focusing on emerging channels (with e-commerce being the fastest growing channel) to grow sales while maintaining profitability within the segment. At the same time, HOFT reported that its largest segment, casegoods, returned to growth after falling in fiscal 2017. Sales were up 4% in the recent quarter and 2% for the first half of the year.
Beyond existing markets, HOFT is not resting on its past success. The company recently announced the acquisition of Shenandoah Furniture, which will expand its offerings in an underrepresented market (lifestyle specialty furniture and upper medium price points). After the successful integration of Home Meridian, Shenandoah could provide the next profit growth spurt for Hooker.
Apart from the positive developments noted, the bear case is further weakened by analyzing HOFT’s valuation. The stock’s current valuation not only ignores the company’s years of profit growth but also significantly undervalues its business. More details are below.
HOFT Could be Excellent Long-Term Hold
HOFT has been an excellent stock to hold in a portfolio, as it has increased upwards of 240% over the past five years. Over the same time, the S&P is up 86%. More recently, HOFT is up nearly 40% year-to-date, which outpaces the 16% increase in the S&P. With a P/E ratio of 20, compared to the 14.5 average of Home Furnishing peers under coverage, one might think HOFT is overvalued, However, when we analyze the expectations baked into the stock price, we find the opposite, and that HOFT still holds significant upside potential.
At its current price of $51/share, HOFT has a price-to-economic book value (PEBV) ratio of 1.0. This ratio means the market expects no meaningful growth in HOFT’s NOPAT over the remaining life of the firm. This expectation seems overly pessimistic for a firm that has grown NOPAT by 4% compounded annually over the past decade and 33% compounded annually since 2010.
If HOFT can simply maintain 2017 NOPAT margins of 4% (below TTM margins of 5%) and grow NOPAT by just 7% compounded annually for the next decade, the stock is worth $69/share today – a 35% upside. Add in the potential 1% yield detailed below, and it’s clear why HOFT could be a great portfolio addition.
Repurchase and Dividend Yield Remains Low
HOFT has $11.8 million remaining under a repurchase authorization that began in 2013. The authorization has no expiration or requirement to repurchase shares in any given year. HOFT did not repurchase any shares from fiscal 2014 through fiscal 2017. In fiscal 2013, HOFT repurchased $671 thousand worth of shares. If the firm were to make a similar repurchase, it would equate to just 0.1% of the current market cap. When combined with the 0.9% dividend yield, the total yield to shareholders would be 1.0%.
Continued Earnings Beats Could Boost Shares
HOFT has seen large price movements based on its earnings beating or missing expectations. Over the past three quarters shares have moved upwards of 25%, as detailed below.
- Fiscal 4Q16 – top and bottom line beat – shares jumped 27% the following day
- Fiscal 1Q17 – top and bottom line miss – shares fell 11% the following day
- Fiscal 2Q17 – top and bottom line beat – shares jumped 14% the following two days
Going forward, another quarterly beat could see a similar surge in share price. If the impressive sales at Wayfair over Black Friday/Cyber Monday are anywhere near representative of consumer purchasing habits over the holiday, an earnings beat could be just around the corner. If not, HOFT has still proven its ability to grow profits, beating earnings expectations in nine of the last 12 quarters, and looks poised to continue doing so.
In any case, this stock offers low valuation risk, a small yield, and significant upside potential.
Executive Compensation Plan Could be Improved but Raises No Alarms
HOFT’s executive compensation plan, which includes base salary, annual incentives, and long-term incentives, is based on reaching target goals in operating income, net income, and earnings per share, both in absolute terms and relative to peers. While not as troubling as non-GAAP metrics, items such as net income and EPS still have significant leeway in their calculation, which opens the door for “earnings management.”
We would prefer to see executive compensation tied directly to value creation, and specifically tied to ROIC, since there is a strong correlation between improving ROIC and increasing shareholder value. However, HOFT’s current exec comp plan has not led to executives getting paid while destroying shareholder value. In fact, quite the opposite is true for HOFT. Economic earnings, the true cash flows of the business, have grown 12% compounded annually over the past decade and an impressive 56% compounded annually over the past five years.
Insider Trading and Short Interest Trends
Insider activity has been minimal over the past twelve months with 16 thousand shares purchased and 68 thousand shares sold for a net effect of 52 thousand shares sold. These sales represent less than 1% of shares outstanding.
Short interest trends are more insightful. There are currently 111 thousand shares sold short, which equates to 1% of shares outstanding and three days to cover. Short interest has fallen 52% from 229 thousand shares at the end of December 2016. It would appear that we’re not the only ones recognizing the value in HOFT.
Auditable Impact of Footnotes & Forensic Accounting Adjustments
Our Robo-Analyst technology enables us to perform forensic accounting with scale and provide the research needed to fulfill fiduciary duties. In order to derive the true recurring cash flows, an accurate invested capital, and an accurate shareholder value, we made the following adjustments to Hooker Furniture’s 2017 10-K:
Income Statement: we made $10 million of adjustments, with a net effect of removing less than $1 million in non-operating expense (<1% of revenue). We removed $5 million in non-operating income and $5 million in non-operating expenses. You can see all the adjustments made to HOFT’s income statement here.
Balance Sheet: we made $123 million of adjustments to calculate invested capital with a net increase of $10 million. The most notable adjustment was $30 million in operating leases. This adjustment represented 12% of reported net assets. You can see all the adjustments made to HOFT’s balance sheet here.
Valuation: we made $139 million of adjustments with a net effect of decreasing shareholder value by $62 million. Apart from $75 million in total debt, which includes the $30 million in off-balance sheet operating leases noted above, the largest adjustment was $39 million in excess cash. This cash adjustment represents 7% of HOFT’s market cap. Despite the net decrease in shareholder value, HOFT remains undervalued.
Attractive Funds That Hold HOFT
The following funds receive our Attractive-or-better rating and allocate significantly to Hooker Furniture.
- Royce Special Equity Fund (RSEIX) – 3.5% allocation and Attractive rating.
- Arrow QVM Equity Factor ETF (QVM) – 2.2% allocation and Very Attractive rating.
- MarketGrader 100 Enhanced Index Fund (KHMIX) – 1.2% allocation and Attractive rating.
This article originally published on December 6, 2017.
Disclosure: David Trainer, Kyle Guske II, and Sam McBride receive no compensation to write about any specific stock, style, or theme.
Article by Kyle Guske II, New Constructs


