
Farnam Street Investments letter to clients for the month of January 2018.
Greetings!

This letter is slightly longer than normal, but we had a fair amount to cover. Here’s what you will find as you read on:
How long does it take to evaluate an investment approach? Or said a different way, how long does a value investing approach take to work?
What is Warren Buffett’s number one rule for investing and how can you follow it?
How do Bitcoin and other cryptocurrencies stack up as investments?
Warren Buffett’s three types of investments.
How invested is Warren Buffett right now? Berkshire’s balance sheet update.
FSI is lowering our fees to stay ahead of the competition.
Keeping Score
“Investing is simple, but not easy.” - Warren Buffett
Multiple choice question: What is the proper amount of time required to evaluate an investment manager or strategy?
A. One Year
B. Five Years
C. Ten Years
D. Twenty Years
Mark down your answer, we’ll wait.
Some may argue that one year is enough time for evaluation. After all, there are roughly 252 trading days in a year. You should presumably be able to tell if someone can swing the bat after more than 250 trips to the plate, right? Not so fast...
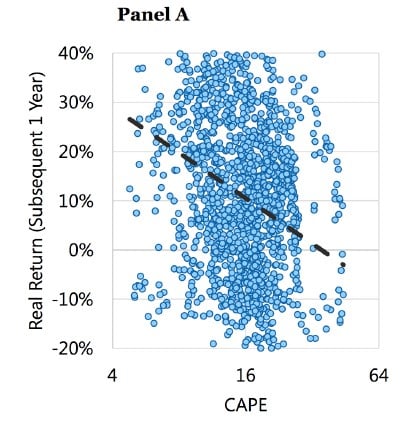
The below charts from Research Affiliates can help us find an answer. For background, the CAPE ratio stands for Cyclically Adjusted Price Earnings. It is a measure of the market’s valuation any given day. The researchers measured the CAPE every year, and then tracked how the market performed from that point onward in a series of snapshots. The lower the CAPE, the cheaper the market. A higher CAPE signals a more expensive market. The historical average is around 16, meaning if the S&P 500 was one large conglomerate, you generally would pay 16x its profit on average to become an owner. As value investors, we naturally prefer to buy during cheap, low CAPE markets.
Results After One Year
Panel A shows the historical returns (1881-2017) of the S&P 500 one year after measuring the CAPE. As the scattering indicates, the returns are all over the map. There’s no discernable pattern-- any given year is random noise. So you can scratch out A. One Year as a reasonable evaluation period. Anything can happen in one year, good or bad.
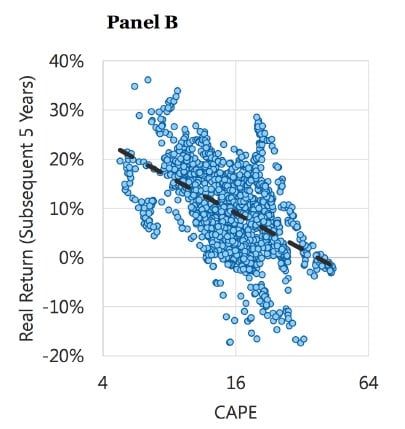
Results After Five Years
Maybe one year isn’t enough, but surely five years might suffice? That’d be over 1,250 trading days. If what you were doing was going to work, it presumably couldn’t take longer than five years.
Yet, Panel B shows that even five years after CAPE measurement, there’s still a fair amount of noise in the annualized return outcomes.
It’s certainly better than one year’s randomness. Lower starting CAPE scores are starting to indicate higher expected returns.
Results After Ten And Twenty Years
Panel C (10 years) and Panel D (20 years) show the dots squish nicely toward a meaningful relationship. Gone is much of the noise of the one- and five-year plots. We’re now seeing statistical relevance. The dots gathering around the trend line tell us with confidence that the lower the starting CAPE, the higher the likely returns.
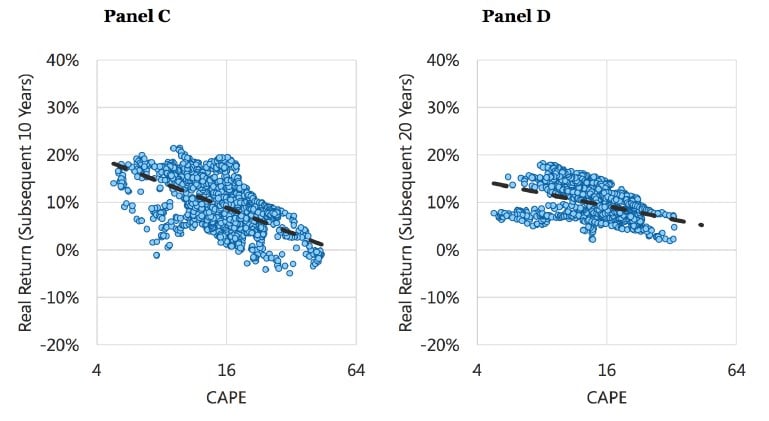
A careful observer will note that the slope of the ten-year line in Panel C is actually steeper than the twenty-year of Panel D. This indicates the effects of buying cheap vs. expensive start to diminish after two decades, likely due to reversion to the mean as twenty years is a long time. The natural balancing forces of economics, progress, and competition are irresistable over long periods and you end up closer to the averages. Cheap vs. expensive starts to wash away with so much time.
We’re left with the prescription that we should buy whenever CAPE is low and blissfully ignore the portfolio for ten years. Conversely, an investor should abstain when CAPE is high. This study strongly affirms that it takes between ten and twenty years for a statistically-based value strategy to play out. Who knew investing could be so simple?!
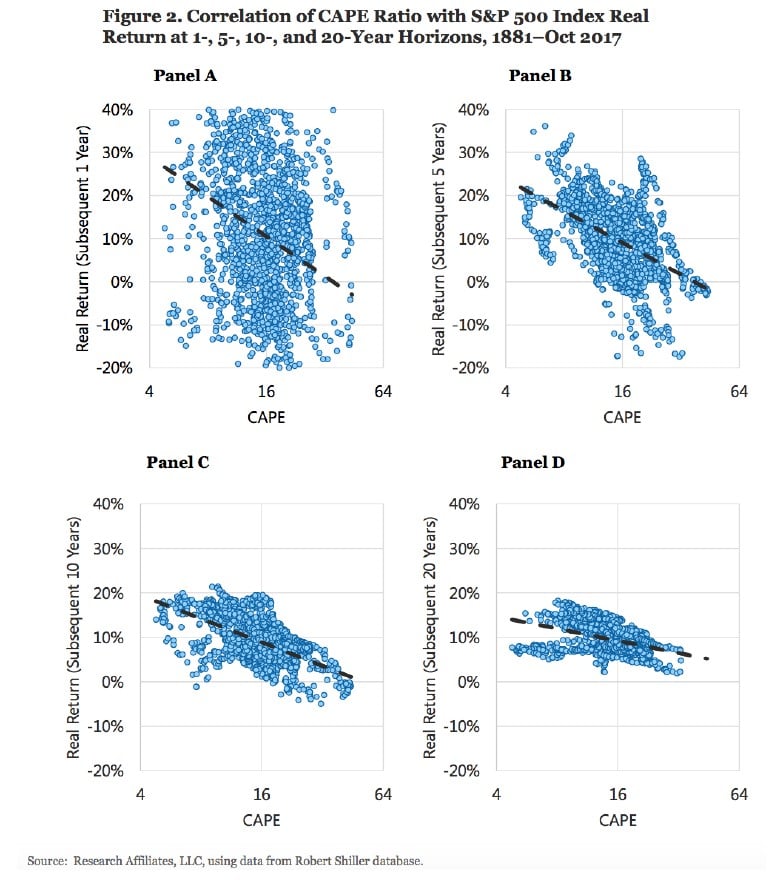
Here are all four panels put together to illustrate how value strategies take time to play out. Watch as noise becomes signal.
Mr. Buffett said investing is simple, but it isn’t easy. (You knew there’d be a catch.) With the noise of the financial markets, it’s anything but easy to have the patience to let a value strategy work over ten years. Who could sit idly by for one, two, even five years while it’s not working? Sadly, very few. Yet you can feel good that in ten years time, the odds are in your favor. In fact, the next graph shows how ridiculously fortunate your odds actually are.
Mr. Buffett has famously said that the number one rule of investing is, don’t lose money. (Rule #2: see Rule #1.)
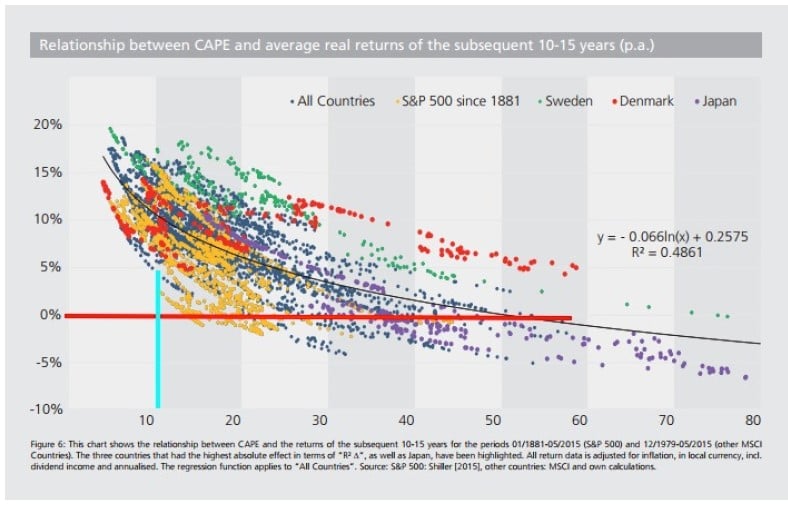
The below graph shows that if you keep your purchases below a CAPE of 10 and buy at cheap prices, there are no instances in the data set of losing money in a 10-15 year time frame. Wouldn’t that be the very definition of following Warren Buffett’s Rule #1? It’s rare to find a strategy that so definitely provides positive results.
Any investment strategy requires faith. It’s especially important for the clients of a value-based firm to understand the strategy and agree with its merits. A plan this slow to unfold requires a certain mindset and the patience to see it through. The temptations to chase whatever is hot right now will always be shimmering. The shift from investor to speculator often occurs unnoticed, as you’ll read in the next section about Bitcoin.
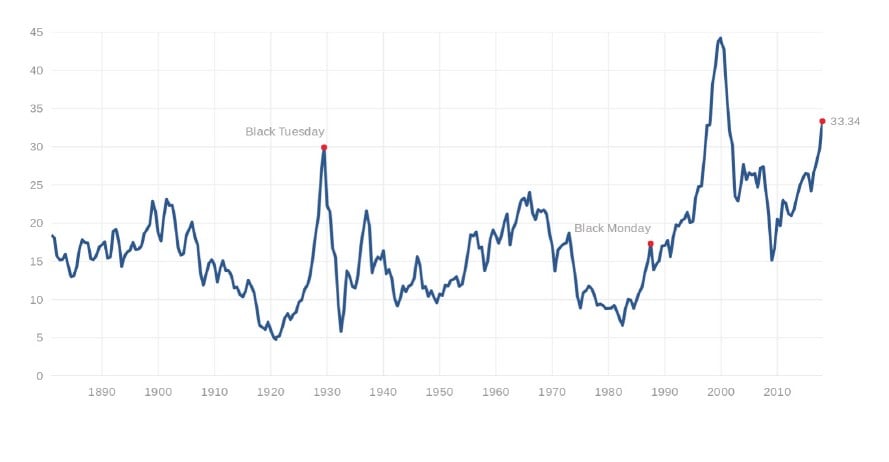
In case you were wondering where we are right now in the US, the graph below shows we’re currently double the long term average (33.3 vs. ~16). The implied expected returns from this high level are dismal. All that’s missing is the neon sign flashing “DANGER.” It’s little wondering we hear repeated complaints from other fundamental-based investors that the pickings are slim.
It’s impossible for us to just “start buying stocks” or take on what we believe to be additional risk given the historical evidence. That would be like asking the risk-adverse non-gambler to jump on the craps table after a shooter has had a good run. It doesn’t make logical sense at any time and never will.
Bitcoin and Cryptocurrencies
“Investing is intolerably boring and over-exacting to anyone who is entirely exempt from the gambling instinct; whilst he who has it must pay to this propensity the appropriate toll.” – John Maynard Keynes
[Plain English: If your investing isn’t boring, it’s likely to be expensive.]You’ve no doubt come across a story or two about Bitcoin and other cryptocurrencies. It was easily the hottest finance topic in 2017, and everyone has an opinion after the crazy price moves.
Market sage Jeremy Grantham created a chart that shows how extreme the Bitcoin price movement has been:
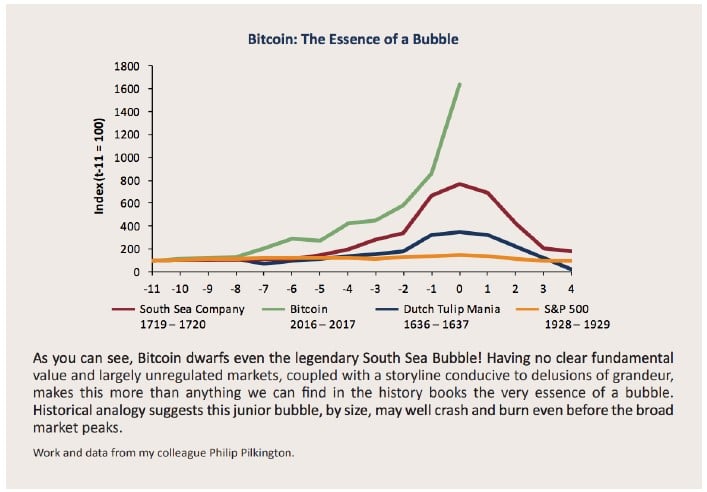
Bitcoin serves as an interesting sorting mechanism between investors and speculators. Rarely do we see such a perfect line of demarcation between philosophies.
Investors give up their purchasing power now with the expectation of receiving more purchasing power in the future. They determine the attractiveness by comparing the current price to fundamentals like assets and cash flow.
Speculators look at price movements and buy with the intention of selling to someone else for more at a later time.
So where does Bitcoin fit in?
In 2012, Warren Buffett wrote a canonical Forbes article that detailed why stocks beat gold and bonds. It’s worthy of a re-read.
Mr. Buffett broke down the investment world into three categories.
1. Investments Denominated in a Given Currency
These include bonds, money market funds, mortgages, bank deposits, etc. They return an agreed-upon percentage over a defined time period. The risks appear small and the return certain. Yet the specter of inflation is always lurking to rob you of your return.
Even with the 1-2% stated inflation of late, the dollar’s historical track record is not good. Since 1960, it takes over $8 today to match the purchasing power of $1 from JFK’s presidency. That’s a nearly 90% loss due to inflation. Other countries haven’t proved any better managing their currencies.
The hidden tax of inflation has been about three times the explicit taxes you pay to the government directly. Ouch. (Makes you wonder why we squabble over various tax plans, but aren’t able to audit the Federal Reserve.)
Where are we today?
Interest rates are pegged artificially low by governments and central banks in an effort to juice the global economy. The potential for loss from currency-denominated investments is dangerously high, especially in comparison with the paltry returns received. Rather than risk-free return, it looks more like return free risk.
Here was Mr. Buffett in the 2012 article: “Right now bonds should come with a warning label. Under today’s conditions, I do not like currency-based investments.” Nothing’s changed since 2012. If anything, it’s worse. We don’t know when, but some day there will be a reckoning in the bond markets. And because bonds are roughly twice the size of the equity markets, it will be a sight to behold.
If you can explain how roughly $10 trillion of bonds with negative interest rates makes any sense, we’d love to hear from you.
Let me get this straight. I give you money today, and you promise to give me back less in ten years? Why would I ever make that deal?
It takes a certain level of economic genius to be that stupid.
Unsurprisingly, our clients have very little bond exposure and everything is of the shortest duration possible to avoid return-free risk. You can even think of all of the cash we hold as super-short duration US bonds. When viewed through this lense, our roughly 50% stock - 50% cash/bonds portfolios look more orthodox.
2. Investments in Sterile Assets
The second category of investments Mr. Buffett details are assets that never produce anything. Gold and silver have always been popular ideas from this category. You can also include art, collectible cars, antiques, stamps, baseball cards, tulips, even Beanie Babies.
And of course, Bitcoin.
“This type of investment requires an expanding pool of buyers, who, in turn, are enticed because they believe the buying pool will expand still further. Owners are not inspired by what the asset itself can produce — it will remain lifeless forever — but rather by the belief that others will desire it even more avidly in the future.” — Warren Buffett
Sounds an awful lot like the thesis for Bitcoin.
Rising prices deliver the proof that skeptics need to buy into the story. The game keeps working until you run out of new people to buy at ever-increasing prices. The jig is then up. How far it crashes is anyone’s guess because there are no fundamental anchors like cash flow to arrest the fall.
It’s highly unlikely Bitcoin will be different than other sterile assets.
Mr. Buffett weighed in on CNBC right before this letter went to press: “In terms of cryptocurrencies, generally, I can say with almost certainty that they will come to a bad ending... If I could buy a five-year put on every one of the cryptocurrencies, I’d be glad to do it but I would never short a dime’s worth.”
Caveat emptor.
The total market cap of the top ten largest cryptocurrencies is around $560B. You could theoretically store all half-a-trillion dollars worth on a single thumbdrive. (Don’t lose it!)
Let’s do an exercise in opportunity cost: For that same amount of money, what else could you buy?
Here’s an interesting shopping list:
Intel [INTC] and AMD [AMD] -- $216B -- 99% market share of chip makers (CPU)
Nvidia [NVDA] -- $128B -- top shelf graphics card producer (GPU)
Micron [MU] -- $52B -- leading DRAM manufacturer
Seagate [STX] -- $12B -- 40% market share hard drive manufacturer (HDD)
Duke Energy [DUK] -- $58B -- Largest producer of electricity in the US, we need some way to power all these circuits
American Express [AXP] -- $86B -- 60 years of financial transaction experience to learn from You could own the above companies in their entirety. You would get all of the profits of a healthy chunk of the world’s computer hardware industry, and a top notch financial company to handle the transactions. Or you can have some computer codes.
“Nothing sedates rationality like large doses of effortless money.” - Warren Buffett
3. Investments in Productive Assets
The third of Mr. Buffett’s investment categories includes productive assets like businesses, farms, real estate, etc. These assets provide goods and services people want and need, regardless of unit of currency.
“Our country’s businesses will continue to efficiently deliver goods and services wanted by our citizens. Metaphorically, these commercial “cows” will live for centuries and give ever greater quantities of “milk” to boot. Their value will be determined not by the medium of exchange but rather by their capacity to deliver milk… I believe that over any extended period of time this category of investing will prove to be the runaway winner among the three we’ve examined. More important, it will be by far the safest.” — Warren Buffett
We can’t fault his logic. Naturally, this third category is where we spend our efforts bargain shopping for productive assets around the world. Unfortunately at this time, the discount shelves are bare.
Berkshire Balance Sheet Watch
We like to keep an eye on the cash and short-term bond investments Mr. Buffett keeps at Berkshire headquarters. It gives us an idea of how invested they are at any given time.
12/31/13 - $48 billion
12/31/14 - $63 billion
12/31/15 - $71 billion
12/31/16 - $110 billion
9/30/17 - $132 billion
Compare that to an equity portfolio of $152B and you can surmise that Berkshire has ~46% cash. Perhaps, not coincidentally, very much in line with our portfolios.
Lowering Fees
Any good business person is conscious of the fees they charge compared to the value they’re able to deliver.
A comprehensive survey of financial advisor fees was recently released. Farnam Street fared well. Our average account size for our separately managed accounts is about $150,000. The median fee for our bracket was 1.25%, so we’re squarely in the middle.
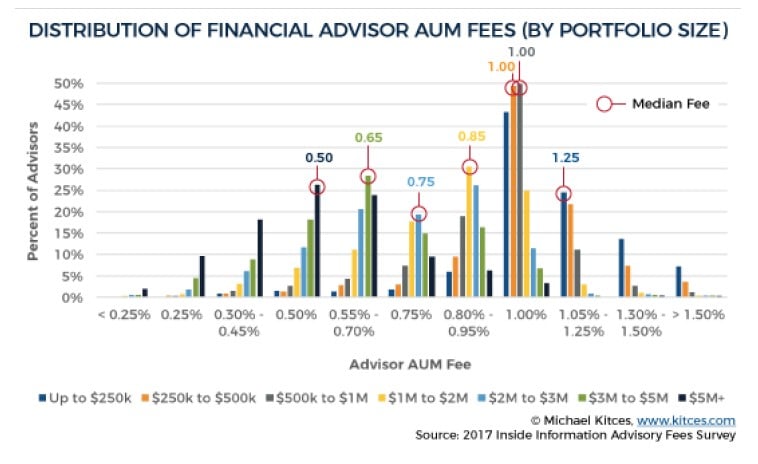
But in order to stay below the median and ahead of the competition, we’ve lowered our standard fee from 1.25% to 1.00% flat for our managed retirement accounts, effective immediately.
Here’s to a fantastic 2018!
As always, we’re thankful to have such great partners in this wealth creation journey.
Jake & Lonnie
See the full PDF below.


