SUMMARY
- Factor timing and factor risk management are related concepts, but have different objectives
- Factors have unique characteristics that require a tailored risk management approach
- A multi-dimensional factor risk management model shows consistent increases in risk-return ratios and decreases in maximum drawdowns across markets

INTRODUCTION
Smart beta funds surpassed $1 trillion assets under management in 2017 and factor long-short products have approximately half of that amount in assets. Both product families are based on academic research that has shown that some factors generate positive returns across time, countries and sectors. However, factors, like equity markets, exhibit highly cyclical behaviour and experience significant multi-year drawdowns, which means it is risky for investors to focus exclusively on a single factor. Given this, investors tend to diversify across several factors, which raises the question of how to allocate to factors. In this white paper we will analyse two common approaches to factor allocations, which are equal-weight and risk parity models, and introduce an alternative, which we term the “multi-dimensional factor risk management model”.
METHODOLOGY
We focus on the following six factors: Value, Size, Momentum, Low Volatility, Quality and Growth and the following seven markets: US, Europe, UK, Japan, Australia, Hong Kong and Singapore. The factors are constructed as beta-neutral long-short portfolios by taking the top and bottom 10% of the stock universes in the US, Europe and Japan and 20% in other markets given smaller stock universes. Only stocks with market capitalisations of larger than $1 billion are considered and 10 basis points of costs per transaction are included. The analysis covers the period from 2000 to 2017.
There are three core approaches for creating multi-factor portfolios (please see our white paper Multi-Factor Models 101 for further information):
- Combination approach: Stocks are ranked by single factors and then single-factor portfolios are combined into a multi-factor portfolio
- Intersectional approach: Stocks are sorted by several factors simultaneously, which results in one portfolio
- Sequential approach: Stocks are sorted by factors sequentially, which results in one portfolio
The factor allocation models are relevant for all approaches, but in this white paper we will analyse the models from the perspective of the combination portfolio. The models are defined as follows:
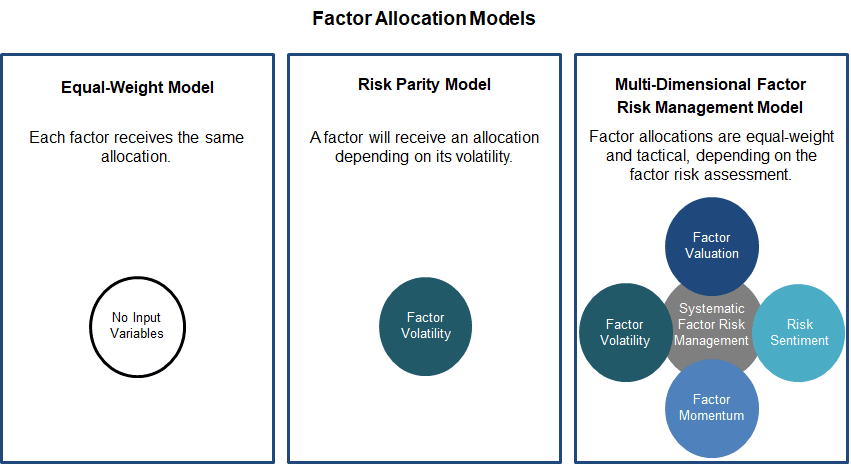
- Equal-weight model: The allocations are the same for all factors
- Risk parity model: The allocations are risk-weighted, i.e. there are portfolio and factor volatility targets. We derive factor volatility targets by approximating the same portfolio volatility of the equal-weight portfolio.
- Multi-dimensional factor risk management model: The allocations are equal-weight, but tactical. The risk management model is fully systematic and incorporates the following four elements: factor valuations, factor volatility, factor momentum and risk sentiment. The rationale for selecting these four metrics is our understanding of the underlying factor drivers and characteristics. The factor allocations are modelled as either 0% or 100%, depending if the factor risk is determined as high or low. The portfolio therefore holds cash periodically, but no interest income is assumed, which slightly understates the returns.
Source: FactorResearch
All changes by the allocation models are assumed to be transacted with a time delay of one day and are modelled to avoid aggressive trading, in order to make the results implementable in portfolio management.
FACTOR TIMING VERSUS RISK MANAGEMENT
Before we analyse the performance of the three factor allocation models it is worth addressing the objectives of the models, which are generally to improve the risk metrics of a multi-factor portfolio, specifically to increase the risk-return ratios and decrease drawdowns. The equal-weight model aims to achieve this by simply diversifying equally across factors while the risk parity model seeks to equalise the risk of factors by scaling up or down the allocation weights based on factor volatility. The multi-dimensional factor risk management model allocates on a tactical basis and considers the individual characteristics of each factor. The risk parity or multi-dimensional factor risk management model might be characterised as factor timing models, but this would not be an accurate reflection of the objectives. Factor timing, like market timing, aims at improving the performance of factors, which is unlikely achievable. Factor risk management is a related concept but seeks to improve the risk-return metrics, often at the price of performance. Like the two sides of a coin, they are the same, yet different.
FACTOR PERFORMANCE CHARACTERISTICS
In addition to contrasting the differences between factor timing and risk management we would like to highlight some of the unique characteristics of factor performance. Our research shows that most factors exhibit similar trends across countries, e.g. the performance of the Momentum factor in the US and Japan is comparable. The same applies to cross versus intra-sector, where the factor performance is remarkably similar within a sector compared to the factor performance across all sectors, which can be seen in the chart below. It seems like factors have the same underlying drivers that permeate borders and sectors.
 Similar Trends Across Markets & Sectors")
Source: FactorResearch
However, although some factors show the same trends across markets and sectors, the performance for different factors is naturally quite heterogeneous within a country. Changing investor preferences lead to a constant factor rotation in terms of performance. More importantly, factors behave differently from a risk perspective, which can be measured by the skewness of the return distribution. Positive skewness describes a return distribution where frequent small losses and a few extreme gains are common while negative skewness highlights frequent small gains and a few extreme losses. Some factors exhibit positive, some none, and some negative skewness. Interestingly the skewness profile is similar across countries, e.g. the Momentum factor has negative skewness in every single market. The chart below shows the factor skewness profile for the median across markets, which consists of the US, Europe and Asia.
Source: FactorResearch
In addition, we can analyse the kurtosis of factors, which simply said indicates if extreme gains or losses occur more often than investors might anticipate. In the chart below, we can observe that all factors have a kurtosis larger than 3 (normal distribution). The skewness indicates if the extreme returns are more likely to be positive or negative. The Momentum factor shows a high level of kurtosis and negative skewness, which reflects rare, but severe factor crashes.
Source: FactorResearch
We believe that a thorough understanding of the underlying factor drivers and unique factor characteristics are essential for creating an effective factor risk management framework.
FACTOR ALLOCATION MODELS
Given that the objective of the factor allocation models is an improvement in risk-metrics, we will compare the risk-return ratios and maximum drawdowns for long-short multi-factor portfolios across markets. The portfolios include the Value, Size, Momentum, Low Volatility, Growth and Quality factors. In the chart below, we can observe that the multi-dimensional factor risk management model consistently generates the highest risk-return ratios across markets for the period 2000 to 2017, followed by the equal-weight model. The risk parity model shows the lowest ratios on average.
Source: FactorResearch
The next chart highlights the maximum drawdowns for the three factor allocation models across markets. We can observe that the equal-weight model shows the highest drawdowns, while the risk parity model reduces these in most markets. The multi-dimensional factor risk management model shows a significant decrease in maximum drawdowns across all markets.
Source: FactorResearch
The charts below summarise the results on a global level. It is interesting to observe that the risk-parity model does not improve the risk-return ratio. Risk parity is a well-researched model and often employed across asset classes. Our research indicates that the risk parity approach improves risk metrics if factors or asset classes exhibit negative skewness, e.g. like the Momentum factor or bonds, but is less effective with factors or asset classes that exhibit positive skewness, e.g. like the Value factor or commodities. Investors should not regard high factor volatility as undesirable or negative per se.
Source: FactorResearch
Although the objective of the factor allocation models is primarily to reduce risk and not to improve returns, we can compare the performance of the global multi-factor portfolios, which is shown on an equal-volatility basis to make the results comparable. We can observe that the equal-weight and risk parity models result in almost the same performance for the multi-factor portfolio, which is reflected in similar risk-return ratios, while the multi-dimensional factor risk management model shows a consistent outperformance.
Source: FactorResearch
The chart below shows the correlations of a long-only global equity portfolio and the multi-factor portfolios from the equal-weight and risk parity models to the portfolio derived from the multi-dimensional factor risk management model. We can observe that the factor allocation models have correlated portfolios, which is to be expected, while the correlation to equities is low, making the portfolio attractive for equity investors from a diversification perspective.
Source: FactorResearch
CONCLUSION
This white paper analyses three different factor allocation models, two of which are commonly used by investors to create multi-factor portfolios. The results highlight that an equal-weight model is better or worse than a risk parity approach, depending if the focus is on increasing the risk-return ratio or decreasing the maximum drawdowns. A third model, the multi-dimensional factor risk management model, shows consistent improvements in risk-metrics across all markets. The model’s superior results can be explained by incorporating multiple variables, which reduce the single-variable risk and reflect the unique characteristics of factors.
FURTHER THOUGHTS
The search for better allocation models is a perpetual one and there are no perfect models. New technologies like machine learning can be applied to enhance existing or create new models. However, we don’t think that new factors will be discovered, but we do believe that factor returns can be harvested more efficiently.
APPENDIX
We tested three different factor allocation periods over a period from 2000 to 2017 and can extend the analysis by using data from Kenneth R. French’s website, which can be considered an out-of-sample test for the multi-dimensional factor risk management model. The factor allocation models as described in the Methodology section are applied to this extended factor data set.
US FACTORS 1926 – 2016
Data is available for the US stock market from 1926 to 2016 for the Value, Size and Momentum factors, which are constructed as dollar-neutral long-short portfolios based on the top and bottom 10% of the US stock universe. The chart below shows the risk-returns ratios of the multi-factor portfolios in the US, where we can observe that the risk parity and multi-dimensional factor risk management model both significantly increase the ratios compared to the equal-weight approach.
Source: FactorResearch, Kenneth R. French Data Library
We can also see a meaningful reduction in maximum drawdowns from the risk parity and multi-dimensional factor risk management models, which is shown in the chart below.
Source: FactorResearch, Kenneth R. French Data Library
INTERNATIONAL FACTORS 1990 – 2016
Data is also available for international markets from 1990 to 2016. The Value, Size and Momentum factors are constructed as dollar-neutral long-short portfolios based on the top and bottom 30% of the stock universes. The chart below shows the risk-return ratios for the multi-factor portfolios, where we can observe that the multi-dimensional factor risk management model significantly increases the ratios across all markets compared to the equal-weight or risk parity approaches.
Source: FactorResearch, Kenneth R. French Data Library
Like for the results for the US from 1926, the multi-dimensional factor risk management model meaningfully decreases the maximum drawdowns across markets.
Source: FactorResearch, Kenneth R. French Data Library
APPENDIX DISCUSSION
Comparing the results for the multi-factor portfolios from the main section of this white paper with the results from the Appendix may lead to a slightly different conclusion regarding the effectiveness of the risk parity model. The results from the main section are based on multi-factor portfolios including six factors, cover the period from 2000 to 2017, and indicate no significant improvement to an equal-weight model. The results from the Appendix results include three factors, cover the periods from 1926 to 2016 respectively from 1990 to 2016, and indicate significant improvements to an equal-weight portfolio. The difference can be explained by the Momentum factor, which dominates the performance of the multi-factor portfolios in the Appendix. The chart below shows the CAGRs, but these returns are without transaction costs, which have a larger impact on Momentum given significantly higher turnover.
Source: FactorResearch, Kenneth R. French Data Library
If transaction costs would be included, the portfolio would be more balanced in terms of single factor contribution. The charts below show the skewness of the three factors as well the risk-return ratios on single factor basis, once unadjusted and once with volatility-targets, where we can observe that only the Momentum factor improves. Volatility and risk are not necessarily the same.
Source: FactorResearch, Kenneth R. French Data Library
ABOUT THE AUTHOR
Nicolas Rabener is the Managing Director of FactorResearch, which provides quantitative solutions for factor investing. Previously he founded Jackdaw Capital, an award-winning quantitative investment manager focused on equity market neutral strategies. Before that Nicolas worked at GIC (Government of Singapore Investment Corporation) in London focused on real estate investments across the capital structure. He started his career working in investment banking at Citigroup in London and New York. Nicolas holds a Master of Finance from HHL Leipzig Graduate School of Management, is a CAIA charter holder, and enjoys endurance sports (100km Ultramarathon, Mont Blanc, Mount Kilimanjaro).
Article by Factor Research


