Headline:
Trailing 12 Month Sharpe Ratio = True “Tell”
************************************
There Is Plenty Of Chatter About The U.S. Equities Markets & How Extended They May Be.
So Often I Am Asked About A Catalyst To Initiate A Meaningful Price Reversal. I Wish I Had An Easy Answer. It Could Be Many Things…Almost Anything. But Actually The Catalyst = Almost Irrelevant.
What Resonates With Me The Most, Though, Is The Multi-Year URGENCY To Buy Equities…As Measured By A Lack Of Any Meaningful, Peak To Trough, Capital “Draw-Down” Since February 2016.
The BTFD Mentality Continues To Prevail And Is Increasingly Acute…As The Price Dips Are Less Frequent + Increasingly Brief + Shallow.
Meanwhile…Stock Prices Regularly Reach New All-Time Heights.
************************************
The Market’s Elasticity Seems Stretched Very Close To Its Limits…But Still…Prices Continue To Surge At A Steepening Rate…Thanks, Primarily, To The Seemingly Open-Ended/Massive Liquidity Measures Offered By Global Central Banks [QE, ZIRP, NIRP & IOER In The U.S.].
That These Liquidity Measures Also Dilute The Currencies, In Which Equities Are Specifically Denominated, Further Confounds The Parabolic Equity Advance.
************************************
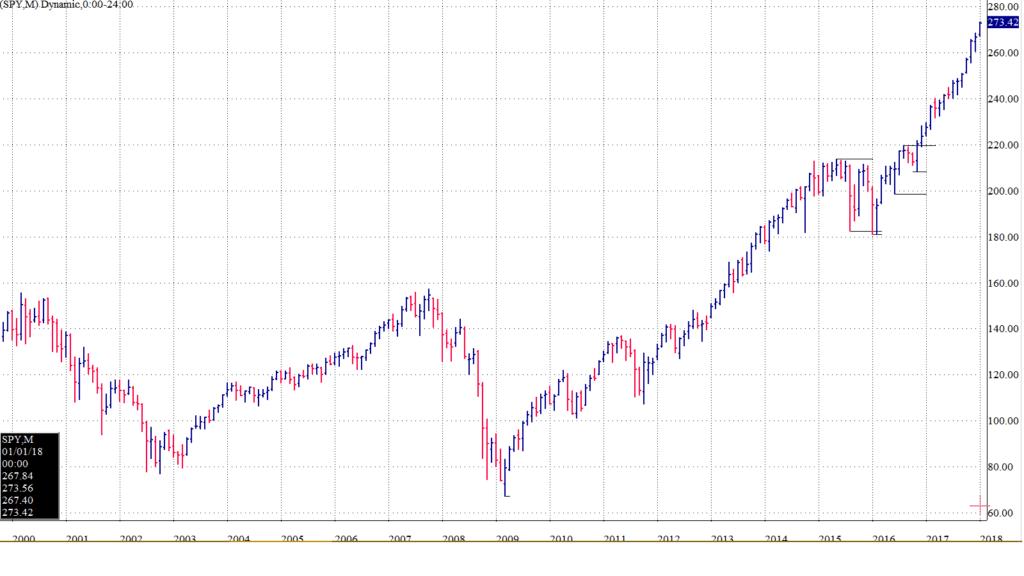
The Monthly Chart Of The SPX [see above] Visually Demonstrates The Relentless Price Thrust Higher.
Furthermore, That The S&P 500’s Total Return Was Positive For Every Month Of Calendar 2017 = Simply Stunning…Resulting in 19.38% Return [ex:dividends].
Even More…Since March 2016…20/22 Months Have Yielded Positive Returns. And The Absolute Returns = Awesome = 41.25% [ex:dividends].
Fundamentally…Earnings Per/Share For The S&P 500 Constituents Have Improved But, More Importantly, The EV/EBITDA Multiples Have Also Strongly Advanced…Offering Much More Fuel To Prices Than The Decent Earnings Increases.
************************************
But What Makes The Market Return Profile Especially Remarkable…Is Not The Impressive Percentage Gains [bull markets have yielded many similar results over the past century]…But The Lack Of Volatility…As Measured By The Standard Deviation Of Prices Associated With These Returns.
It Is The Before Mentioned BTFD’ers That Perpetuate The Lack Of Standard Deviation/Volatility.
Of Course The BTFD Behavior Is Shaped By Central Banker Behavior…That Encourages Massive Risk-Taking…Despite The Unprecedented Price Climb.
************************************
So How To Measure/Quantify Any Of This?
The Sharpe Ratio Is The Gold Standard To Measure/Quantify This Feature As It’s Quotient Incorporates Standard Deviation Of Returns In Its Denominator.
************************************
It Essentially Communicates The Mathematical Pathway To Returns…How Much Capital “Draw-Down”/Pain Was Endured To Achieve Returns.
And Historically…There Is Usually A Fair Amount Of Pain On This Path…Despite Monumental Efforts To Avoid Such Pain.
The Higher The Value Of The Sharpe Ratio = The Better The Return Profile As The Sharpe Ratio Assigns a Higher Value On “Risk-Adjusted Returns” Vs. “Absolute/Plain Returns”
Be Advised, Though, That A Higher Sharpe Ratio Value Does Not Necessarily = Higher Absolute Returns.
To The Contrary…A Higher Sharpe Ratio [especially valued at hedge funds] Typically Equates To Lower Absolute Returns…As The Pursuit Of Pain Avoidance Consequently Results In More Dampened Total Returns.
************************************
On The Other Hand “Long-Only” Mutual Funds + Passive Indexed Strategies Usually, Over Longer Time Frames, Cannot Avoid A More Muted Sharpe Ratio [versus hedge funds] As They Are Wholly Exposed To Downside Volatility [fully invested mandate]…That Is…UNTIL RECENTLY…As The Data Set Below Demonstrates.
S&P 500
Month End 12.17
Sharpe Ratio
1-Yr 4.36
3-Yr .88
5-Yr 1.35
10-Yr .45
15-Yr .53
Standard Deviation
1-Yr 3.89
3-Yr 10.04
5-Yr 9.46
10-Yr 15.08
15-Yr 13.26
************************************
The 1 Year Data = STAGGERING…Not Only Because Of The Stratospherically High Sharpe Ratio of 4.36 [driven by both a strong numerator + puny denominator] But Because It Is Associated With A Long Only, Non-Levered Passive Strategy…Producing Close To 20% Returns.
Remember…Higher Sharpe Ratios Are Typically Linked To Lower [Not Higher] Absolute Returns.
Plus, These Recent Results Stand On The Shoulders Of A Market Low Achieved Almost 9 Years Ago.
************************************
So…Is The Sharpe Ratio Just Another Indicator Rendered Useless By Money Printing Central Bankers?
I Think Not.
What The Current Sharpe Ratio Actually Speaks To = Market Participants Recklessly Sprinting Into A Mature Bull Market….Pointing To An INCREASING PROBABILITY OF A LARGE PRICE DECLINE…NO MATTER THE CENTRAL BANKER REACTIONARY TACTICS.
************************************
Contact The Author: [email protected]


