

-
- Lower marginal tax rate: The marginal tax rate for the United States has gone from being the highest in the world to close to the middle. At a 24% marginal tax rate, which is where I think we will end up with state and local taxes added to the new federal tax rate of 21%, you are effectively reducing the tax benefit of debt by about 40% (from 40% to 24%). In the heat map below, I have highlighted marginal tax rates of countries, with a highlighting in shades of rec of those that will have lower marginal tax rates than the US after 2018. To provide a contrast, this picture would have been entirely in shades of red last year, before the tax rate change, since there was no other country with a corporate tax higher than 40%.
-
- via
chartsbin.com
- Limits on interest tax deductions: Until last year, as has been the case for much of the last century, US companies have been able to claim their interest expenses as tax deductions, as long as they have the income to cover these expenses. With the new tax code, there is a limit to how much interest you can deduct, at 30% of “operating income”. Any excess interest expenses that cannot be deducted can be carried forward and claimed in future years, and that provision will help companies with volatile earnings, since they will be able to claim back deductions lost in a bad year, in good years. As is its wont, Congress has chosen to make up its own definitions of operating income, with EBITDA standing on for operating income until 2022 and then transitioning to earnings before interest and taxes (EBIT).
- Capital Expensing: Attempting to encourage investments in physical assets, especially at manufacturing companies, the tax code will allow companies to expense their capital investments for a temporary period. The resulting tax deductions may be large enough to reduce the benefit to having the interest tax deduction. That effect will be magnified by the fact that the companies that are most likely to be using the capital expensing provisions are also the companies that have used debt the most in funding their operations.
- Un-trapped Cash: As companies are allowed to pay a one-time tax and bring trapped cash back to the United States, the cash will be now available for other uses and reduce the need for debt as a funding source. Note that estimates of this trapped cash, collectively held by US companies, exceed $3 trillion and that even if only half of this cash is brought back, it would still be a substantial amount.

 |
| Disney Capital Structure Spreadsheet |
The cost of capital is a driver of the value of the operating assets, and since the costs of capital are higher at every debt ratio than they used to be, it should come as no surprise that the value added by debt has dropped at every debt ratio, with the new tax code.

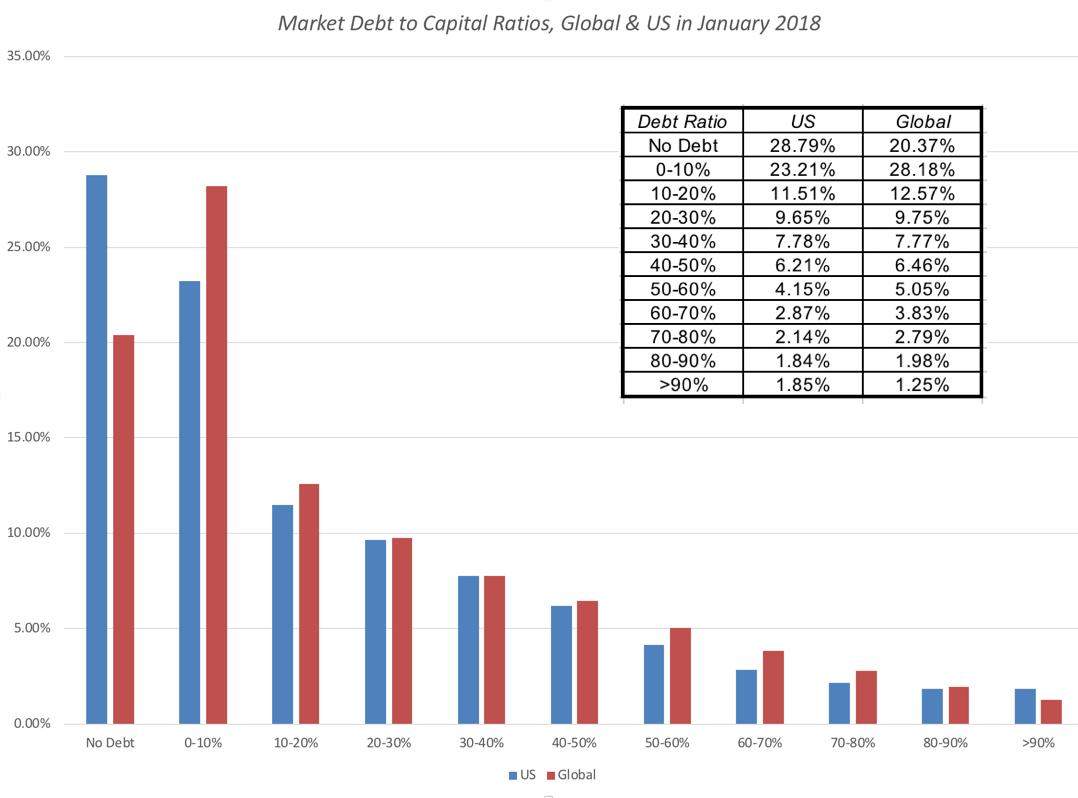
I was surprised by how many firms in the global sample have little or no debit their capital structure, with more than half of all firms in the sample having total debt to capital ratios of less than 10%. In fact, netting cash out from debt would lead to even lower net debt ratios. That said, there is enough debt at the largest firms that the aggregated debt ratios across all firms is significantly higher. Looking at these aggregated debt ratios, you would expect US companies to have been borrowing more money than companies in other parts of the world, and to see if they did, I looked at measures of financial leverage, from debt scaled to capital to debt to EBITDA globally:
| Sub Group | Debt/Capital (Book) | Debt/Capital (Market) | Net Debt/ Capital (Book) | Net Debt/ Capital (Market) | Debt/EBITDA |
|---|---|---|---|---|---|
| Africa and Middle East | 45.23% | 34.00% | 30.27% | 21.31% | 5.99 |
| Australia & NZ | 61.66% | 43.48% | 57.82% | 39.60% | 8.57 |
| Canada | 55.35% | 42.42% | 52.46% | 39.60% | 7.16 |
| China | 51.63% | 39.34% | 41.83% | 30.40% | 8.52 |
| EU & Environs | 60.75% | 47.17% | 53.68% | 40.07% | 7.78 |
| Eastern Europe & Russia | 31.02% | 38.05% | 21.35% | 27.05% | 2.47 |
| India | 54.89% | 20.85% | 50.58% | 18.15% | 3.92 |
| Japan | 56.16% | 49.11% | 27.64% | 22.35% | 7.61 |
| Latin America & Caribbean | 51.67% | 40.01% | 46.23% | 34.90% | 5.74 |
| Small Asia | 44.04% | 34.76% | 36.01% | 27.59% | 4.54 |
| UK | 63.74% | 46.39% | 53.68% | 36.33% | 7.94 |
| United States | 64.06% | 37.11% | 60.86% | 33.99% | 7.09 |
 |
| Download full sector spreadsheet |
I removed financial service firms from this list, since debt to them is a raw material, not a source of capital, and real estate investment trusts, since they do not pay corporate taxes, under the old and new tax regimes. As I noted in my post on tax reform, it is the most highly levered sectors that will be exposed to loss of value and it is entirely possible that the net effect of the tax change can be negative for them.
You seldom get to observe a real world experiment of the magnitude that we will be faced with in 2018, with the tax code in change and the loss in value added from debt. Given the changes, I would expect the following:
- Deleveraging at firms that have pushed to their optimal debt ratios, under old tax code: While there are many firms, like Facebook. where debt was never a source of added value, where the tax code will affect that component of value very little, there will be other highly levered firms where the value change will be substantial. In fact, many of these firms, which would have been at the right mix of debt and equity, under the old tax regime, will find themselves over levered and in need of paying down debt. Given that inertia is the primary force in corporate finance, it may them a while to come to this realization.
- Go slow at firms that have held back: For firms like Facebook that have held back from borrowing, under the old tax code, the new tax code reduces the incentive to add to debt, even as they mature. As you can see from the numbers on Facebook, Disney and Ford, the benefits of debt have been significantly scaled down.
- Transactions that derive most of their value from leverage will be handicapped: Since the mid-1980s, leveraged transactions have been favored by many private equity investors. While one reason was that they were equity constrained (and that reason remains), the bigger reason was that it allowed them to generate added value from recapitalization. At the risk of over generalizing, I will argue that for a large segment of private equity investors, this was the primary source of their value added and for these investors, the new tax code is unequivocally bad news, and I will shed no tears for them.
As I noted at the start of this post, debt is part of the fabric of business in the United States, and there are some businesses and asset classes that have been built on debt. Real estate and infrastructure businesses have historically not only used debt as a primary source of funding but as a value addition, with the added value coming from the tax code. Now that the added value is much lower, it remains to be seen whether asset values will have to adjust.
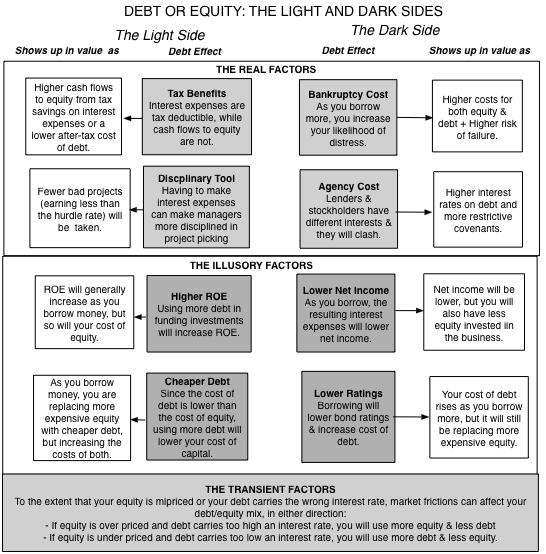
From financial first principles, there is nothing inherently good or bad about debt. It is a source of financing that you can use to build a business, but by itself, it neither adds nor detracts from the value of the business. It is the addition of tax benefits and bankruptcy costs that makes the use of debt a trade off between its benefits (primarily tax driven) and its costs (from increased distress and agency costs). The new tax code has not removed the tax benefits of debt but it has substantially reduced them, and we should expect to see less debt overall at companies, as a consequence. In my view, that is a positive for the economy, since debt magnifies economic shocks to businesses and not only creates more volatile earnings and value, but deadweight costs for society.
YouTube Video
Datasets
- Debt Ratios by Sector, US (January 2018)
- Debt Ratios by Sector, Global (January 2018)
- January 2018 Data Update 1: Numbers don't lie, or do they?
- January 2018 Data Update 2: The Buoyancy of US Equities!
- January 2018 Data Update 3: Taxing Questions on Value
- January 2018 Data Update 4: The Currency Conundrum
- January 2018 Data Update 5: Country Risk Update
- January 2018 Data Update 6: A Cost of Capital Primer
- January 2018 Data Update 7: Growth and Value - Investment Returns
- January 2018 Data Update 8: Debt and Taxes
- January 2018 Data Update 9: The Cash Harvest - Dividend Policy
- January 2018 Data Update 10: The Pricing Prerogative


