Active manager holdings are helping funds beat the market.
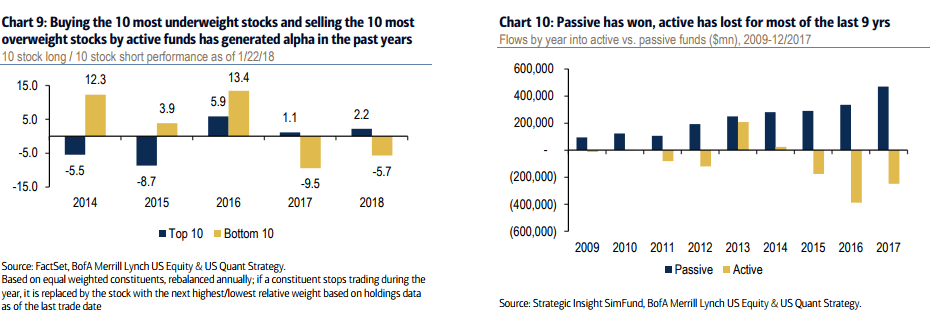
According to Bank of America’s weekly Flow Show Report, during the third week of January investors committed a massive a $23.9 billion to equity funds. Following this contribution, the four-week flow recorded was the biggest ever at $58 billion. And in a reversal of fortunes for active managers, flows into active equity funds rose to a four year high. Active funds alone pulled in $12.2 billion. By comparison, inflows into equity funds across all classes were $278 billion for all of 2017. Last year, more than $150 billion left active funds.
It seems that after almost a decade of withdrawals, active funds are finally attracting investor attention again. It seems performance is helping. Further research from BoA has found 48% of active managers outperformed their benchmarks during 2017 thanks to the favorable stock picking environment. This is the highest percentage of outperformers in eight years and is up significantly from the only 19% who outperformed in 2016.
2017 Is A Win For Active
Active managers have been able to beat the market BoA concludes because of their overweight in Tech and Growth stocks. Large-cap funds hit record overweights in Tech several times last year, and Tech overtook Discretionary as the most crowded sector. Tech went on to be the S&P 500‘s best performing sector for the year accounting for 38% of the index’s gain for the year. Fund managers also increased their bias towards higher Growth stocks, with holdings’ average long-term growth rates at 14% vs. 12% for the S&P 500 index.
Over the past few months, managers have marginally reduced their Tech exposure, although it is still the most crowded industry according to BoA’s latest Active Managers’ Holdings Update report. Specifically, the report notes:
“Large cap active managers’ overweight in Tech fell for the fourth time in the past five months to its lowest level in almost a year (1.23x). Tech remains the most overweighted sector, but the reduction in Tech exposure was broadbased, with relative exposures being cut for every Tech industry over the past three months.”
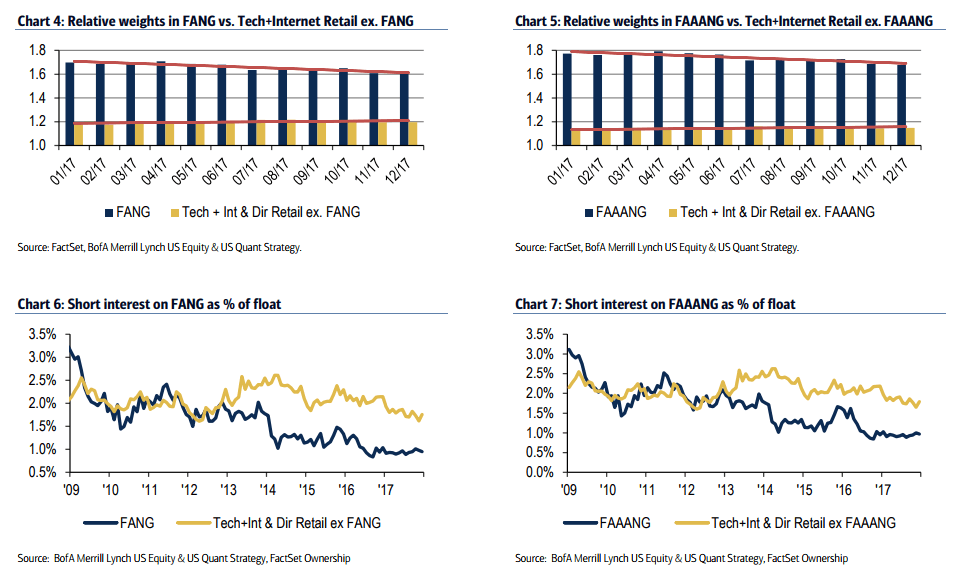
Interestingly, BoA’s report also notes during recent months funds the spread between “FANG vs. non-FANG stocks’ relative weights” has narrowed by 11 percentage points, which, the report goes on to speculate, could indicate the recent “move in FANG may be driven more by short-covering than by active buying.” Indeed, short interest on FANG/FAAANG stocks has come down to near record low levels of 1% of float over the past year.
Tech is not the only sector seeing active manager selling. BoA’s report notes managers have also been increasing their underweight in Staples and Utilities in favor of Telecom and Real Estate over the past three months — a mixed performance for these bond proxy sectors.
“Managers have now cut their exposure to Staples and Utilities for four straight months, resulting in record underweights for both sectors. In contrast, Telecom has the smallest underweight in nine months, while Real Estate’s remained roughly flat, following six straight months of increased relative weight.”
Further, cash levels at active funds fell by one percentage point during the period under review to a to a 21-month low of 1.1% in December. “Combined with the recent pick-up in cyclical exposure” BoA’s report opines, “this suggests that fund manager confidence is improving.”
Active Manager Holdings: A trading signal?
While these trends are interesting, they’re a useful guide of what not to do for investors. BoA’s own research shows over the last several years, buying active managers’ most underweight stocks and selling the most overweight shares has consistently generated alpha. That said, during 2017, the first year in a decade where almost 50% of active managers outperformed their benchmarks, this trend did not hold true. Still, the long-term findings hold true.
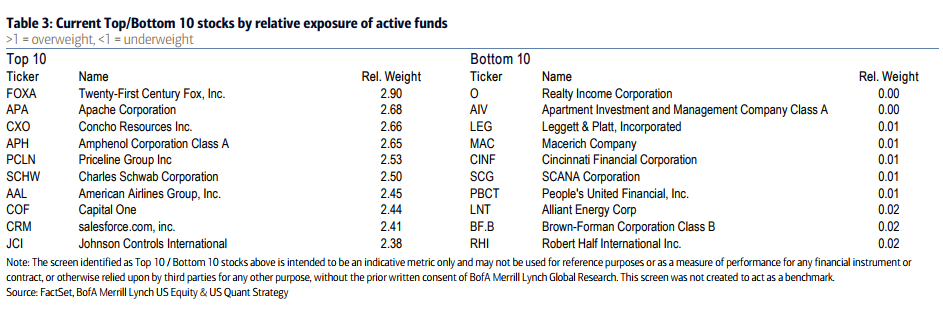
UBS’s Global Quantitative Equity research team regularly compile a list of the market’s most crowded stocks with the largest active positions.
Using data provided by FactSet, UBS builds a global equity portfolio compiling all the holdings in dollar value across all the global active managers. The analysts then calculate the weights of stocks in this active trading portfolio and compare it to the relevant equity index benchmark to form the active weight.
This takes into account not only US active funds but global funds as well to find the world’s most crowded active positions. Globally, the most overcrowded positions are:
“In MSCI AC World Index, top 5 overweighed stocks are: Vulcan Materials Company, Aflac Incorporated, Alibaba Group Holding Ltd. Sponsored ADR, Microsoft Corporation, and UnitedHealth Group Incorporated. Top 5 under-weights: Apple Inc., Exxon Mobil Corporation, Berkshire Hathaway Inc. Class B, Johnson & Johnson, and Toyota Motor Corp.”
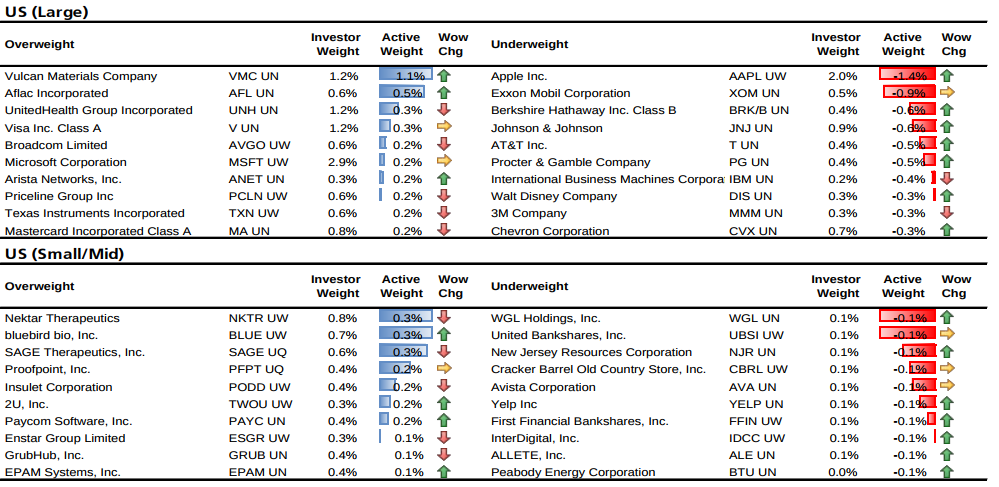
And in the US the five most overweight large-cap stocks are Vulcan Materials Company, Aflac Incorporated, UnitedHealth Group, Visa Inc. and Broadcom. The most overweight small/mid caps are Nektar Therapeutics, bluebird bio, Inc., Sage Therapeutics, Inc., Proofpoint, Inc. and Insulet Corporation.
The most underweight small/mid caps are WGL Holdings, United Bankshares, New Jersey Resources Corporation, Cracker Barrel Old Country Store and Avista Corporation.