With the year quickly coming to a close, it might be time to start thinking about rebalancing the gold holdings in your portfolio. That includes bullion, jewelry, gold stocks and well-managed gold funds—all of which I recommend giving a collective 10 percent weighting. Because it’s been such a strong year for stocks—they’ve advanced more than 20 percent as of today—it’s likely that most investors will need to add to their gold exposure to meet that 10 percent weighting as we head into 2018.

Some investors might wonder why they need gold in their portfolios right now. The stock market is still chugging along, and the just-passed tax reform bill is likely to help ratchet up share prices even more. Cryptocurrencies have been hogging the spotlight lately, especially after bitcoin tumbled nearly 30 percent on Friday morning.
While I’m on the subject, inflows into cryptocurrencies have totaled more than $500 billion this year alone. To put that in perspective, the total sum of global equity mutual fund and ETF inflows were around $411 billion as of November 29. What’s more, cryptocurrencies are now doing as much daily trading as the New York Stock Exchange (NYSE), according to Business Insider.
Just think on that. Something is happening here that cannot be ignored or dismissed.
But back to gold. It’s important to remember that the precious metal has historically shared a low-to-negative correlation with many traditional assets such as cash, Treasuries and stocks, both domestic and international. This makes it, I believe, an appealing diversifier in the event of a correction in the capital and forex markets.
Need more reasons to add to your gold holdings? Below are 10 charts that show why the yellow metal is undervalued right now:
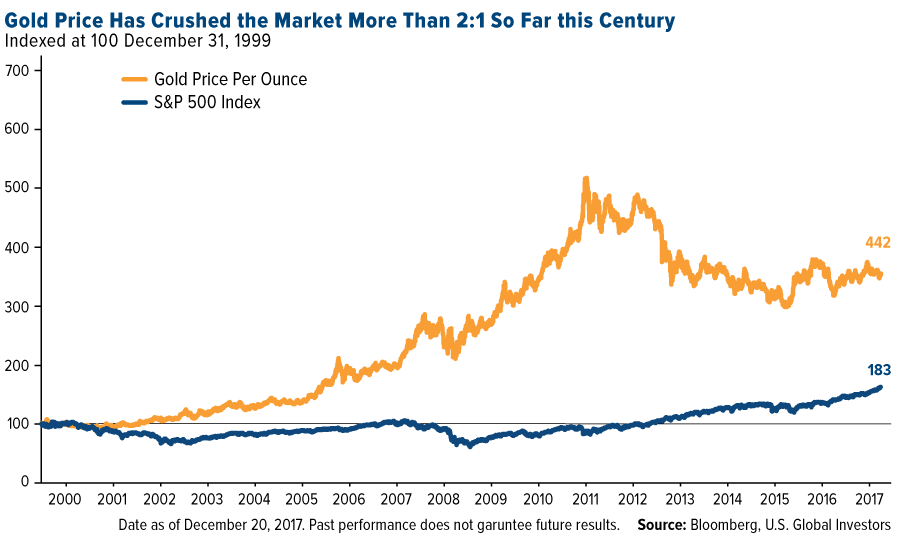
1. The gold price has crushed the market so far this century.
 click to enlarge
Investors are invariably surprised to see this chart whenever I show it at conferences. Believe it or not, since 2000, the gold price has beaten the S&P 500 Index, which has undergone two 40 percent corrections so far this century.
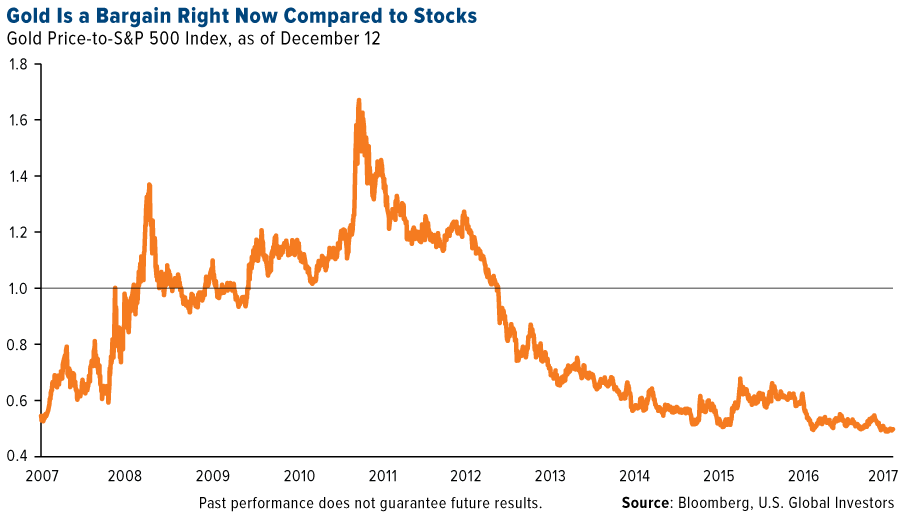
2. Compared to stocks, gold looks like a bargain.
 click to enlarge
As of this month, the gold-to-S&P 500 ratio is at its lowest point in 10 years. For mean reversion to occur, either the gold price needs to appreciate or share prices need to fall. Either way, consider this a once-in-a-decade opportunity.
3. Exploration budgets keep getting slashed.
 click to enlarge
One of the reasons why gold is so highly valued is for its scarcity. There’s a possibility it could get even scarcer as explorers continue to trim exploration budgets and uncover fewer and fewer large deposits. The time between initial discovery and day one of production is also expanding. This has led many experts in the field to wonder if we’ve finally reached “peak gold.”
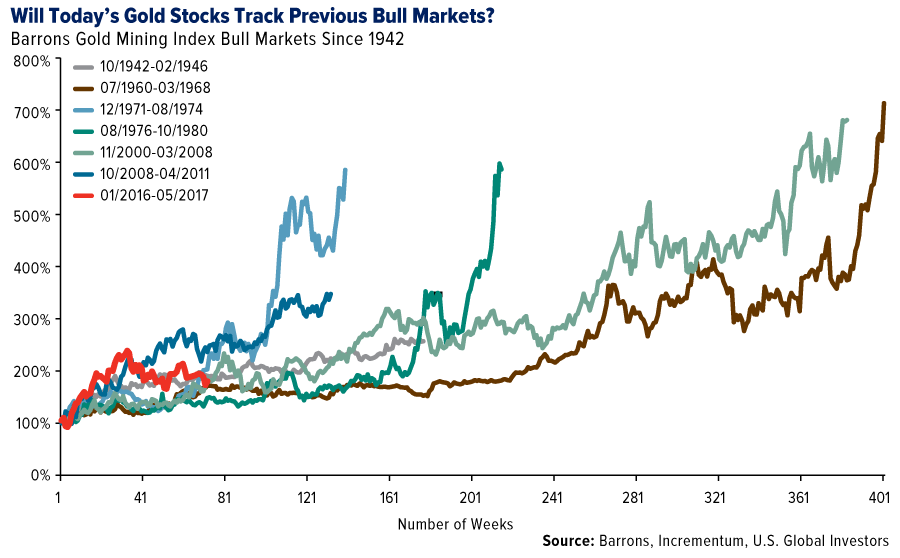
4. Gold stocks could be just getting started.
 click to enlarge
Last year marked a turnaround in gold prices and gold stocks, and according to analysts at Incrementum Capital Partners, a Swiss financial management firm, they’re just getting warmed up. When charted against past gold bull markets, the present one looks as if it still has a lot of room to run.
5. Is too much money going into equities?
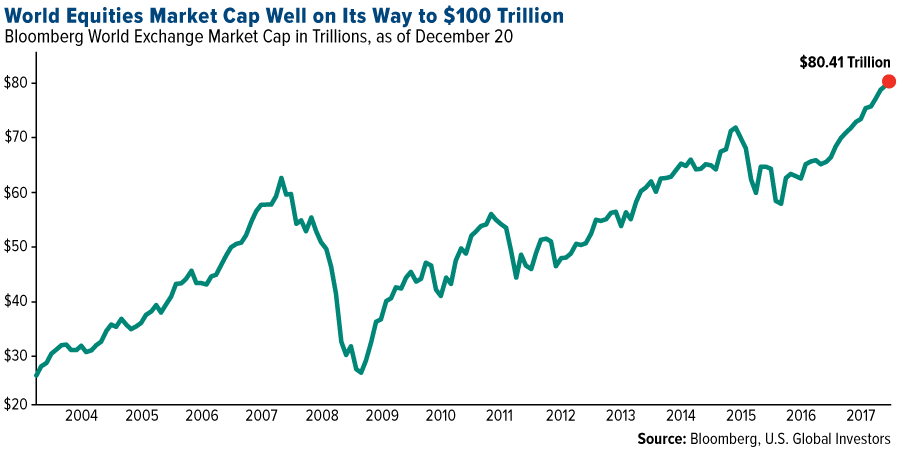 click to enlarge
More than $80 trillion sits in global equities right now, a monumental sum that’s likely to surge even more as we venture further into the bull market. Some worry this is a ticking time bomb just waiting to go off. Another correction similar to the one 10 years ago would wipe out trillions of dollars around the world, and it’s then that the investment case for gold would become strongest.
6. Higher debt could mean higher gold prices.
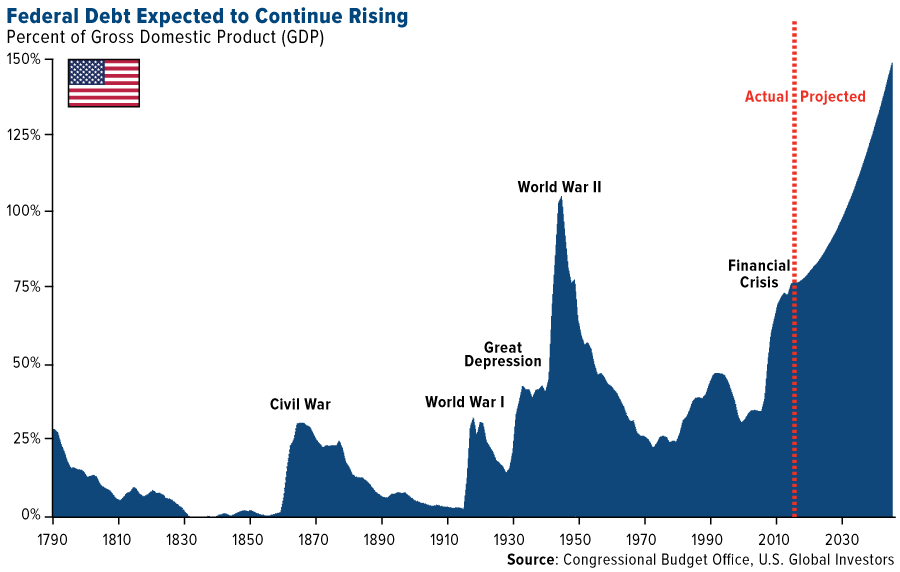 click to enlarge
The yellow metal has historically tracked global debt, which stood at $217 trillion as of the first quarter of this year. Looking just at the U.S., debt is expected to continue on an upward trend, driven not just by new, and largely unfunded, spending but also underlying interest. By most estimates, President Donald Trump’s historic tax cuts, although welcome, will contribute to even higher debt as a percent of gross domestic product (GDP).
7. The Fed’s about to take away the punch bowl.
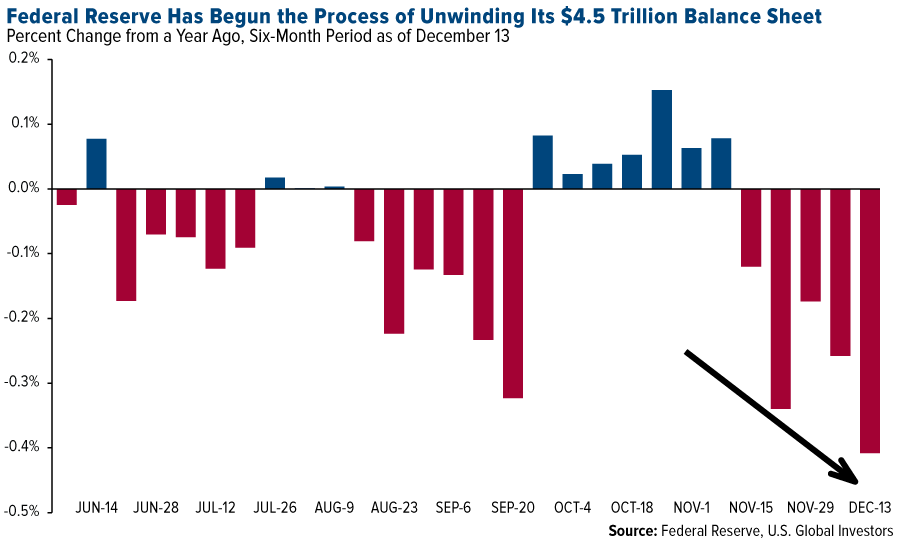 click to enlarge
“My opinion is that business cycles don’t just end accidentally. They end by the Fed. If the Fed tightens enough to induce a recession, that’s the end of the business cycle.” That’s according to MKM Partners’ chief economist Mike Darda, who was referring to the Federal Reserve’s efforts to unwind its $4.5 trillion balance sheet after it bought vast quantities of government bonds and mortgage-backed securities to mitigate the effects of the Great Recession. There’s definitely a huge amount of risk here: Five of the previous six times the Fed has similarly reduced its balance sheet, between 1921 and 2000, ended in recession.
8. Rate hike cycles have rarely ended well.
 click to enlarge
Rate hike cycles also have a mixed record. According to Incrementum research, only three such cycles in the past 100 years have not ended in a recession. Obviously there’s no guarantee that this particular round of tightening will have the same outcome, but if you recognize the risk here, it might be prudent to have as much as 10 percent of your wealth in gold bullion and gold stocks.
9. Trillions of dollars of global bonds are guaranteed to lose money right now.
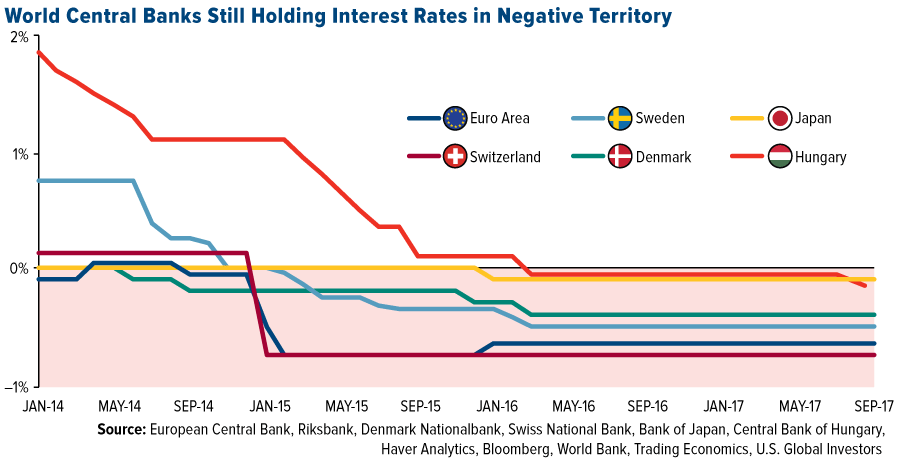 click to enlarge
As of May of this year, nearly $10 trillion of bonds around the world were guaranteed to cost investors money, as more and more central banks instituted negative interest rate policies (NIRPs) to spur consumer spending. Instead, it encouraged many savers to yank their cash out of banks and convert it into gold. That’s precisely what households in Germany did, and by 2016, the European country became the world’s biggest investor in the yellow metal.
10. The Love Trade is still driving gold demand.
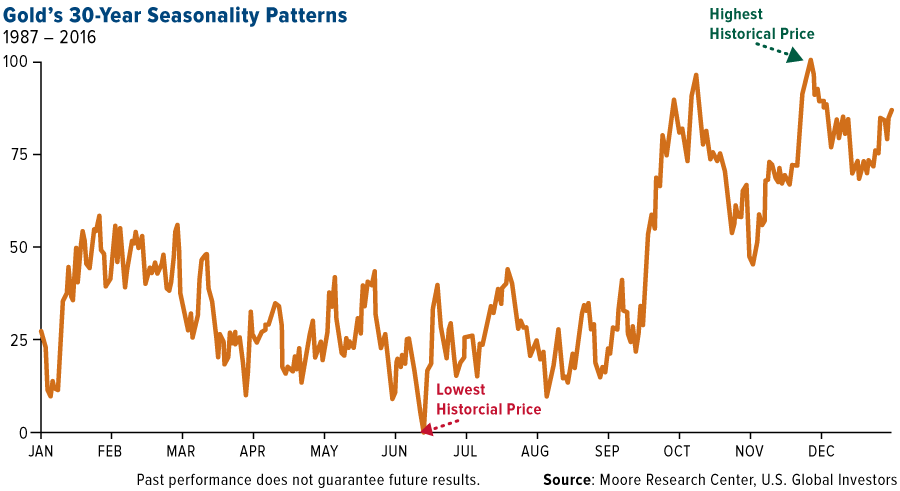 click to enlarge
The chart above, based on data provided by Moore Research, shows gold’s 30-year seasonal trading pattern. Although it’s changed over the past few years, the pattern reflects the Love Trade in practice. According to the data, the gold price rallies early in the year as we approach the Chinese New Year, then dips in the summer. After that it surges on massive gold-buying in India during Diwali, in late October and early November. Finally, it ends the year at its highest point during the Indian wedding season, when demand is high. The pattern isn’t always observed exactly how I described, but it happens frequently enough for us to make educated, informed decisions on when to trade the precious metal.
Interested in learning more about what drives the price of gold? Find out by clicking here!
Index Summary
- The major market indices finished up this week. The Dow Jones Industrial Average gained 0.42 percent. The S&P 500 Stock Index rose 0.29 percent, while the Nasdaq Composite climbed 0.34 percent. The Russell 2000 small capitalization index gained 0.83 percent this week.
- The Hang Seng Composite gained 2.64 percent this week; while Taiwan was up 0.44 percent and the KOSPI fell 1.67 percent.
- The 10-year Treasury bond yield rose 12 basis points to 2.48 percent.
Domestic Equity Market
Strengths
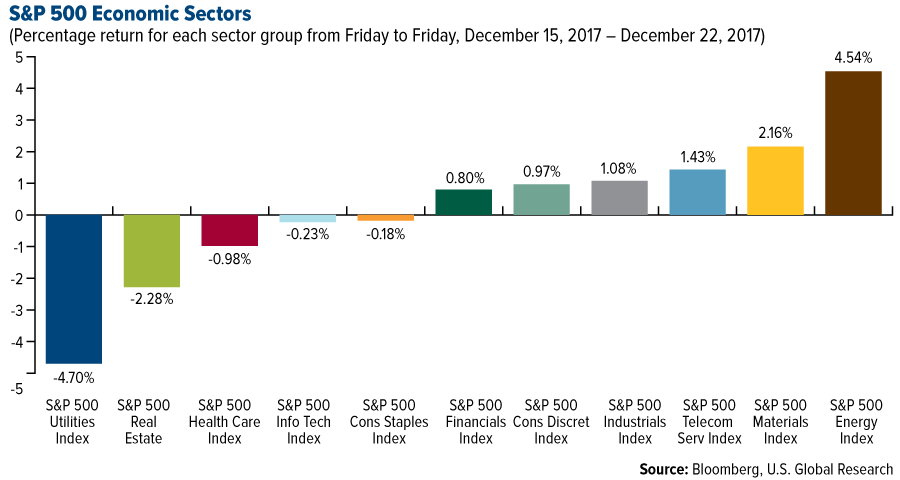
- Energy was the best performing sector of the week, increasing by 4.54 percent versus an overall increase of 0.28 percent for the S&P 500.
- Discovery Communications was the best performing stock for the week, increasing 13.77 percent.
- Global IPO activity has hit a post-financial crisis high. Ernst and Young's Global IPO Report found that 1,624 companies have gone public worldwide in 2017, making for a 49 percent increase versus the prior year and the highest total since 2007.
Weaknesses
- Utilities was the worst performing sector for the week, falling 0.65 percent versus an overall increase of 0.28 percent for the S&P 500.
- PG&E Corp was the worst performing stock for the week, falling 15.98 percent.
- Chipotle's latest health scare caught traders off-guard. The stock dropped Wednesday amid reports that another one of its stores could be tied to an illness outbreak, leaving traders unprepared as downside hedges sat at their lowest level in a decade.
Opportunities
- The tax reform bill is largely expected to provide a boost to stocks as a result of lower corporate tax rates and a tax repatriation holiday. Companies are rushing to announce special bonuses and pay hikes. AT&T, Boeing, Wells Fargo, and Comcast are among the companies that have announced plans to pay employees a special bonus, increase their minimum wage, or announce capital expenditures following the passage of the Tax Cuts and Jobs Act.
- According to Goldman Sachs, the companies that stand to benefit the most from the tax reform act are General Electric, Foot Locker, Citrix Systems, Western Digital, Waters Corp, Ralph Lauren, Microsoft, Oracle, Amgen, Apple, Qualcomm, NetApp and Cisco Systems.
- FedEx boosted its guidance. The company beat on both the top and bottom lines and raised its full-year fiscal 2018 earnings forecast to a range of $12.70 to $13.30 a share.
Threats
- Traders are increasing their bets that the stock market will encounter more turmoil. Investors are increasingly wagering on stock market volatility, according to a measure of options trading.
- Corporate borrowing drove global debt issuance to a record $6.8 trillion in 2017 and made up 55 percent of global debt issuance for the year.
- An analyst from Nomura downgraded Apple stock because of "historical patterns." According to the analyst, the company's stock has historically taken a hit following the launch of "tick" iPhone models, like the iPhone 5 and iPhone 6.
December 20, 2017Coming Housing Boom Could Mean It's Time to Add Raw Materials |
December 18, 20175 Big Questions for 2018 |
December 14, 2017Coinbase and the IRS: A Win for Both |
The Economy and Bond Market
Strengths
- Sales of new U.S. single-family homes unexpectedly rose in November, hitting their highest level in more than 10 years, driven by robust demand across the country. The Commerce Department reported new home sales jumped 17.5 percent to a seasonally adjusted annual rate of 733,000 units last month. That was the highest level since July 2007. Sales surged 26.6 percent from a year ago.
- U.S. consumer spending accelerated in November. The Commerce Department reported consumer spending, which accounts for more than two-thirds of U.S. economic activity, rose 0.6 percent last month after a downwardly revised 0.2 percent increase in October.
- Overall orders for durable goods rebounded 1.3 percent last month as demand for transportation equipment surged 4.2 percent. Durable goods orders had fallen 0.4 percent in October.
Weaknesses
- U.S. gross domestic product (GDP) was revised slightly lower on weaker consumer spending. GDP increased by 3.2 percent, down from the prior 3.3 percent estimate, as the growth of consumer spending was found to be weaker than initially reported.
- U.S. Treasuries extended a sell-off this week alongside major bond markets in Europe and Asia. Some investors are speculating that tax cuts could stoke economic growth and alter how the Federal Reserve approaches interest-rate increases. Furthermore, there’s concern that the Fed's reduction of its bond purchases would increase the market's supply. The 10-year yield has climbed to its highest level in nine months.
- The University of Michigan Sentiment Index fell to 95.9 from the previous print of 96.8 and disappointed expectations of an increase to 97.2.
Opportunities
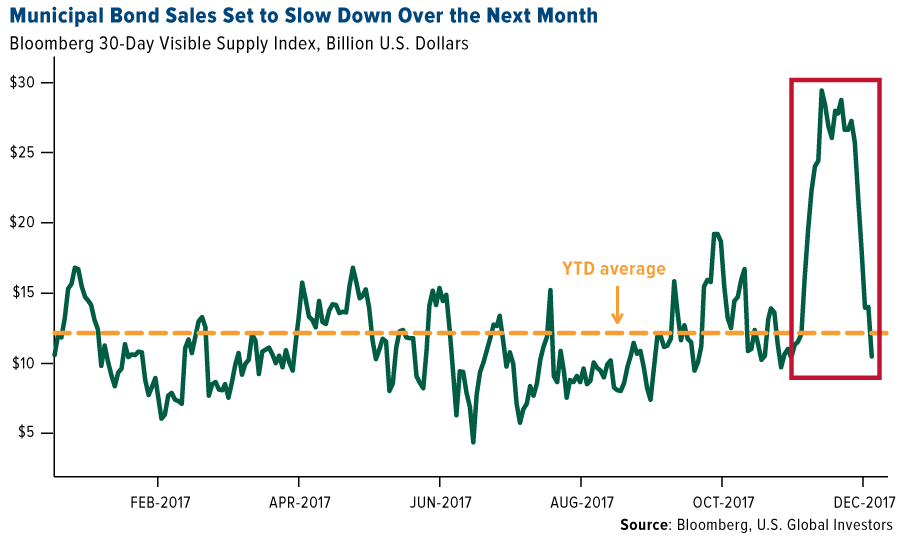
- The flood of new municipal-bond sales is receding after state and local governments raced to borrow before Congress could roll back subsidies. While $49 billion of securities have been sold so far this month, putting it on pace to potentially exceed the record of $54.7 billion set in December 1985, the volume of sales planned over the next 30 days slid to about $10.5 billion with Republicans’ tax-overhaul legislation locked up. Tighter supply could firm up the market.
- The largest tax overhaul since 1986 was signed into law today by President Donald J. Trump. The Tax Cuts and Jobs Act, which cleared both chambers of Congress on Wednesday, reduces the corporate tax rate to 21 percent from 35 percent and lowers the tax bill of most Americans.
- Municipal bond sales are expected to decline by about 20 percent in 2018, according to a survey by the Securities Industry and Financial Markets Association. Curtailed supply could help buoy prices amid a rising rate environment.
Threats
- Rich homeowners in blue states are among the biggest losers in the GOP tax bill as certain provisions are set to disproportionately affect homeowners in affluent parts of the U.S. The main changes affect the mortgage interest deduction and the SALT deduction.
- A Fed official who has been voting against rate hikes thinks he knows why wages aren't rising faster. Minneapolis Fed President Neel Kashkari worries the central bank's interest-rate hikes are actively contributing to a decline in U.S. inflation expectations that could make the Fed’s job harder in the next downturn. He also believes the job market is not as tight as the 4.1 percent unemployment rate suggests.
- A U.S. financial watchdog is warning investors about crypto “pump and dump” schemes. FINRA, the U.S. financial regulator, put out an alert on Thursday to warn investors.
Gold Market
This week spot gold closed at $1,274.55, up $19.10 per ounce, or 1.52 percent. Gold stocks, as measured by the NYSE Arca Gold Miners Index, ended the week higher by 4.61 percent. The S&P/TSX Venture Index came in up 0.95 percent. The U.S. Trade-Weighted Dollar reversed course this week and fell 0.66 percent.
| Date | Event | Survey | Actual | Prior |
|---|---|---|---|---|
| Dec-18 | Eurozone CPI Core YoY | 0.9% | 0.9% | 0.9% |
| Dec-19 | Housing Starts | 1250k | 1297k | 1256k |
| Dec-21 | GDP Annualized QoQ | 3.3% | 3.2% | 3.3% |
| Dec-21 | Initial Jobless Claims | 233k | 245k | 225k |
| Dec-22 | Durable Goods Orders | 2.0% | 1.3% | -0.8% |
| Dec-22 | New Homes Sales | 650k | 733k | 685k |
| Dec-27 | Conf. Board Consumer Confidence | 128.0 | -- | 129.5 |
| Dec-28 | Hong Kong Exports YoY | -- | -- | 6.7% |
| Dec-28 | Initial Jobless Claims | 240k | -- | 245k |
| Dec-29 | Germany CPI YoY | 1.5% | -- | 1.8% |
Strengths
- The best performing precious metal for the week was platinum, up 2.64 percent. For the second week in a row gold traders are bullish as the year comes to a close, according to Bloomberg’s survey of traders and analysts. Additionally, the yellow metal saw a second weekly advance as bond yields climb with slower trading around the holiday period. Prices are up 10 percent for the year in comparison to 8.1 percent in 2016.
- UBS strategist Joni Teves reports that gold is showing considerable resilience to the recent rise in U.S. real rates and more players view gold as a valid asset for diversification and a hedge against risk.
- Tibet Summit Resources and partner NextView Capital are set to purchase lithium producer Lithium X Energy for a premium price of $C265. This deal is one of many as Chinese companies are looking to secure raw materials for electric car batteries.
Weaknesses
- The worst performing precious metal for the week was gold, although up 1.52 percent. Gold is trading low compared to oil as expanding global economic growth increases fuel demand, reports Bloomberg. The world’s largest ETF backed by gold, SPDR Gold Shares, is seeing a fall in investors as it dropped to its lowest in three months with holders pulling around $1.14 billion in assets since the end of September.
- Platinum shorts reached an all-time high this week, further raising short-covering risks with net longs declining by 684.90koz, the largest weekly outflow on record. Both gold and silver positioning fell as well, reports UBS. Hedge funds are moving away from gold and into other equities as gold gains are far from the excitement of record-breaking U.S. equity indexes and cryptocurrencies. Joe Foster, who manages the VanEck International Investors Gold Fund says, “Nobody cares about gold right now.”>
- Torex Gold faces labor issues as they suspended their Mexican employment contracts as competing labor unions fight for control of the employees of Torex. In response their target price was lowered to C$14 from C$25 by Coremark, reports Bloomberg.
Opportunities
- Bad news for bitcoin this week after its price plunged almost 30 percent today, down from its record high of $19k. Adding to the frenzy, digital currency exchange Coinbase had temporarily suspended all buying and selling for several hours. Lastly, the newly passed tax overhaul removed the tax break for investors in virtual currencies. New limits in the bill bar cryptocurrency owners from deferring capital gain taxes when trading one type of virtual currency to another, reports Bloomberg. This closes a grey area in the tax code on digital currencies.
- Two Federal Reserve governors expressed their doubts on the tax cuts actually spurring new investments and hiring. While president Trump has said that the fiscal overhaul will lead to higher growth, Minneapolis Fed President Neel Kashkari, among others, does not believe this will happen and said, “Very few CEOs that I’ve talked to in my district say that the tax package is going to lead to some dramatic change in their behavior.” The Peterson Institute believes that the new post-tax cost of research and development of large corporations reduces the incentive to develop new products relative to spending money on other activities as research and development will have to be amortized versus expensed, lowering the incentive for research.
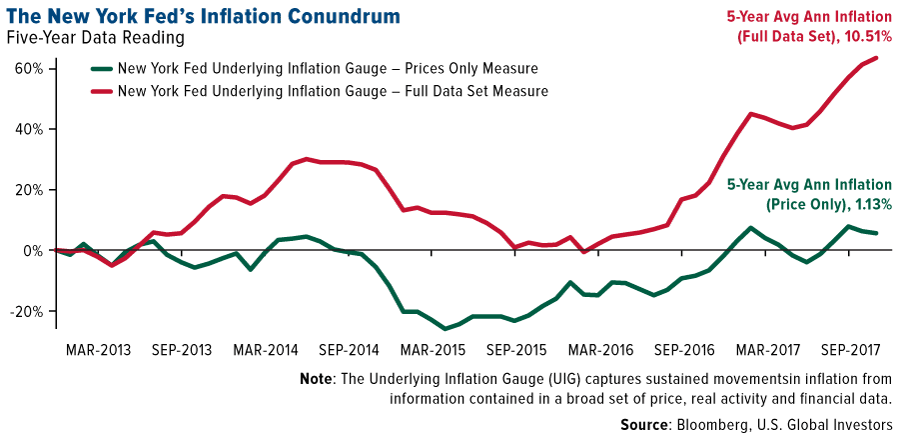
- Measuring inflation has its critics. Typically, policymakers have to rely on monthly data releases of the Consumer Price Index (CPI) and the Personal Consumption Expenditures (PCE). To try and measure core or underlying inflation, often times the most volatile components of inflation, like food and energy, are stripped from the data. New research published by the New York Fed Staff on their construction of an Underlying Inflation Gauge (UIG) is now getting some attention. Historically, inflation measures only relied on price measures. The UIG measure includes a wide range of nominal, real and financial variables in addition to prices, and focuses on the persistent common component of monthly inflation. The Fed Staff concluded that the UIG proved especially useful in detecting turning points in trend inflation and has shown higher forecast accuracy compared with core inflation measures. What is particularly interesting is that the Fed compiles two data series, UIG using just price data and UIG using the Full Data Set (FDS) they have researched. In the graph below we chart both series over the last five years and the results are eye popping. The UIG Index using just price data has compounded at an average annual rate of inflation of just 1.13 percent while the UIG Index using the Full Data Set has compounded at an average annual rate of inflation of 10.51 percent over the last five years. This could be a game changer as the UIG FDS has turned sharply up in recent years indicating a change in direction for inflation, and the government just added a stimulus package with meaningful shifts in the tax base.