
Regression analysis is used all the time to assess how a portfolio “loads” on certain factors. The most common factor loadings examined are the market, size, value, and momentum factors. This can be an informative exercise, and there are nice tools online, such as portfolio visualizer, which allow investors to examine factor loadings on funds. Note: We have an article (with an excel file), explaining factor regressions found here if you are interested in getting your hands dirty.

Sometimes we should take a step back and ask–what does this “small cap factor” beta mean?(1)
Without getting into the math, a positive Beta means that a fund/portfolio has a positive correlation with a specific factor. Most long-only equity funds have a market beta ~ 1, reflecting the fact they are long the market factor. However, many investors focus their attention on factor regressions and examine a particular fund’s loading on the size, value, and momentum factors. In this context, a positive SMB (size) loading should imply that the fund has a small-cap tilt. The same goes for HML (Value) and UMD/MOM (Momentum).
But what does a positive factor loading really mean?
Intuitively, funds that have positive loadings on various factors should have underlying characteristics that match the factor loadings. E.g., you have a positive SMB factor loading, you should actually own small caps. (see the factors versus characteristics debate here).
For example, IWN has a .82 SMB beta estimate on PortfolioVisualizer.com and VB has a .57 SMB beta estimate. So IWN has more small-cap factor exposure than VB. But what does it actually mean? Is IWN 44% more small-cap (.82/.57 -1) ? Unclear.
A more intuitive approach is to just look at the actual market cap distributions. See below (a chart from our free visual active share tool).
The chart above highlights explicitly how these funds are structured with respect to market-cap. No guessing games or weird interpretations via factor analysis.
But I digress. Let’s look at a paper that formally examines the challenges of interpreting small-cap “factor loadings.”
Below, we examine the results from a paper titled, “What Does ?SMBbeta_{SMB}>0 Really Mean?” by Hsiu-Lang Chen and Gilbert W. Bassett. A link to the paper can be found here.
We dig into their findings below.
Core Finding: Virtually All Portfolios Will Have Positive SMB
The authors first examine the sample size, or “N,” in the data. The SMB (Small minus Big) portfolio is formally constructed as follows:
SMB = 1/3 (Small Value + Small Neutral + Small Growth) – 1/3 (Large Value + Large Neutral + Large Growth)
The reason for splitting the universe into Value (i.e., cheap), Neutral, and Growth (i.e., expensive) is an attempt to minimize the Value factor (HML) that may be embedded in the SMB factor, by adding and subtracting Value, Neutral, and Growth portfolios. To split firms into S (Small) and B (Big), Fama and French in their 1993 paper, used the median NYSE market capitalization for size–the 50th percentile of market cap for NYSE firms. However, using the NYSE median is not necessarily the median for all firms in the CRSP database — NYSE stocks are a lot bigger!
The authors highlight how using an NYSE market cap cut affects results over time:

Source: What Does B_SMB > 0 Really Mean? by Chen and Bassett. Accessed 11/8/17 from https://papers.ssrn.com/sol3/papers.cfm?abstract_id=2658380
The top image plots the number of firms in the B (Big) portfolio in Blue and the S (Small) portfolio in pink. One notices that in the second half of the sample, after AMEX and NASDAQ stocks have been added to CRSP, there are more Small (S) stocks than Big (B) stocks. However, when examining these firms from a market-capitalization perspective (and not the number of firms), we see that the Small (S) portfolio only makes up around 8% of the total market capitalization of all stocks!
So given that everyone now knows how the portfolios are formed (there are more Small stocks, but they make up a smaller percentage of market cap), the authors next form long-only portfolios, by going long x% in Big (B) and (100 – x)% in Small (S). They then examine the 3-factor (MKT, SMB, HML) loadings of these various portfolios. Table 2 (below) shows three-factor attribution for portfolios based on different combinations of Small (S) and Big (B).
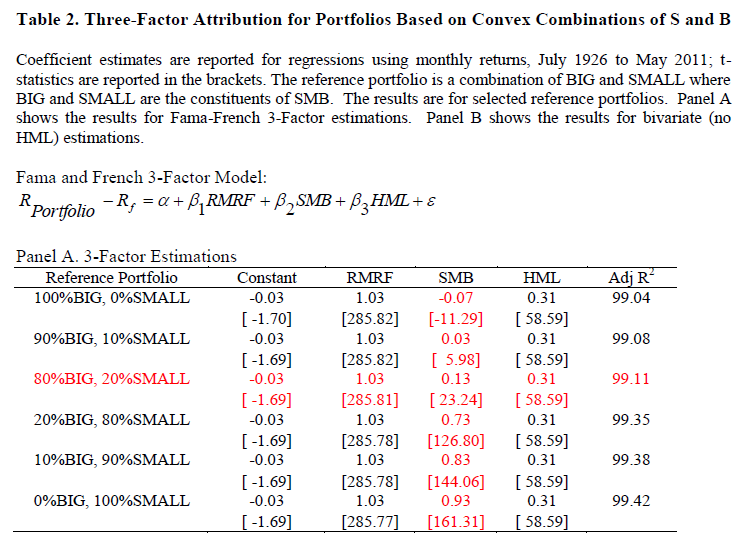
The results are hypothetical results and are NOT an indicator of future results and do NOT represent returns that any investor actually attained. Indexes are unmanaged, do not reflect management or trading fees, and one cannot invest directly in an index. Additional information regarding the construction of these results is available upon request.
The portfolio highlighted in red is “80%BIG, 20%SMALL“, which consists of 80% BIG (B) and 20% SMALL (S). This portfolio is obviously tilted toward large-cap stocks. However, the three-factor attribution still gives a positive and significant SMB coefficient (0.13)! In addition, except when S=0%, the SMB coefficients for all the reference portfolios remain positive. Even a 90% Big and 10% Small portfolio has a small (but positive) SMB loading.
So while a positive SMB means that the portfolio is tilting toward small-cap stocks, one needs to understand what this loading really means.(2)(3)
Figure 1 above highlights that ~92% of the market-cap is made up by the Big (B) portfolio. Table 2 highlights the -0.07 loading on the 100% Big portfolio, and the 0.93 loading on the 100% Small portfolio. The estimated cutoff for a portfolio to have a positive SMB loading simply requires the portfolio to have a 7% or higher weight on the Small portfolio, which is close to the 92% of the market-cap weight in Figure 1.(4)
So (on average) any portfolio with a small allocation (above 7%) to smaller stocks, can generate a positive SMB loading!(5)
We like this paper since it calls attention to the interpretation of factor attribution and the importance of characteristics-based portfolio analysis.
Factor analysis is insightful, but far from perfect and can be hard to interpret (more discussion on characteristics vs. factors is here).
What Does ?SMBbeta_{SMB}>0 Really Mean?
- Chen and Bassett
- A version of the paper can be found here.
- Want a summary of academic papers with alpha? Check out our Academic Research Recap Category.
Abstract:
A positive SMB coefficient in a Fama-French regression is often interpreted as signaling a portfolio weighted toward small-cap stocks. We present a portfolio with known very large size, which has a positive SMB coefficient for all periods. We emphasize that this is associated with the co-existence of both “M” ? the market ? and “SMB” ? the mimicking portfolio for size ? in the Fama-French three-factor model. We explain why the model can attribute small size to large-cap stocks and portfolios. The results highlight how coefficients should be interpreted when a self-financing portfolio is used for portfolio attribution.
- The views and opinions expressed herein are those of the author and do not necessarily reflect the views of Alpha Architect, its affiliates or its employees. Our full disclosures are available here. Definitions of common statistics used in our analysis are available here (towards the bottom).
- Join thousands of other readers and subscribe to our blog.
- This site provides NO information on our value ETFs or our momentum ETFs. Please refer to this site.
References
- Formally, Beta is a regression coefficient, here is a link explaining simple linear regressions and here is a post that teaches you how to calculate beta in excel.
- Fama and French (1993 and 1996) show that only the largest quintile size portfolio has a negative factor loading on SMB.
- The authors cite the example of a 2011 paper by Elton et al., which states, “When we examine the small-minus-big factor, we see that the average beta is 0.1628, demonstrating a general tendency for funds to hold small stocks. However, over 25% of our funds have a negative beta with the size factor, which indicates that they are overweight large stocks.”
- Also mathematically shown in the paper5.?There are other ways to have a positive SMB loadings as well
Article by Jack Vogel, Ph.D. - Alpha Architect


