
Written by Chain Reaction Research and authored by Milena Levicharova, Profundo; Tim Steinweg, Aidenvironment; and Gabriel Thoumi, CFA, FRM, Climate Advisers, this report analyzes the financial risks for the 10 largest Indonesian listed palm oil companies. The report builds upon the outcomes of the Chain Reaction Research report 2016 Sustainability Benchmark: Indonesian Palm Oil Growers, published in December 2016. It adds a financial risk assessment of each company’s revenues calculating revenue at risk in consideration of its No Deforestation, No Peat, No Exploitation (NDPE) compliance. Analysis shows that an improved sustainability performance might lead to better share price returns and lower valuation risks versus a non-NDPE compliant peer.

Key Findings
- Companies with higher sustainability scores, such as Sinar Mas Agro Resources and Technology, Astra Agro Lestari and Dharma Satya Nusantara, generally have a more diversified buyer base but have a weak total return performance over the last two years of -12 percent in USD vs. Jakarta Stock Exchange Agricultural Index (JAKAGRI or JKAGRI depending on data source) -14 percent return over the same period.
- As shown in Figure 1 (below), companies with higher sustainability scores appear to have lower revenue at risk. Average valuation is lower and the net debt/EBITDA ratio is safer. These companies may face less volatile revenue movements because their supply chains are more NDPE-compliant. Further, any revenue impacts they may experience could have a below-average impact on profits due to increased cost structure flexibility. Thus, lower valuation plus lower risk, may signal higher upside potential, i.e. better returns than for the companies with lower sustainability scores.
- Companies with lower sustainability scores appear to have mixed financial performance. Tunas Baru Lampung and Sampoerna Agro showed above-average share price performances compared to the JAKAGRI with a stable buyer-base. They however experienced mixed impact on profits due to revenue impacts and NDPE. Other companies with low scores performed poorly like Bakrie Sumatera Plantations, Eagle High Plantations and Sawit Sumbermas Sarana. The last two were confronted with major loss of customers due to NDPE non-compliance. The average USD total return of the group was -17 percent.
- As shown in Figure 1 (below), companies with lower sustainability scores appear to exhibit higher quarterly revenue at risk. The potential impact from this risk on net profits is unclear. Considering that these equities may be valued at a premium (higher PE ratios), while also having higher net debt/EBITDA ratios, the companies may be facing a valuation risk if the market continues to pursue NDPE-compliance.
| August 8, 2017 | Total stock return July 2017 to August 2017 | Revenue-at-risk | Potential net profit impact | P/E 17 (X) | EV/EBITDA 17 (X) |
| High sustainability score | -12% | 33% | Below average | 12.7 | 8.2 |
| Low sustainability score | -17% | 46% | Mixed | 14.1 | 12.7 |
Figure 1: Sector rankings. Source: Profundo, Bloomberg. High score group: Sinar Mas Agro Resources and Technology, Astra Agro, Salim Ivomas Pratama, Dharma Satya Nusantara, Austindo Nusantara. Low score group: Sampoerna Agro, Eagle High Plantations, Sawit Sumbermas Sarana, Tunas Baru, Bakrie Sumatera Plantations; equity total return in USD.
Introduction
Since 2013, palm oil growers in Indonesia have begun to make No Deforestation, No Peat, No Exploitation (NDPE) commitments. During the same period, many palm oil buyers have also made NDPE commitments, resulting in incenting growers to transparently execute upon their NDPE commitments. As a result, some companies in the Indonesian palm oil sector are moving towards zero-deforestation supply chains that prohibit clearing carbon sinks such as peatlands and primary forest. This prevents releasing carbon pollution into the atmosphere. Some companies are also making material labor commitments. NDPE compliance means that these companies adhere to the such commitments in practice, even without having a formal NDPE policy.
Some companies have adjusted quickly to NDPE-compliant supply chains. At the same time, non-NDPE compliant firms have exhibited negative financial impacts. In June 2017, Sawit Sumbermas Sarana lost eight percent of its Q1 2017 revenue when Unilever publicly stated it would cease purchasing from SSMS. This may result in further revenue loss, decrease in profit margins and shareholder value loss.
This report analyzes the financial risks for the ten largest Indonesian publicly-listed palm oil companies by market capitalization. It builds on the Chain Reaction Research report 2016 Sustainability Benchmark: Indonesian Palm Oil Growers and adds financial risk assessment of the revenues for each company. Further, the report analyses whether an improved sustainability performance, namely adoption of NDPE policies, has had an impact on the share price performance and whether the current valuation still contains risks.
Each company’s quarterly revenues, customer base, profitability margins, and liquidity ratios over the last eight quarters were also analyzed. Material changes in these metrics linked to NDPE-compliance were traced. Each company’s share price was compared to the Jakarta Stock Exchange Agricultural Index (JAKAGRI).
Subsequently, this report applies a Monte Carlo simulation technique to determine the quarterly revenue at risk for each of the palm oil companies. Note that in the event of non-NDPE compliance, any grower has a risk of losing revenue to growers that are NDPE-compliant.
The scenarios differ for each company, depending on the degree of the diversification of the company’s customers, the existence of buyers responsible for more than 10 percent of revenue on quarterly basis, and the flexibility of the grower to quickly replace lost buyers. Companies who have a more diversified client base likely exhibit lower risk, as they are not contingent on one or two single large buyers. After running 1,000 iterations, the Monte Carlo analysis presents a 5 percent probability of revenue at risk (see the Appendix for methodology).
Finally, based on the results from these Monte Carlo simulations, the analysis continues net profit impact with future equity price forecasts. This analysis enables investors to distinguish Indonesian palm oil growers for compliance with NDPE policies, their sustainability scores, and potential valuation and revenue impacts.
Main Benchmark Findings and Conclusions
Figure 2 (below) shows each company’s sustainability score and various financial metrics. The scoring rubric includes each company’s dependence on one to two large buyers, whether they lost a material buyer greater than 10 percent of sales, and these actions’ potential financial impacts. It also includes the share price development of the last two-year period to enable a broader conclusion on shareholders’ value creation versus sustainability performance.
| CRR sustainability score | 1 to 2 large buyers | Material change in buyer base | Impact margin | Direct share price impact | Total return 1/7/15-8/8/17 | |
| Astra Agro Lestari | 8 | No | No | No | (30%) | |
| Austindo Nusantara Jaya | 6 | Yes | Yes | Yes | Unkn | 33% |
| Bakrie Sumatera Plantations | 5 | No | No | Yes | No | (66%) |
| Dharma Satya Nusantara | 7 | Mid | No | No | Yes | (26%) |
| Eagle High Plantations | 4 | Yes | Yes | Yes | Yes | (48%) |
| Salim Ivomas Pratama | 6 | No | No | No | Yes | (14%) |
| Sampoerna Agro | 4 | Yes | No | Yes | No | 20% |
| Sawit Sumbermas Sarana | 2 | Mid | Yes | No | Yes | (23%) |
| Sinar Mas Agro Resources and Technology | 10 | No | No | Yes | Yes | (21%) |
| Tunas Baru Lampung | 0 | Mid | No | No | No | 193%* |
| Average | 5.2 | 2% | ||||
| Average excluding high and low | (14%) | |||||
| JAKAGRI | (14%) |
Figure 2: Benchmark findings. Source: Profundo, Chain Reaction Research, Bloomberg; total return stocks in USD; * this is largely related to the company’s starting a new sugar mill.
Summary
- The companies with a high sustainability score such as Sinar Mas Agro Resources and Technology, Astra Agro Lestari and Dharma Satya Nusantara have a diversified buyer base but end up but a weak total return performance over the last two years. They have clearly not been rewarded for their changes. Austindo Nusantara Jaya and Salim Ivomas Pratama have a score above average, and they have performed better than average. The average total return of the top five in the sustainability score was -12 percent in USD, above the -14 percent of the JAKAGRI.
- The companies with a below-average sustainability score show a mixed performance. Tunas Baru Lampung and Sampoerna Agro showed above-average share price performances with stable buyer-base and mixed impacts on profitability. Other lower sustainability scoring companies performed weak, like Bakrie Sumatera Plantations, Eagle High Plantations and Sawit Sumbermas Sarana, of which the last two were confronted with major loss of customers. The average total return of this small group excluding the two extreme ones was -17 percent.
- The companies with a high sustainability score tend to have substantially lower revenue-at-risk percentages. Their valuation multiples are lower and also their net debt/EBITDA ratios are lower. As these companies should be less hurt by volatile revenue movements in the future following increasing NDPE compliance in the chain, the potential impact on profits is below average. In total, the current lower valuation multiples offer probably better returns than the group with a low sustainability score.
- The companies with a low sustainability score, exhibit higher revenue-at-risk percentages. These companies net profit results are mixed. Taking into account that these stocks have a higher valuation and higher net debt/EBITDA ratios, there are higher valuation risks if these companies face pressure regarding NDPE compliance.
- In Figure 3 (below), as the next step, the table compares the upcoming risks and opportunities for shareholders related to the revenue-at-risk, net profit impact, net debt/EBITDA and the current valuation.
| August 8, 2017 | CRR S. score | Revenue-at-risk | Potential net profit impact | P/E 17 (X) | EV/EBITDA 17 (X) | Net debt / EBITDA (X) |
| Astra Agro Lestari | 8 | <31% | Low | 13.8 | 8.1 | 0.9 |
| Austindo Nusantara Jaya | 6 | 44% | High | NA | 9.2 | 1.5 |
| Bakrie Sumatera Plantations | 5 | 26% | High | NA | 23.3 | 35.3 |
| Dharma Satya Nusantara | 7 | 37% | Mid | 13.3 | 9.6 | 4.3 |
| Eagle High Plantations | 4 | 42% | High | NA | 14.0 | 7.1 |
| Salim Ivomas Pratama | 6 | <22% | Low | 10.9 | 5.4 | 3.1 |
| Sampoerna Agro | 4 | 53% | Low | 13.0 | 7.1 | 3.8 |
| Sawit Sumbermas Sarana | 2 | 58% | Low | 21.1 | 12.0 | 2.5 |
| Sinar Mas Agro Resources and Technology | 10 | <32% | Mid | 12.6 | 8.9 | 4.2 |
| Tunas Baru Lampung | 0 | <51% | Low | 8.1 | 7.1 | 2.9 |
| Average | 5.2 | 13.3 | 10.5 | 6.6 | ||
| Average excluding high and low | 9.0 | 3.4 | ||||
| High sustainability score group | 33% | 12.7 | 8.2 | 2.8 | ||
| Low sustainability score group | 46% | 14.1 | 12.7 | 10.3 |
Figure 3: Benchmark scoring risks and opportunities. Source: Profundo, Chain Reaction Research, Bloomberg.
Astra Agro Lestari (AALI:IJ)
- In Chain Reaction Research’s 2016 Sustainability Benchmark: Indonesian Palm Oil Growers, AALI scored 8 out of 12 points.
- AALI has a moratorium on land conversion and a NDPE policy since September 2015. But it lacks visible progress on its goals, supply chain transparency or supplier compliance.
- 2016: 70 percent of its revenue was sourced from NDPE-compliant buyers, which means either AALI achieves these objectives or risks losing revenue.
- 2017: AALI has a 31 percent quarterly revenue at risk at a 5 percent probability, if the company does not diversify its buyer base and does not meet buyers’ NDPE policies. Due to its high average net margin vs. peers, the impact on AALI profits is limited.
AALI is an oil palm plantation company focused on the production of palm oil. As shown in Figure 4 (below), AALI is dependent on the subsidiaries of the KLK/Astra joint venture. Since KLK/Astra is a related party of AALI, the likelihood of losing Astra/KLK as a significant buyer is small. A large part of AALIs quarterly revenue is sourced from unidentified buyers, indicating a diversified buyer base that consists of buyers each accounting for less than 10 percent of the quarterly revenue.
Focusing on NDPE policy, Wilmar can be classified as a sustainable company. The loss of Wilmar as a significant buyer less than 10 percent means AALI might be (partly) replacing Wilmar with another company. Which company, and how this company classifies on NDPE criteria, remains unknown due to a lack of transparency on clients that account for less than 10 percent of the quarterly revenue (i.e. Wilmar may have continued purchasing 9 percent of the revenue, but AALI does not disclose this).

Figure 4: AALIs revenue, main buyers, and CPO price
Figure 5 (below) shows AALIs margins reached their peak levels in Q4 2016 and Q1 2017. The company’s reported revenue in these two quarters was higher compared to the previous six quarters. Its profit margins were at their lowest levels in Q3 2015, which may be related to global CPO prices decreases at this time.
Figure 5: AALIs profitability margins and liquidity ratios
Figure 6 (below) shows AALIs equity price movement compared to the JAKAGRI, indicating that there was no noticeable effect of a change in the buyer base on the stock price.
Figure 6: AALI vs. JAKAGRI
AALI Monte Carlo Simulation
There exists a 5 percent probability that AALI realizes revenue losses of more than USD 82 million (IDR 1,100 billion), or 31 percent of its expected (see Appendix for definitions) quarterly revenue. A substantial portion of AALIs revenue is sourced from one buyer, increasing its risk of losing a major revenue source. Figure 7 (below) shows AALIs Monte Carlo simulation revenue distribution, illustrating the probability and impact of AALI falling below its USD 267 million (IDR 3,540 billion) quarterly revenue threshold. The graph presents a summary of 1,000 iterations, ranging from worst case to best case. The analysis shows that AALI has a 5 percent probability of ending up with quarterly revenue result at or below USD 183 million (IDR 2,440 billion).
The KLK/Astra joint venture is related company to AALI and therefore less likely to cease purchases from AALI. Hence, the expected probability of AALI losing over 30 percent of its expected quarterly revenue is likely less than 5 percent. AALI has a high net profit margin vs. its peers based on its low operating leverage, the impact on net profits and EPS from a revenue change is limited.
Figure 7: AALI has 31 percent revenue at risk
Austindo Nusantara Jaya (ANJT:IJ)
- In Chain Reaction Research’s 2016 Sustainability Benchmark: Indonesian Palm Oil Growers, ANJT scored 6 out of 12 points.
- ANJT lacks a public NDPE policy. It does not apply the High Carbon Stock approach. Has historically cleared forests but has currently stopped forest clearing and is publicly committed to High Conservation Value forest management.
- 2016: 40 percent of ANJTs customers were NDPE-compliant buyers, but ANJT has historically violated these buyers’ NDPE policies. Thus, ANJT experienced lost buyers.
- 2017 revenue analysis suggests that greater than 44 percent of ANJTs quarterly revenue is at risk at a 5 percent probability if ANJT does not diversify its buyer base and meet its buyers’ NDPE policies. ANJT has a volatile net profit margin vs. peers.
ANJT is a food and renewable energy company. ANJTs main lines of business are palm oil and sago palm production and processing, and geothermal and biogas power generation. As shown in Figure 8 (below), ANJT had a high buyer turnover in 2015: Asian Agri/Apical, Golden Agri-Resources (GAR), HSA Group and Musim Mas all stopped purchasing from ANJT. All were significant customers at greater than 10 percent revenue. Wilmar, GAR and Musim Mas stopped buying from ANJT because ANJT did was not NDPE-compliant. Accordingly, ANJTs revenue dropped in Q4 2015 and Q1 2016 Q1. The Chain Reaction Research report Palm Oil Revenue at Risk: Failure to Meet Buyers’ Procurement Policies Results in Lost Revenue describes this situation in-depth. Some of ANJTs lost sales then came from selling to FELDA IFFCO/Tabung Haji, Astra/KLK and KLK.
The joint venture FELDA IFFCO/Tabung Haji, which replaced some of ANJTs lost NDPE-compliant sales since Q4 2015, is non-NDPE compliant. This move towards a less NDPE-compliant customer base is an example of leakage, as it reduces the demand for crude sustainable palm oil (CSPO).

Figure 8: ANJTs revenue, main buyers, and CPO price
When ANJT faced customers’ reaction to its lagging sustainability performance and NDPE incompliance, this also impacted negatively its financial performance. As can be seen in Figure 9, operating and net profit margin, as well as ROE turned negative, lagging far behind ANJTs own historical averages. The liquidity position of the company (reading from the current and quick ratios) was also negatively impacted. This may have contributed to some cost increase, e.g. extra storage costs for unsold inventory. While ANJTs comeback in the second half of 2016 is positive, its profit volatility is not reassuring from an investment perspective. This, and lagging sustainability practices, positions the producer farther away from the industry leaders.

Figure 9: ANJTs profitability margins and liquidity ratios
ANJT Monte Carlo Simulation
Apart from the historical scenario of ANJT losing key buyers, there also exists additional 5 percent probability that the company realizes further revenue losses of more than USD 19 million (IDR 250 billion) or greater than 44 percent of its expected quarterly revenue, if it does not meet NDPE requirements. The reason is that half of ANJTs revenue is from two buyers, increasing its risk of losing a major revenue source. Figure 10 (below) shows ANJTs Monte Carlo simulation revenue distribution illustrating the probability and impact of ANJT falling below its expected USD 41 million (IDR 545 billion) quarterly revenue threshold. The graph presents a summary of 1,000 iterations, ranging from worst case to best case. The analysis shows that ANJT has a 5 percent probability of ending up with quarterly revenue result at or below USD 15 million (IDR 295 billion). In that case, ANJT might have difficulties maintaining positive margins.
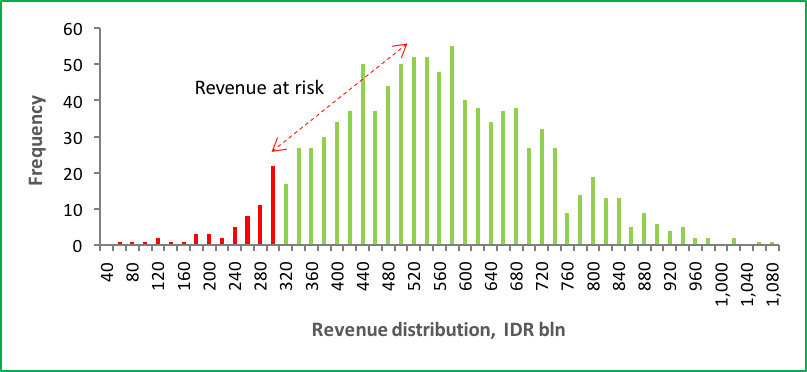
Figure 10: ANJT has 44 percent revenue at risk
Bakrie Sumatera Plantations (UNSP:IJ)
- In Chain Reaction Research’s 2016 Sustainability Benchmark: Indonesian Palm Oil Growers, UNSP scored 5 out of 12 points.
- UNSP lacks a public NDPE policy, but there appear to have been no recent practices of deforestation or peat clearance.
- 2017 revenue analysis suggests greater than 26 percent quarterly revenue at risk at a 5 percent probability if UNSP does not diversify its buyer base and meet its buyers’ NDPE-compliant policies. UNSP has weak net profit margins vs. peers and with its relatively low revenue at risk its net profit margin may still be relatively impacted.
UNSP engages in the plantation, processing, and trading of agricultural and industrial products. The company is active in the palm oil, rubber, and oleochemical markets. As shown in Figure 11 (below), UNSP is dependent upon two NDPE- compliant buyers: Wilmar and Musim Mas. Wilmar is UNSPs largest buyer. Also, in Q1 2016, when Musim Mas was not a significant buyer at greater than 10 percent of revenue, UNSPs quarterly revenue dropped. However, over the last eight quarters UNSP has sold to unidentified buyers, indicating it has a diversified buyer base with buyers that each account for less than 10 percent of its quarterly revenue. Of note, UNSP has not transparently submitted its New Planting Proposals to the RSPO.
Both Musim Mas and Wilmar are NDPE-compliant buyers. The loss of one of these buyers would potentially lead to a replacement by a non-NDPE compliant buyer. Figure 11 (below) shows a shift in the revenue source to more unidentified companies when these two buyers are not buying or are buying less.
Figure 11: UNSPs revenue, main buyers, and CPO price
Figure 12 (below) shows UNSPs profitability margins and liquidity ratios. In most quarters UNSP experienced negative profit margins and low liquidity ratios. This indicates that the company is facing significant financial challenges.
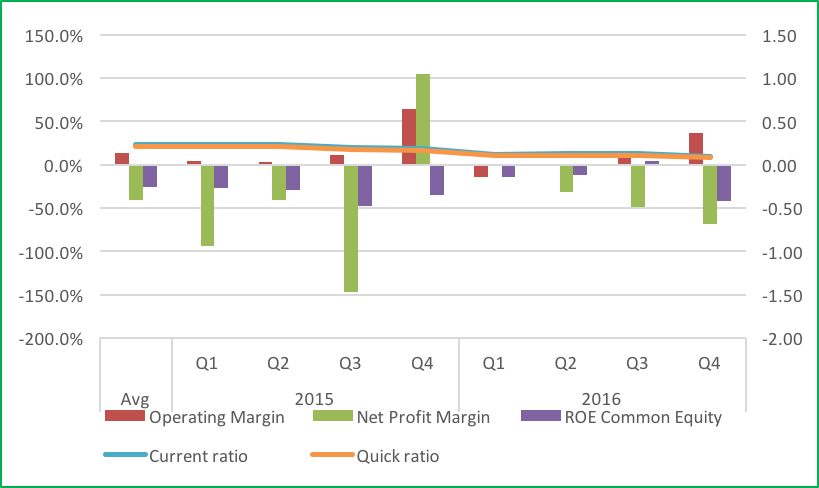
Figure 12: UNSPs margins
UNSP Monte Carlo Simulation
There exists a 5 percent probability that UNSP realizes revenue losses of more than USD 8 million (IDR 115 billion), or 26 percent of its expected quarterly revenue. In most quarters, half of UNSP’s revenue is from only one or two buyers, increasing its risk of losing a major revenue source. Figure 13 (below) shows UNSPs Monte Carlo simulation revenue distribution illustrating the probability and impact of UNSP falling below its expected USD 33 million (IDR 440 billion) quarterly revenue threshold. The graph presents a summary of 1,000 iterations, ranging from worst case to best case. The analysis shows that UNSP has a 5 percent probability of ending up with quarterly revenue result at or below USD 24 million (IDR 320 billion). The potential 26 percent revenue loss is small when compared with its peers. This is because steady unidentified buyer base from which revenue has been sourced over the last eight quarters. This indicates a diversified buyer base.
Figure 13: UNSP has 26 percent revenue at risk
Dharma Satya Nusantara (DSNG:IJ)
- In Chain Reaction Research’s 2016 Sustainability Benchmark: Indonesian Palm Oil Growers, DSNG scored 7 out of 12 points.
- DSNG lacks a NDPE policy, but since 2015 it has strengthened some policies and slowed down its operations in contested areas.
- 2015 and 2016: DSNG was heavily dependent on two buyers.
- 2017: Monte Carlo model forecasts 37 percent quarterly revenue at risk at a 5 percent probability if DSNG does not diversify its buyer base. Net profit impact from revenue loss is in line with its peers.
DNSG operates in the palm oil and wood product industries. Its palm oil business consists of both plantations and palm oil mills. As shown in Figure 14 (below), DSNG is dependent upon two buyers: Golden Agri-Resources (GAR) and Wilmar. Shifts in the quarterly revenues are mainly caused by fluctuations in the amounts bought by each of these two buyers. These two buyers are more important than DNSGs unidentified buyers, indicating that the buyer base of DNSG could benefit from more diversification.
Both GAR and Wilmar are NDPE-compliant buyers. The key risk is whether growers selling to these firms are themselves NDPE-compliant growers. If these two buyers decide to buy less palm oil, DSNG is likely to sell more palm oil to unidentified buyers to make up for the loss in revenue. These unidentified buyers could include non-NDPE compliant buyers. Due to a lack of transparency, it is not possible to identify DSNGs buyers accounting for less than 10 percent of the total quarterly revenue.
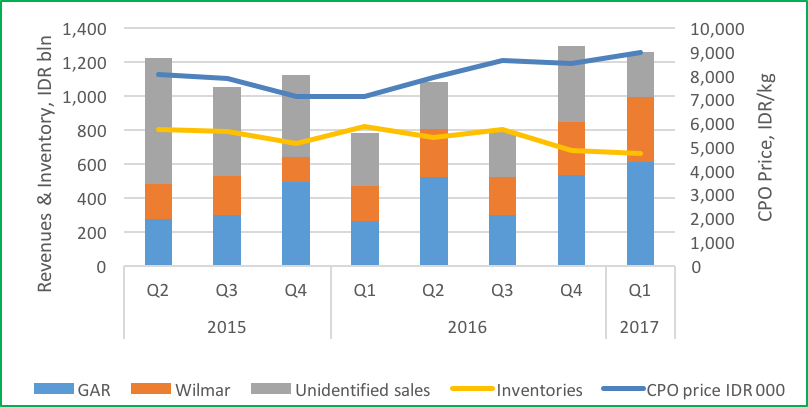
Figure 14: DSNGs revenue, main buyers, and CPO price
Figure 15 (below) shows DSNGs profitability margins and liquidity ratios. In the first three quarters of 2016, its profitability margins were below average. This corresponds with low quarterly revenues in Q1 and Q3 2016. Its liquidity ratios were stable in 2015 and dropped in Q4 2016 Q4 and Q1 2017.
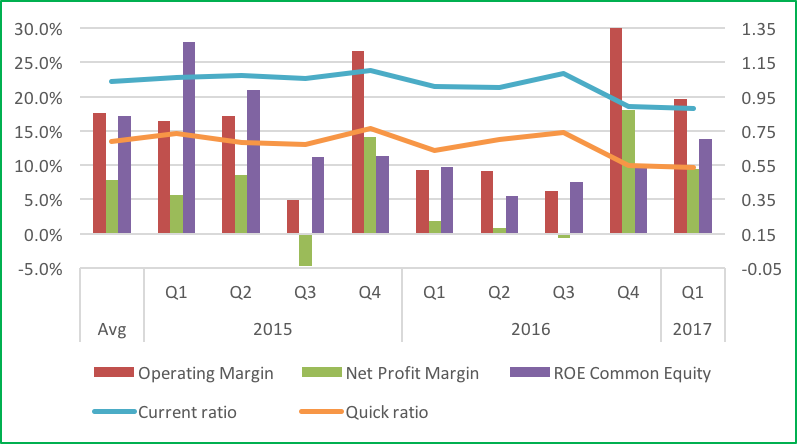
Figure 15: DSNGs profitability margins and liquidity ratios
Figure 16 (below) compares DNSG equity price with the JAKAGRI. DNSGs share price, as shown by the arrow, did not trade in line with JAKAGRI in Q1 2016 (indicated by arrow). This can be related to revenue drop in 2016 Q1, when GAR bought relatively little from DSNG (see Figure 12). This shows that shareholders can be directly affected when a significant buyer decides to buy less or stop buying.
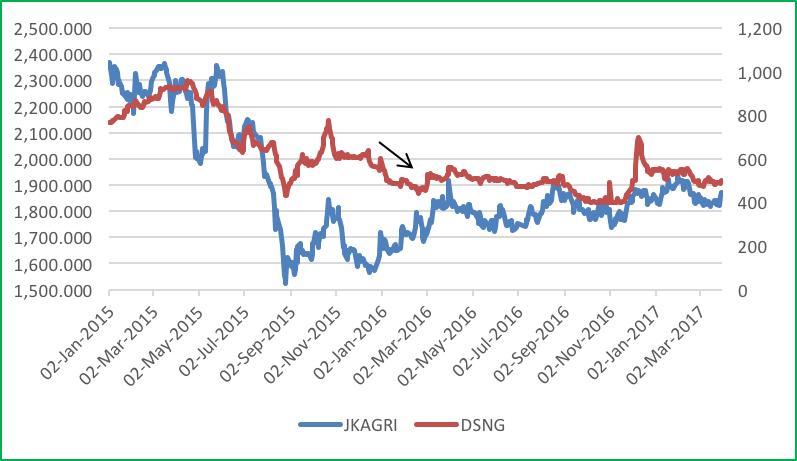
Figure 16: DNSG vs. JAKAGRI
DSNG Monte Carlo Simulation
There exists a 5 percent probability that DSNG realizes revenue losses of more than USD 30 million (IDR 395 billion), or 37 percent of its expected quarterly revenue. The majority of DSNGs revenue is from only two buyers, increasing its risk of losing a major revenue source. Figure 17 (below) shows DSNGs Monte Carlo simulation revenue distribution illustrating the probability and impact of DSNG falling below its expected USD 81 million (IDR 1,075 billion) quarterly revenue threshold. The graph presents a summary of 1,000 iterations, ranging from worst case to best case. The analysis shows that DSNG has a 5 percent probability of ending up with a quarterly revenue result at or below USD 51 million (IDR 680 billion). If that happens, it will likely affect net margins, which average has been in line with that of peers.
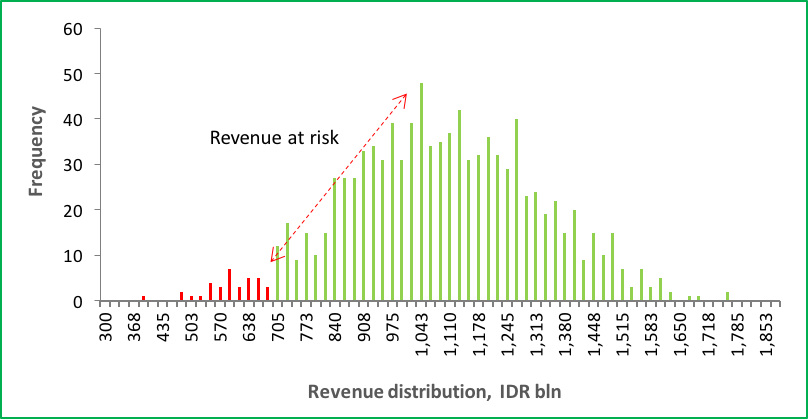
Figure 17: DSNG has 37 percent revenue at risk
Eagle High Plantations (BWPT:IJ)
- In Chain Reaction Research’s 2016 Sustainability Benchmark: Indonesian Palm Oil Growers, BWPT scored 4 out of 12 points.
- BWPT lacks a NDPE policy, and historically has deforested and cleared peat lands.
- 2015 and 2016: BWPT mainly dependent upon two buyers.
- 2017: Monte Carlo model forecasts 42 percent quarterly revenue at risk at a 5 percent probability if BWPT does not diversify its buyer base. The company has a high debt, so lack of NDPE-compliant buyers creates risks to its net margin.
BWPT is a palm oil company operating oil palm plantations and mills. As shown in Figure 18 (below), BWPT is dependent upon two buyers: Golden Agri-Resources (GAR) and Wilmar. In Q2 and Q3 2016, these two buyers accounted for almost all of BWPTs revenue. After Q3 2015 Q3, BWPT lost Wings Group as a significant buyer – greater than 10 percent of revenue – but Wings Group is a non-NDPE compliant buyer. This loss did not result in a drop in revenue because BWPT partly replaced Wings Group with other unidentified buyers. Asian Agri/Apical has steadily increased its importance as a revenue source since its transaction with BWPT in Q3 2016. BWPTs unidentified buyers are limited, indicating that BWPT is dependent upon key NDPE-compliant buyers such as GAR, leading to higher revenue at risk for BWPT .
GAR, Wilmar and Asian Agri/Apical are NDPE-compliant buyers. Since the departure of Wings Group as a key buyer, Wilmar has accounted for a higher part of the quarterly revenues. Wilmar may push BWPT to improve sustainability standards.
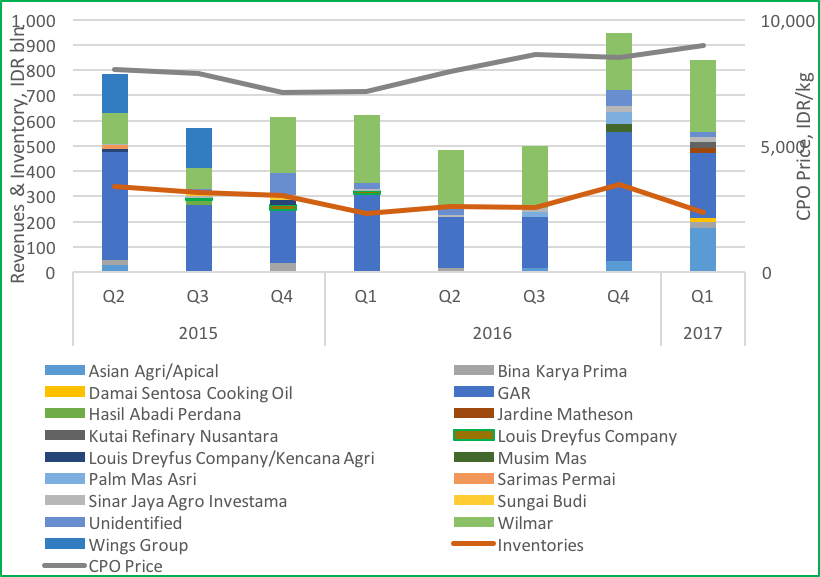
Figure 18: BWPTs revenue, main buyers, and CPO price
Figure 19 (below) shows that BWPT experienced negative profit margins during H2 2015 and throughout 2016. This is aligned with lower quarterly revenues as shown in Figure 18 (above) and also due to high debt. Liquidity ratios also remained low in the entire analyzed period.
Figure 19: BWPTs profitability margins and liquidity ratios
Figure 20 (below) compares the BWPT share price with JAKAGRI. BWPTs shares often move with the JAKAGRI. In Q2 and Q2 2016, when BWPT reported reduced revenue, its shares underperformed the index. In Q4 2016, after BWPT realized higher revenues, the share prices reacted positively.
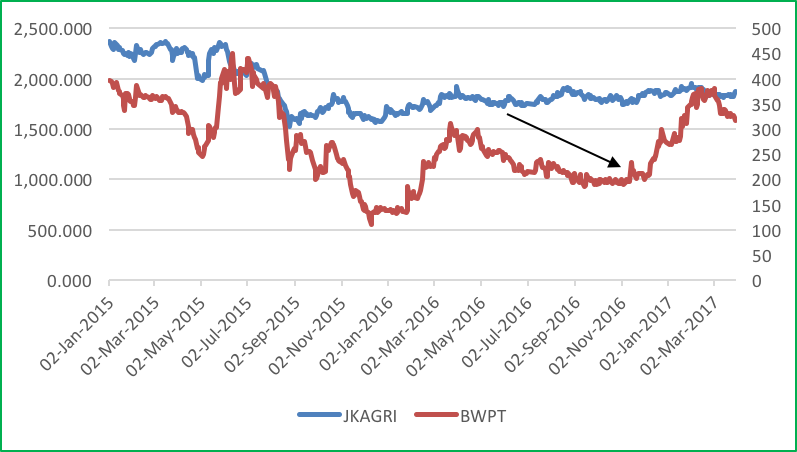
Figure 20: BWPT vs. JAKAGRI
BWPT Monte Carlo Simulation
There exists a 5 percent probability that BWPT realizes revenue losses of more than USD 14 million (IDR 190 billion), or 42 percent of its expected quarterly revenue. The majority of BWPTs revenue is from two buyers, increasing its risk of losing a major revenue source. Figure 21 (below) shows BWPTs Monte Carlo simulation revenue distribution illustrating the probability and impact of BWPT falling below its expected USD 34 million (IDR 455 billion) quarterly revenue threshold. The graph presents a summary of 1,000 iterations, ranging from worst case to best case. The analysis shows that BWPT has a 5 percent probability of ending up with quarterly revenue result at or below USD 20 million (IDR 265 billion). Because of BWPTs low net margin and liquidity ratios, BWPT may not have the capacity to bear such a revenue hit.
Figure 21: BWPT has 42 percent revenue at risk
Salim Ivomas Pratama (SIMP:IJ)
- In Chain Reaction Research’s 2016 Sustainability Benchmark: Indonesian Palm Oil Growers, SIMP scored 6 out of 12 points.
- SIMP lacks a NDPE policy and has poor sustainability commitments.
- 2015 and 2016: SIMP had a diversified buyer base.
- 2017: Monte Carlo model forecasts less than 22 percent quarterly revenue at risk at a 5 percent probability if SIMP does not further diversify its buyer base. The company’s relatively low net profit margin might still lead to a strong profit volatility.
SIMP is a vertically integrated agribusiness company focused on palm oil and derivative products. It is also engaged in the cultivation of rubber, sugarcane and other crops as well as the crushing of copra. As shown in Figure 22 (below), the largest part of the quarterly revenue comes from unidentified buyers. This means these buyers each account for less than 10 percent of the total quarterly revenue. The only buyer that consistently accounts for 10 percent or more of the quarterly revenue in each of the analyzed quarters is Indofood Agri Resources, a parent company of Salim Ivomas Pratama. Indofood Agri Resources has a 72 percent equity ownership stake in SIMP. SIMP has a diversified buyer base.
Indofood Agri Resources itself launched an NDPE policy in February 2017. The other buyers are unidentified and could include buyers that are non-NDPE compliant. However, the lack of transparency on buyers accounting for less than 10 percent of the quarterly revenue makes it impossible to analyze these buyers.
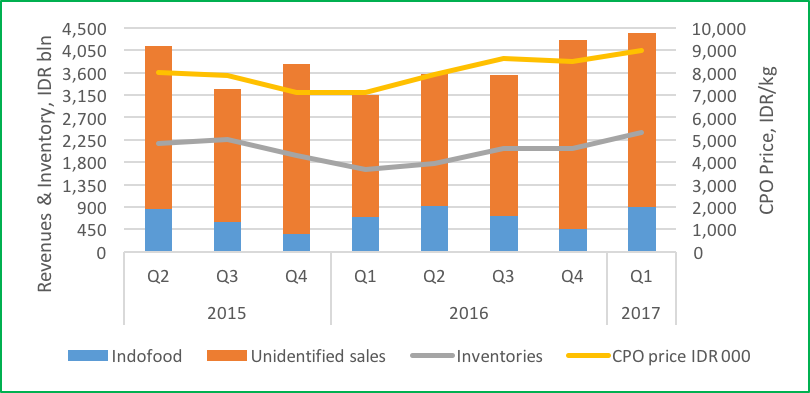
Figure 22: SIMPs revenue, main buyers, and CPO price
Figure 23 (below) shows that there is a clear upward trend since the beginning of 2016 in both the profit margins and the liquidity ratios. This is in line with the increasing quarterly revenues since the beginning of 2016. The increasing current ratio may be a signal that some inventory is also increasing, which could bear some additional storage cost. The liquidity level may thus be subject to optimization.
Figure 23: SIMPs profitability margins and liquidity ratios
Figure 24 (below) compares the SIMPs equity price with the JAKAGRI. SIMP moves similarly to the JAKAGRI. Only in 2016 Q1 the share price of SIMP differs from the movement of the JAKAGRI.
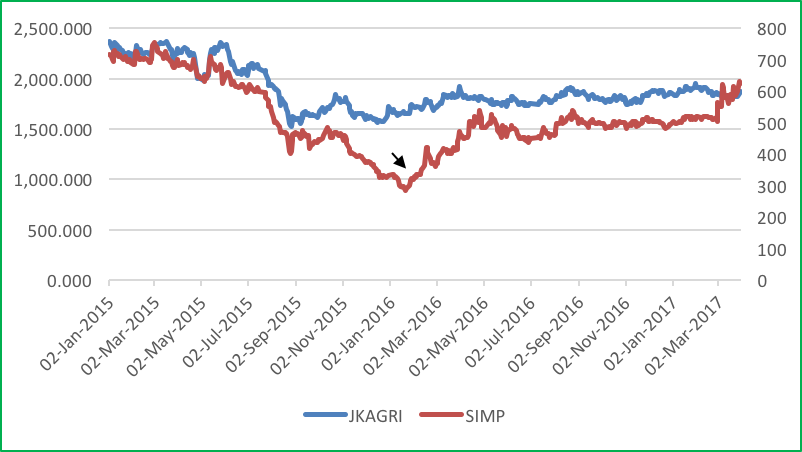
Figure 24: SIMP vs. JAKAGRI
SIMP Monte Carlo Simulation
There exists a less than 5 percent probability that SIMP realizes revenue losses of more than USD 63 million (IDR 835 billion), or 22 percent of its expected quarterly revenue. This is low when compared to its peers. Figure 25 (below) shows SIMPs Monte Carlo simulation revenue distribution, illustrating the probability and impact of SIMP falling below its expected USD 282 million (IDR 3,770 billion) quarterly revenue threshold. The graph presents a summary of 1,000 iterations, ranging from worst case to best case. The analysis shows that SIMP has a less than 5 percent probability of ending up with quarterly revenue at or below USD 220 million (IDR 2,930 billion). SIMP has a low net margin vs/ peers with recent positive movement. Its net profit volatility might remain high because its lacks a NDPE policy.

Figure 25: SIMP has 22 percent revenue at risk
Sampoerna Agro (SGRO:IJ)
- In Chain Reaction Research’s 2016 Sustainability Benchmark: Indonesian Palm Oil Growers, SGRO scored 4 out of 12 points.
- SGRO lacks a NDPE policy and has violated governmental environmental regulations. Historically 60 percent of output was sold to NDPE-compliant buyers, which creates a revenue at risk concern.
- 2016: SGRO unidentified buyer base made last four quarterly revenues fluctuate.
- 2017: Monte Carlo model forecasts 53 percent quarterly revenue at risk at a 5 percent probability if SGRO does not make sure its buyer base becomes less volatile. The company has a relatively high margin which can moderate the impact of lost sales due to non-NDPE compliance
SGRO is a producer of palm oil, palm kernel and oil palm seeds. The company has also diversified into the production of sago and rubber. As shown in Figure 26 (below), Golden Agri-Resources (GAR) and Wahana Citra Nabati were the two most important buyers for SGRO over the last eight quarters. In some quarters, HSA Group and Louis Dreyfus Company also accounted for more than 10 percent of SGROs quarterly revenue. SGROs revenue dropped in Q2 2016. This drop was caused by a decline in the revenue sourced from unidentified buyers and a decline in revenue sourced from GAR. In Q4 2016 SGROs revenue increased more than three times. This growth was mainly caused by a substantial increase in unidentified buyers. These unidentified buyers all accounted for less than 10 percent of the total quarterly revenue. These movements in revenue caused by unidentified buyers show how important the unidentified buyers are, and the severe impact of their volatility.
Both the HSA Group and Royal Industries Indonesia can be classified as non-NDPE compliant buyers. Furthermore, the sustainability of the unidentified buyers is unknown. GAR can be classified as a NDPE-compliant buyer. Wahana Citra Nabati has a new policy in place but it is unknown how it will be enforced. When GAR is buying less in a certain quarter, there is a good possibility that GAR will partially be replaced by one of the other buyers discussed above. Since these buyers are most likely non-NDPE compliant buyers, this leads to leakage.
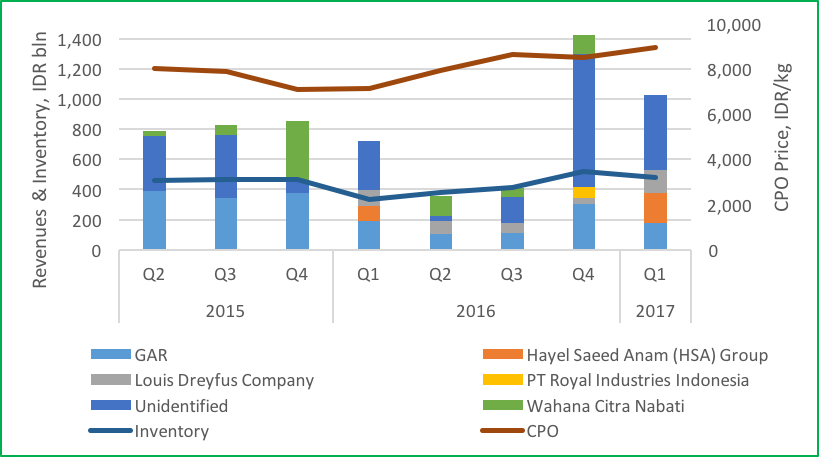
Figure 26: SGROs revenue, main buyers, and CPO price
Figure 27 (below) shows that the drop in quarterly revenue in Q2 2016 that sustained in Q3 impacted SGROs profit margins. The operating margin and net profit margin became negative in Q2 2016, and the ROE margin almost zero. The drop in liquidity ratios followed in Q3 2016.
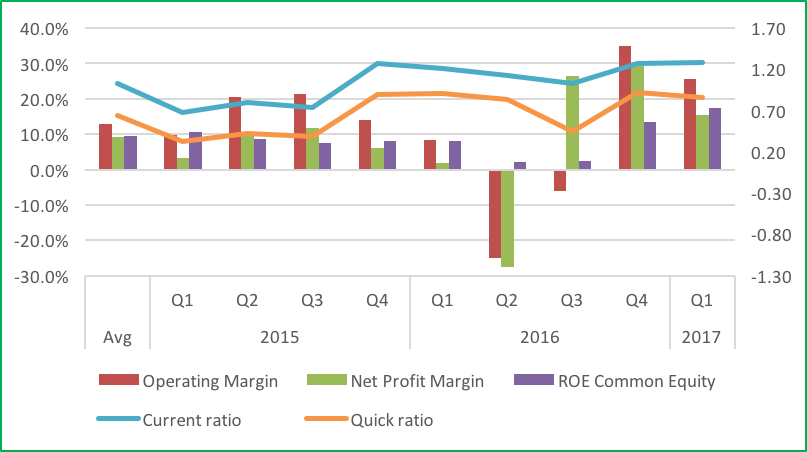
Figure 27: SGROs profitability margins and liquidity ratios
Figure 28 (below) compares the movement of the share price of SGRO with the JAKAGRI. As can be seen, the low quarterly revenues in Q2 and Q3 2016 did not translate into a drop in the share price of SGRO.
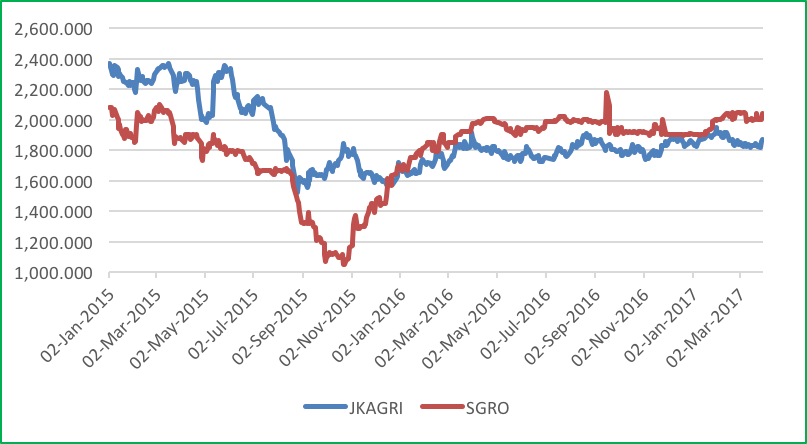
Figure 28: SGRO vs. JAKAGRI
SGRO Monte Carlo Simulation
There exists a 5 percent probability that SGRO realizes revenue losses of more than USD 36 million (IDR 480 billion), or 53 percent of its quarterly revenue. The reason is that a substantial part of SGROs revenue comes from only 1 or 2 buyers, increasing its risk of losing a major revenue source. Also, the quarterly revenue tends to fluctuate severely, mainly due to a volatile unidentified buyer base. Figure 29 (below) shows SGROs Monte Carlo simulation revenue distribution illustrating the probability and impact of SGRO falling below its expected USD 68 million (IDR 900 billion) quarterly revenue threshold. The graph presents a summary of 1,000 iterations, ranging from worst case to best case. The analysis shows that SGRO has a 5 percent probability of ending up with quarterly revenue result at or below USD 32 million (IDR 420 billion). As in a historical perspective SGRO has a relatively high net margin, the impact of a high revenue volatility from non-NDPE compliance is relatively low.
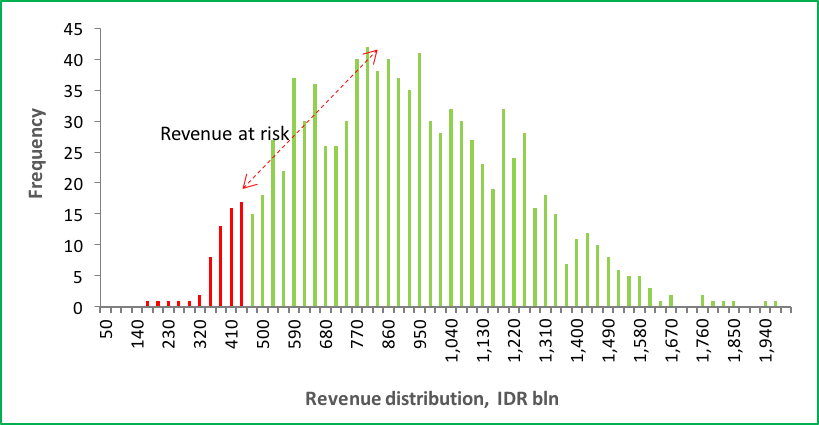
Figure 29: SGRO has 53 percent revenue at risk
Sawit Sumbermas Sarana (SSMS)
- In Chain Reaction Research’s 2016 Sustainability Benchmark: Indonesian Palm Oil Growers, SSMS scored 2 out of 12 points.
- Recently the company adopted a NDPE policy after Unilever stopped sourcing contracts in Q2 2017 after it was demonstrated the SSMS was engaged in deforestation and peatland clearance.
- In 2015 and 2016, SSMS lost its NDPE-compliant buyers and replaced them with non-NDPE compliant buyers.
- In 2017, Monte Carlo model forecasts 58 percent quarterly revenue at risk at a 5 percent probability if SSMS does not make sure its buyer base becomes less volatile and if SSMS will be able to uphold its new NDPE commitments.
SSMS is a palm oil company, focused on production and processing. As shown in Figure 30 (below), SSMS lost Asian Agri/Apical, Golden Agri-Resources (GAR) and Wilmar were lost as buyers after 2015. As shown in the report Sawit Sumbermas Sarana: Supplying the Palm Oil Leakage Market, Risks for Purchasers, over 80 percent of SSMS customers changed during 2014 to 2015. The diminished revenue sourced from Asian Agri/Apical and GAR led to a revenue drop in Q3 2015 but in Q4 2015 SSMS replaced these lost buyers. In Q4 2016 and Q1 2017, most of SSMS revenue was sourced from unidentified buyers. This indicates that these buyers all accounted for less than 10 percent of the total quarterly revenue. The volatile unidentified buyer base can cause problems for SSMS. Unilever stopped sourcing after the above-mentioned report. After this event, SSMS has adopted an NDPE policy.
The three buyers that were lost after 2015 – Asian Agri/Apical, GAR and Wilmar – are NDPE-compliant buyers. Some of the buyers that replaced these lost customers are non-NDPE compliant buyers. FELDA IFFCO/Tabung Haji and Royal Industries Indonesia are non-NDPE compliant buyers. The increasing importance of unidentified buyers could lead to non-NDPE compliant CPO purchasing which could increase leakage.
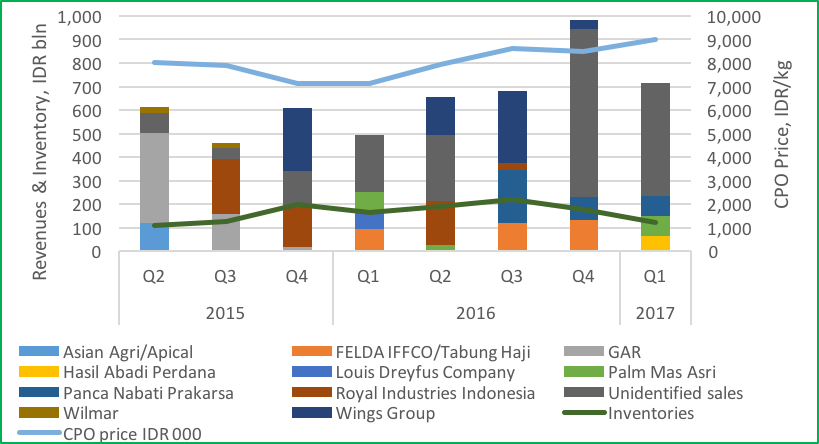
Figure 30: SSMSs revenue, main buyers, and CPO price
Figure 31 (below) shows that the profitability margins in Q3 2015 were affected by the partial loss of certain buyers, which shows the impact of not being NDPE compliant at that time. The liquidity ratios experienced a sharp decline in the next quarter in Q4 2015.
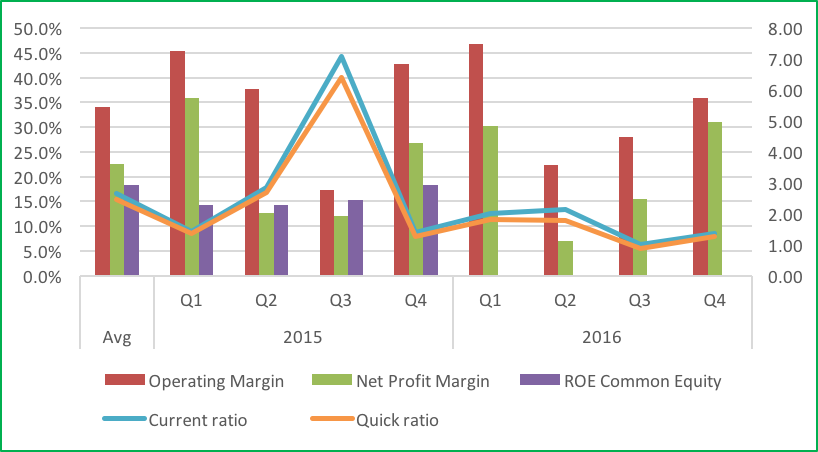
Figure 31: SSMSs profitability margins and liquidity ratios
Figure 32 (below) compares the movement of the share price of SSMS with the JAKAGRI. As can be seen, the movement of SSMS correlates positively with the movement of the JAKAGRI. Yet, however, in the period of Q2 and Q3 of 2015, SSMS has lost a lot of value, while there was no market wide event impacting negatively the index. Chain Reaction Research points to a 17 percent to 20 percent underperformance vs. peers described in Sawit Sumbermas Sarana: Supplying the Palm Oil Leakage Market, Risks for Purchasers. This negative price trend relates to the poor revenue performance of the company and the adverse publicity of it not being capable to retain customers.
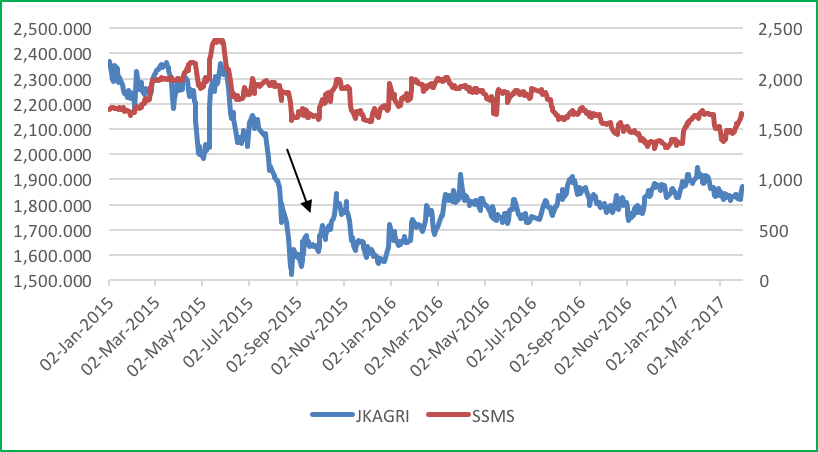
Figure 32: SSMS vs. JAKAGRI
SSMS Monte Carlo Simulation
There existed a 5 percent probability that SSMS realizes revenue losses of more than USD 32 million (IDR 425 billion), or 58 percent of its expected quarterly revenue. The reason is that most of SSMSs revenue comes from only one or two buyers, increasing its risk of losing a major revenue source. Figure 33 (below) shows SSMSs Monte Carlo simulation revenue distribution describing the probability and impact of SSMS falling below its expected USD 55 million (IDR 730 billion) quarterly revenue threshold. The graph presents a summary of 1,000 iterations, ranging from worst case to best case. The analysis shows that SSMS has a 5 percent probability of ending up with quarterly revenue result at or below USD 23 million (IDR 305 billion). The current NDPE compliance can moderate this risk.
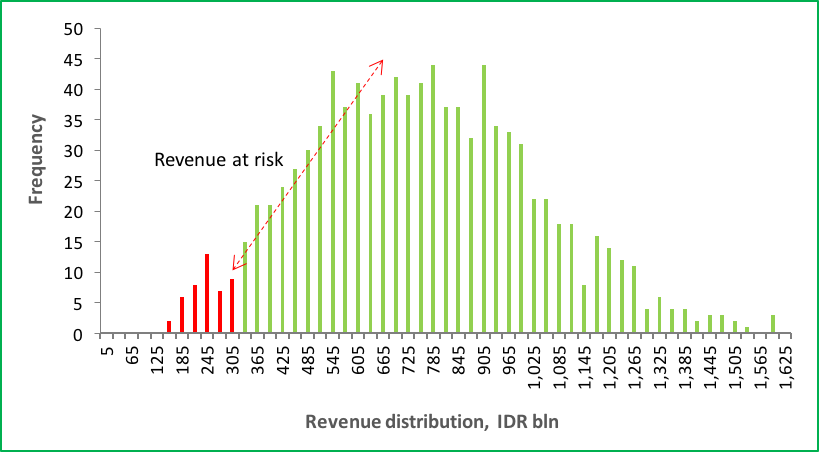
Figure 33: SSMS has a 58 percent revenue at risk
Sinar Mas Agro Resources and Technology (SMAR:IJ)
- In Chain Reaction Research’s 2016 Sustainability Benchmark: Indonesian Palm Oil Growers, SMAR scored 10 out of 12 points.
- Despite of this high score, SMAR generates 10 percent of its sales from NDPE compliant buyers.
- In 2015 and 2016: SMAR has one known important buyer, with its unidentified buyers each accounting for less than 10 percent of quarterly revenues.
- In 2017, Monte Carlo model forecasts 32 percent quarterly revenue at risk at a 5 percent probability, but because Global Agronusa Indonesia (GAI) is a related party this should be interpreted as less than 5 percent likelihood. SMAR has a relatively low operating and net margin, which leads to a high sensitivity to revenue volatility.
SMAR is an integrated palm oil company, focusing on both production and processing. It is also involved in the oleochemical business. As shown in Figure 34 (below), one buyer accounted for more than 10 percent of the quarterly revenue in the analyzed quarters. This client is GAI. This company is related party of SMAR. Besides GAI, the other buyers are unknown and they did not account for more than 10 percent of each quarter’s revenues. Besides GAI, SMAR has a diversified and stable buyer base. GAI can be classified as a NDPE-compliant buyer. As SMAR is not transparent on its unidentified buyers, the analysis is constrained. It is important to note that Purisma Sasmita has a 97 percent equity ownership stake in SMAR limiting minority shareholders’ ability engage with management to push for stronger NDPE achievements.
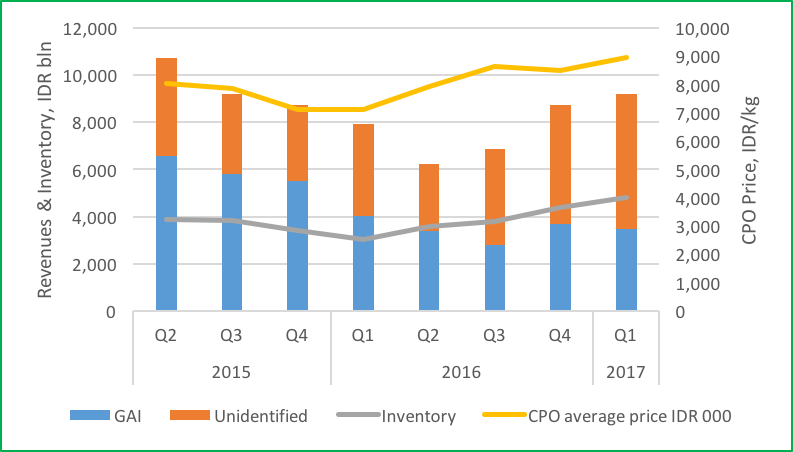
Figure 34: SMARs revenue, main buyers, and CPO price
Figure 35 (below) shows that SMARs profit margins were mostly negative in Q2 and Q3 2015. Liquidity ratios also fell to their lowest values during this period. Starting in Q4 2015, SMAR margins became positive again. Overall margins are relatively low with SMAR working with a relatively high net debt.
Figure 35: SMARs profitability margins and liquidity ratios
Figure 36 (below) compares SMARs share price movement with JAKAGRI. SMARs share price moves in a similar manner as its quarterly revenue, as shown in Figure 34 (above). In Q 2016, this trend ceased because SMAR had its lowest quarterly revenue among the nine quarters analyzed.
Figure 36: SMAR vs. JAKAGRI
SMAR Monte Carlo Simulation
According to SMARs Monto Carlo Simulation, it has a 5 percent probability that the company realizes revenue losses of more than USD 199 million (2,650 billion IDR), or 32 percent of its expected quarterly revenue. The reason is that a substantial part of SMARs revenue comes from only one buyer, increasing its risk of losing a major revenue source. However, GAI is less likely to be lost as a buyer, as it is a related party. The revenue losses will thus likely be less than the simulated losses (for greater accuracy, however, it should be considered that NDPE and revenue risks are also experienced by GAI, and if GAI suffers any losses these will likely impact SMAR).
Figure 37 (below) shows SMARs Monte Carlo simulation revenue distribution illustrating the probability and impact of SMAR falling below its expected USD 630 million (IDR 8,410 billion) quarterly revenue threshold. The graph is a summary of 1,000 iterations, ranging from worst case to best case. The analysis shows that SMAR has a 5 percent probability of ending up with quarterly revenue result at or below USD 431 million (IDR 5,755 billion). Again, this is without accounting for the fact that GAI is a related party of SMAR.
Figure 37: SMAR has 32 percent revenue at risk
Tunas Baru Lampung (TBLA:IJ)
- In Chain Reaction Research’s 2016 Sustainability Benchmark: Indonesian Palm Oil Growers, TBLA scored 0 out of 12 points.
- Lacks an NDPE policy. It engaged in peat clearance, forest clearance and violation of Government of Indonesia permit.
- In 2015 and 2016, TBLAs most important buyer Sungai Budi Group is its parent company. Sungai Budi Group is a non-NDPE compliant company.
- In 2017, Monte Carlo model forecasts 51 percent quarterly revenue at risk at a 5 percent probability. TBLA has a relatively high net profit margin which tempers net profit volatility in case of loss of revenues.
TBLA is a vegetable cooking oil producer. It operates palm oil plantations, mills and soap and margarine factories. As can be seen in Figure 38 (below), TBLA has two buyers that account for more than 10 percent of its quarterly revenues. These are Inter-United Enterprises and Sungai Budi Group. Sungai Budi Group is the parent company of TBLA as through Budi Delta Swakarya and Sungai Budi, the parent has a 51 percent equity ownership in TBLA. Two of Sungai’s executives also have executive roles in TBLA. Besides these two significant buyers, some quarters TBLA also has a substantial unidentified buyer base. This indicates a potential for more diversification in its buyer base, but also shows the volatility of TBLA customer base. Sungai Budi Group is a non-NDPE compliant buyer. Since it is a related party of TBLA, it is unlikely that this company will stop being a customer any time soon.
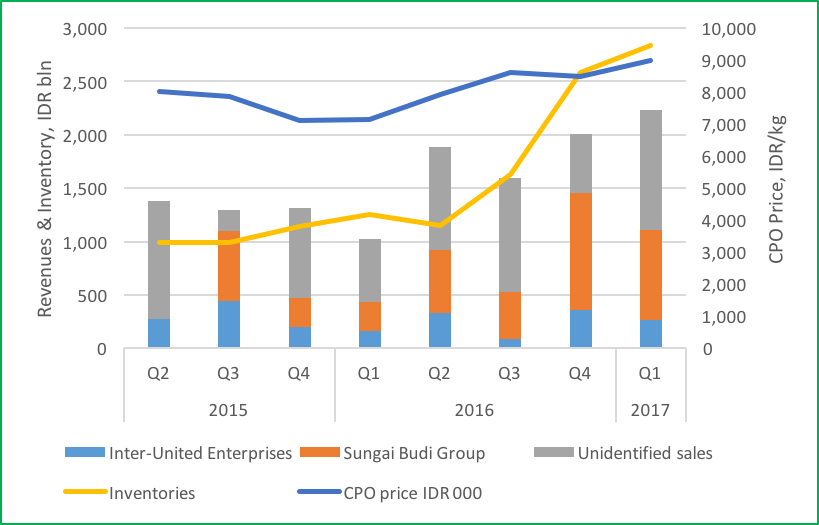
Figure 38: TBLAs revenue, main buyers, and CPO price
Figure 39 (below) shows that TBLAs profitability margins were positive in the analyzed periods. They were at their lowest values in Q3 and Q4 2015 and in Q1 2016, which corresponds with the relatively low quarterly revenues reported in these periods as shown in Figure 38 (above). Its liquidity ratios were stable during the analyzed periods.
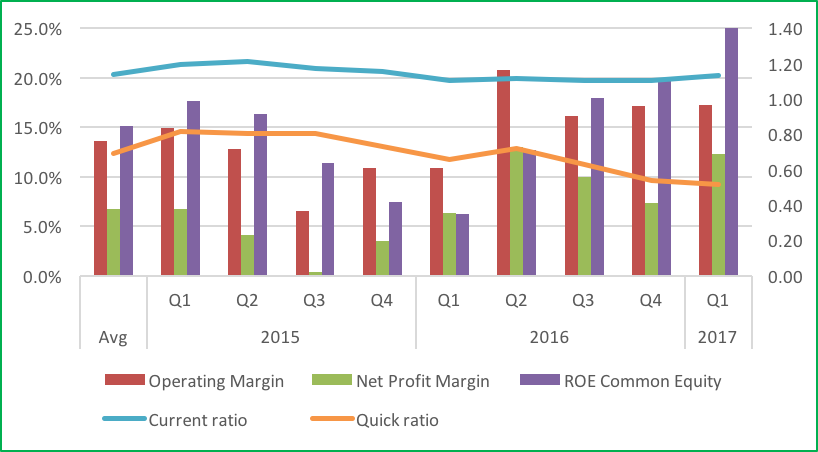
Figure 39: TBLAs profitability margins and liquidity ratios
Figure 40 (below) compares the movement of TBLAs share price with JAKAGRI. TBLA moves mostly in the same direction as the JAKAGRI. The movement of TBLA starts to differ from the JAKAGRI from Q3 2016 onwards, when it exceeds the JAKAGRI. This maybe because TBLAs revenues grew in Q3 and Q4 2016 and Q1 2017 from USD 121 million to USD 168 million.
Figure 40: TBLA vs. JAKAGRI
TBLA Monte Carlo Simulation
There exists a 5 percent probability that TBLA realizes revenue losses of more than USD 60 million (IDR 810 billion), or 51 percent of its quarterly revenue threshold. The reason is that a substantial part of TBLAs revenue comes from only two buyers. This increases its risk of losing a major revenue source.
As shown in Figure 41 (below), TBLAs Monte Carlo simulation revenue distribution illustrating the probability and impact of TBLA falling below forecast USD 120 million (IDR 1,600 billion) quarterly revenue threshold. The graph presents a summary of 1,000 iterations, ranging from worst case to best case. The analysis shows that TBLA has a 5 percent probability of ending up with quarterly revenue result at or USD 60 million (IDR 810 billion). In the peer group, TBLA has a relatively high net profit margin and the high 51 percent outcome in the analysis above should lead to a mitigated net profit volatility.
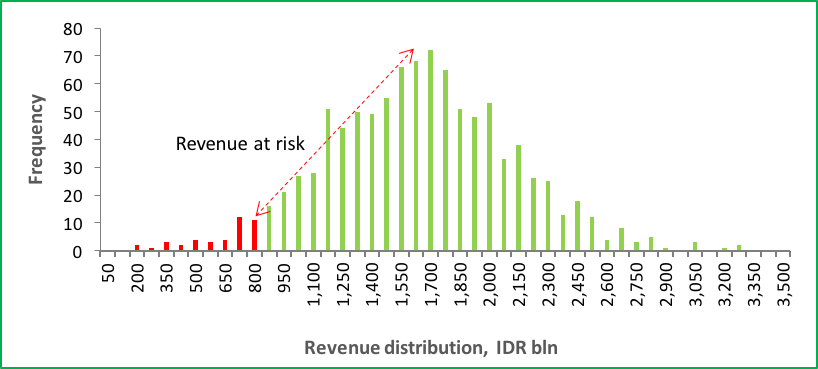
Figure 41: TBLA has 51 percent revenue at risk
Appendix: Monte Carlo Simulation Methodology
A Monte Carlo simulation is a common forecasting technique that allows professionals to model risk, given a set of assumptions. The process provides the decision-maker with the frequency of a range of possible outcomes and the probabilities that they will occur, for any choice of action. It shows extreme possibilities demonstrating risks that may not be obvious at a casual glance – at a 5 percent or less probability – on both sides of a distribution.
Monte Carlo processes build models of possible results by substituting a range of values – using a lognormal probability distribution – for any factor that has uncertainty. The main factors for the modelled Monte Carlos simulations in this paper are:
- The purchases of each individual corporate buyer
- Their respective growth rates
- Unidentified corporate purchases
- Their growth rates
The employed Monte Carlo simulation calculates results 1,000 iterations, each time using a different set of random values drawn from the lognormal probability distribution. It thus generates lognormally distributed and likely outcomes for the companies’ quarterly revenue. Depending upon the number of uncertainties and the ranges specified for them, a Monte Carlo simulation could involve 1,000 or more iterations – or recalculations – before it is complete. In this manner, Monte Carlo simulation can be used to forecast revenue at risk given these companies inability to meet their buyers’ NDPE policies. Thus, Monte Carlo simulations provide iterations that not only demonstrate what could happen, but also the probability of each outcome.
The modelled simulations estimate the quarterly revenue each firm can achieve, with a corresponding specific probability. The outcomes discussed above showcase revenue estimates at 5 percent probability.
Definitions:
- Significant buyer: Buyers that exceed 10 percent of the quarterly revenue are considered significant buyers. Indonesian palm oil companies are required to file the names of these significant buyers and the percentage of the total quarterly revenue they represent. Buyers that do not exceed 10 percent of the quarterly revenue are not required to be made transparent.
- Related party: Parent company, subsidiary, joint venture or affiliate; less likely to cease purchasing contracts.
- Expected revenue: in the present context, this is the average and most likely revenue out of 1000 Monte Carlo iterations, simulating possible quarterly revenue outcomes.
Disclaimer: This report and the information therein is derived from selected public sources. Chain Reaction Research is an unincorporated project of Aidenvironment, Climate Advisers and Profundo (individually and together, the "Sponsors"). The Sponsors believe the information in this report comes from reliable sources, but they do not guarantee the accuracy or completeness of this information, which is subject to change without notice, and nothing in this document shall be construed as such a guarantee. The statements reflect the current judgment of the authors of the relevant articles or features, and do not necessarily reflect the opinion of the Sponsors. The Sponsors disclaim any liability, joint or severable, arising from use of this document and its contents. Nothing herein shall constitute or be construed as an offering of financial instruments or as investment advice or recommendations by the Sponsors of an investment or other strategy (e.g., whether or not to “buy”, “sell”, or “hold” an investment). Employees of the Sponsors may hold positions in the companies, projects or investments covered by this report. No aspect of this report is based on the consideration of an investor or potential investor's individual circumstances. You should determine on your own whether you agree with the content of this document and any information or data provided by the Sponsors.
Save


