
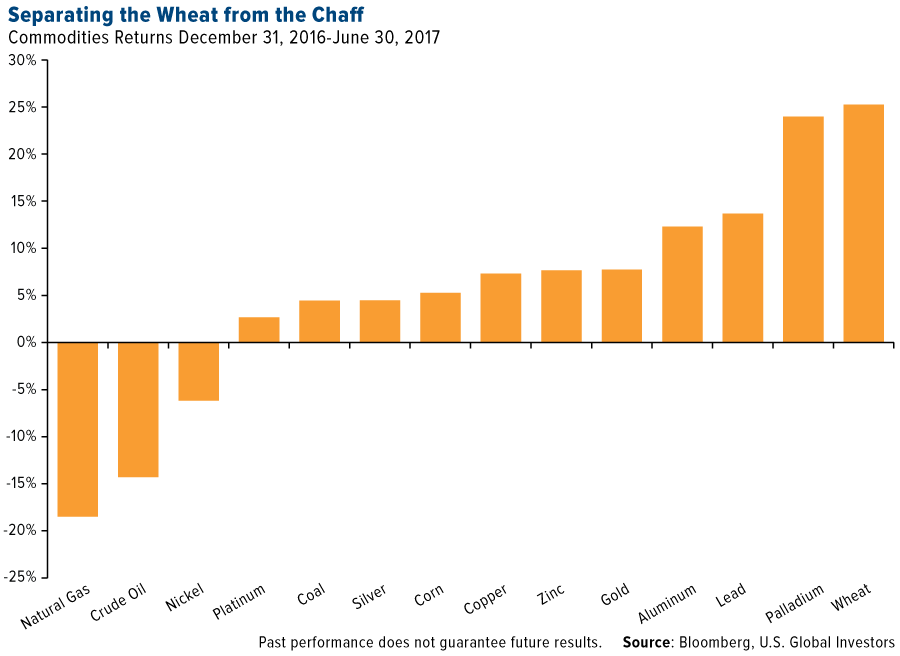
Of the 14 commodities we track closely at U.S. Global Investors, wheat rose to take the top spot for the first half of 2017, returning more than 25 percent. The grain was followed closely by palladium—used primarily in the production of catalytic converters—which gained 24 percent.

Half Of S&P 500 Earnings Growth Can Be Attributed To One Sector, Which Is Unsustainable
To view our ever-popular, interactive Periodic Table of Commodity Returns, click here.
Between the start of the year and June 30, the Bloomberg Commodity Index contracted 4.03 percent, with energy weighing down on the mostly strong performances of precious and industrial metals and agriculturals.
Contributing to metals’ gains was U.S. dollar weakness. During the first six months, the greenback lost 7.54 percent, responding partially to President Donald Trump’s comment in April that the dollar was “getting too strong.”
More recently, the president tweeted his thoughts on gas prices, which he pointed out were “the lowest in the U.S. in over ten years” for the July Fourth holiday. “I would like to see them go even lower,” he added.
Trump Goes to Warsaw
Speaking of Trump, I feel as if he has represented the U.S. and its values admirably during his visit to Europe this week. His speech in Warsaw sought to strengthen ties between America and Poland, which the New York Times just named the “next economic powerhouse.”
Trump drew attention to a danger that’s “invisible” yet every bit as dangerous as terrorism and extremism—namely, “the steady creep of government bureaucracy that drains the vitality and wealth of the people.”
The U.S. and Poland “became great not because of paperwork and regulations,” the president said, “but because people were allowed to chase their dreams and pursue their destinies.”
This is the Trump I believe voters elected last November. If he were only able to stay on message and give his Twitter account a rest, he might more easily help engender and inspire an environment that better reflects the vision he described to his Polish audience.
I’m also encouraged by his first one-on-one meeting with Russian President Vladimir Putin. From what I’ve read, it sounds as if the two leaders managed to make some progress on Syria, with both sides agreeing to cooperate in maintaining “safe zones.”
Oil Embroiled
Regarding lower gas prices, Trump just might get his wish. Having fallen 14.30 percent in the first six months, oil is currently underperforming its price action of the past four years.
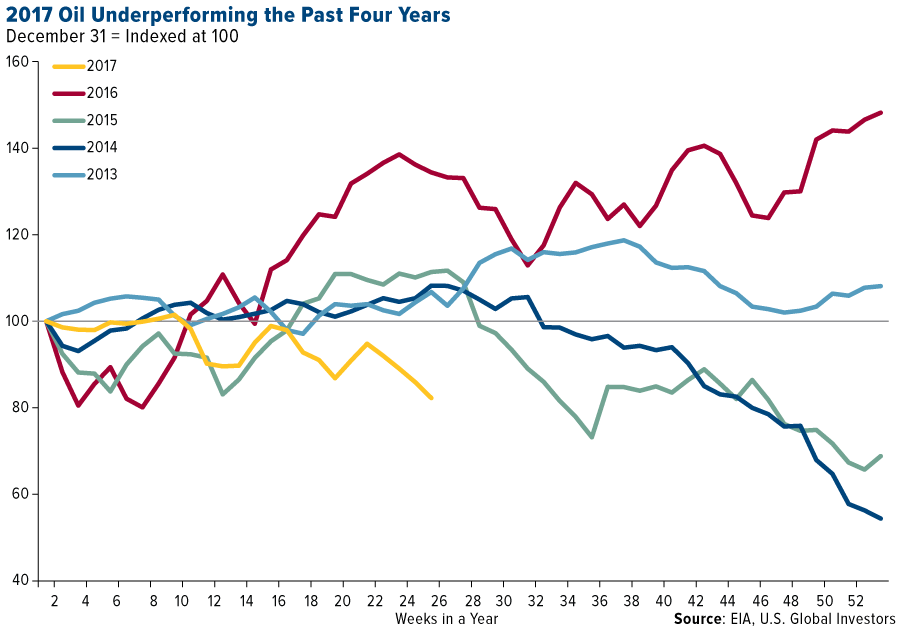
Much of the thanks for oil’s slump goes to U.S. shale producers, which were quick to reactivate dormant rigs following the Organization of Petroleum Exporting Countries’ (OPEC) December announcement that it would be cutting production. As a result, the market is awash in black gold. In May, the Energy Information Administration (EIA) estimated that domestic output should average 9.3 million barrels a day this year and nearly 10 million in 2018, a level unseen in the U.S. since 1970.
West Texas Intermediate (WTI) popped above $47 a barrel this week, however, on news that oil and gas inventories in the U.S. dropped sharply last week. What’s more, the number of active North American oil rigs fell by two in the week ended June 30, from 758 to 756 rigs, the first such contraction since January, according to the Baker Hughes Rig Count.
Although constructive, there’s still quite a bit of terrain to cover before oil reaches the low- to mid-$50s we saw at the start of the year.
Where’s the Wheat?
As I told you back in May, the U.S. reclaimed its longstanding title as the world’s number one wheat exporter this year, displacing Russia, whose weak currency gave the Eastern European country a competitive advantage.
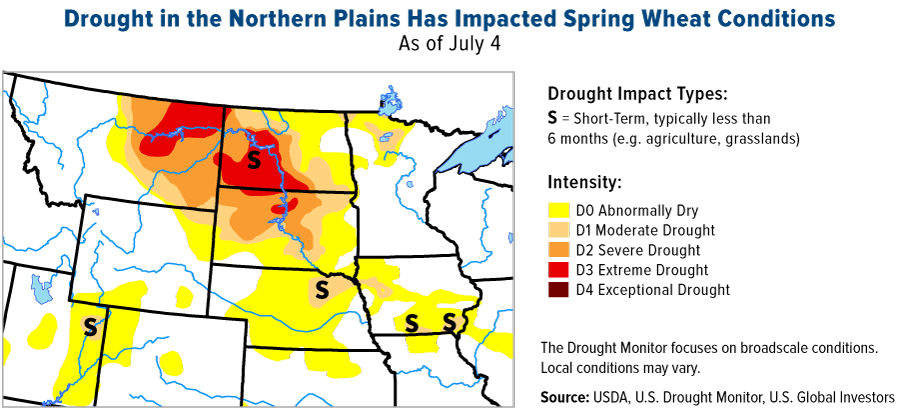
We might soon slip to second place yet again, for two primary reasons: 1) low U.S. wheat plantings and 2) severe droughts and unexpectedly hot weather conditions in the Northern Plains.
According to a March report from the U.S. Department of Agriculture (USDA), American farmers just aren’t planting wheat like they used to. Not only are we seeing shrinkage in the acreage devoted to the amber grain—more and more farmers are switching to soybeans—but wheat seedings are down for a second straight year. The USDA, in fact, estimates them to be at their lowest level ever since records began nearly 100 years ago in 1919.
As to the second point, severe to extreme hot and dry weather conditions in the Northern Plains—specifically in areas of Montana and the Dakotas—are putting wheat (and corn) on the defensive. According to the U.S. Drought Monitor, parts of Montana just experienced their driest May and June in 99 years and the driest January through June since 1983. This week alone, temperatures in the region surged into the 90s and 100s, about 15 to 20 degrees above the norm. These conditions are expected to persist for several more weeks.
Supply constraints have pushed the grain up 25 percent so far this year to a nearly two-year high. A bushel now costs a little over $5, but some analysts see it rising above $6 and $7.
Precious Metals Continue to Shine
Also benefiting from limited supply is silver, which climbed nearly 4.5 percent as of June 30. The Silver Institute reported in May that global silver mine production in 2016 declined for the first time in 14 years on lower-than-expected output from lead, zinc and gold projects. World supply decreased 0.6 percent year-over-year, or about 32.6 million ounces.
Meanwhile, silver’s use in solar photovoltaic (PV) cells hit a new record high last year, further boosting demand. As I shared with you in May, solar ranked as the number one source of new electric generating capacity in the U.S. in 2016, followed by natural gas and wind.
In the first half of 2017, palladium, the silvery-white metal used in the production of catalytic converters, has surged to a 16-year high on speculative demand.
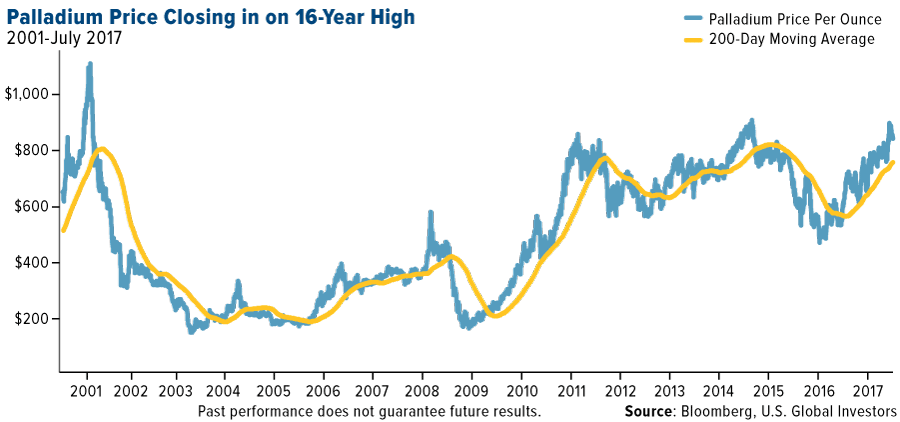
At first blush, this trade might seem counterintuitive. After all, gas-powered vehicles, which use catalytic converters to control emissions, are expected to be surpassed in sales by electric vehicles, which do not require palladium, as early as 2040. Volvo just announced that it would completely phase out gas-only vehicles by 2019. Meanwhile, Tesla’s first mass-market battery electric vehicle (BEV) finally hit production this week.
Driving palladium’s rally this year, though, are bets that European car buyers will soon be switching from diesel-burning to gas-burning cars because of emissions concerns.
 |
Palladium—one of the rarest elements on earth and mined almost exclusively in Russia and South Africa—is the smallest precious metals market, making its prices particularly vulnerable to such speculative trading. It’s achieved near-price parity with its sister metal, platinum, for the first time in two decades.
On the other end of the spectrum is gold, whose market is larger than many major global stock and bond markets. That includes U.K. gilts, German bunds, the FTSE 100 Index, the Hang Seng Index and others.
Up 7.75 percent in the first six months, gold was supported largely by strong demand in India as consumers made their purchases ahead of the government’s Goods and Services Tax (GST), in effect since July 1, which levies a 3 percent tax on gold.
The impact of the country’s demonetization in December is also still being felt, with Indians’ confidence in fiat currencies tested. I believe Prime Minister Narendra Modi’s scheme to combat black money and public corruption, while admirable, has only reinforced Indians’ faith in the yellow metal as a store of value.
With consumer prices in the U.S. possibly set to begin rising on President Trump’s more protectionist policies—once he can get them enacted—gold priced in dollars could also be headed higher.
The Road Ahead
There’s a lot we’ll be keeping our eyes on in the second half of the year. For one, look to India’s upcoming Diwali holiday and fourth-quarter wedding season, during which gold gift-giving is considered auspicious.
Earlier in the year, I was excited about Trump’s ambitious infrastructure agenda, which would have greatly boosted domestic demand for base metals and energy. But with the Senate still locked in negotiations over what to do about Obamacare, an infrastructure deal looks as if it’s months if not years away.
I think with Tesla firing up its Nevada-based Gigafactory, investors would be prudent to keep their eyes on aluminum, cobalt, nickel and especially copper, as electric vehicles use around three times as much of the red metal as conventional vehicles. Lithium, which I featured back in March, is also expected to be a beneficiary of the move to BEVs.
Index Summary
- The major market indices finished up this week. The Dow Jones Industrial Average gained 0.30 percent. The S&P 500 Stock Index rose 0.07 percent, while the Nasdaq Composite climbed 0.21 percent. The Russell 2000 small capitalization index gained 0.03 percent this week.
- The Hang Seng Composite lost 0.90 percent this week; while Taiwan was down 0.94 percent and the KOSPI fell 0.50 percent.
- The 10-year Treasury bond yield rose 8 basis points to 2.38 percent.
Domestic Equity Market
Strengths
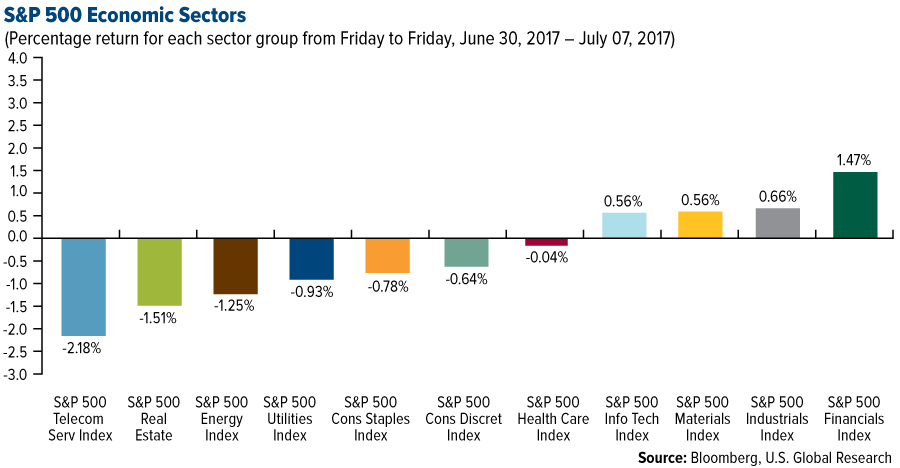
- Financials was the best performing sector of the week, increasing by 1.47 percent versus an overall increase of 0.11 percent for the S&P 500.
- Advanced Micro Devices was the best performing stock for the week, increasing 7.05 percent.
- Warren Buffett has agreed to pay $9 billion for Energy Future Holdings, a deal which will eventually grant him ownership over the electric-utility giant Oncor.
Weaknesses
- Telecommunications was the worst performing sector for the week, falling 2.18 percent versus an overall increase of 0.11 percent for the S&P 500.
- Baker Hughes was the worst performing stock for the week, falling 30.45 percent.
- Jawbone, the fitness tracker firm, is shutting down. Its founder and CEO Hosain Rahman has started a new company, Jawbone Health Hub, focusing on medical hardware and software.
Opportunities
- Wall Street appears to be ignoring stock market history. Analyst consensus is for the S&P 500 to finish the year little changed from current levels. However, according to Strategas Research Partners, if the S&P 500 gains at least 8 percent in the first half of the year, it has averaged a 7.2 percent gain during the second half.
- Having passed regulatory requirements, Tesla CEO Elon Musk announced that the new Tesla model will begin deliveries on July 28.
- RED, which makes high-end cameras for shooting films, announced it will be making a $1,200 smartphone called the Hydrogen One. It is anticipated the phone will display 3D holographic content without the user needing glasses, a breakthrough in smartphone augmented reality technology.
Threats
- The European Union is reportedly planning to hit Google with a second significant fine, this time relating to Android.
- Qualcomm is trying to prevent Apple from selling some iPhones and iPads in the U.S. The company is disputing the matter with the U.S. International Trade Commission, arguing Apple violated six of its patents.
- The biggest U.S. automakers all saw their sales decline, with General Motors’ sales declining more than economists had forecast.
The Economy and Bond Market
Strengths
- U.S. nonfarm payrolls data came in strong at 222,000, beating expectations of 178,000.
- The June ISM manufacturing survey came in at 57.8, higher than the consensus forecast of 55.3.
- Air freight is indicating a strengthening global economy. Global freight tonne kilometers grew by 12.7 percent year-on-year in May.
Weaknesses
- U.S. factory orders for May came in down 0.8 percent, weaker than the 0.5 percent drop that was forecast.
- America's trade deficit decreased slightly in May but was still substantially larger through the first five months of 2017 than a year prior. The latest metrics from the Bureau of Economic Analysis and the Census Bureau show the country's goods and services deficit contract by $1.1 billion in May to $46.5 billion, while the deficit through the first five months of the year was up $27 billion, or 13.1 percent, from where it stood at the end of May 2016. According to a team of researchers at Oxford Economics, it is noteworthy that the trade deficit with key trading partners including Canada, Mexico and China are all wider year-to-date compared to the same period in 2016, a development that will likely heighten the protectionist rhetoric from the Trump administration.
- Average hourly earnings rose by 0.2 percent month-over-month, disappointing expectations of a 0.3 percent rise.
Opportunities
- The Illinois Senate overrode Republican Governor Bruce Rauner’s veto of budget bills approved this week by the Democrat-led legislature, moving the state closer to ending its record budget impasse. It’s now up to the state’s House of Representatives to hold its own override vote. According to a spokesman for Speaker Michael Madigan, the chamber plans to do so. S&P Global Ratings and Fitch Ratings said the measures marked a shift toward repairing the state’s battered finances.
- Investors will be keeping a close eye on Friday's retail sales numbers for confirmation that consumer spending is picking up as expected.
- The U.S. consumer price index (CPI) report for June is released on Friday, which investors will also be watching closely. The market will need to see some rise in core inflation in the coming months in order to validate the Fed maintaining its current policy tightening timetable.
Threats
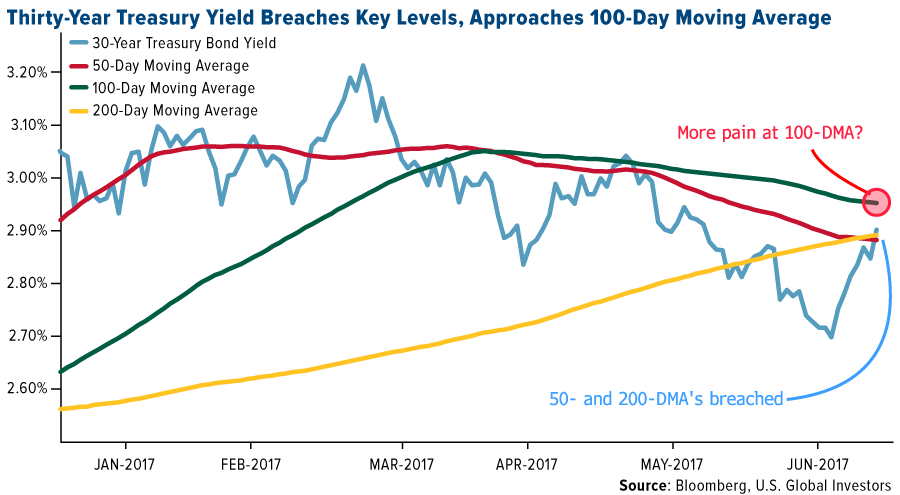
- This week’s bond slide prompted 30-year Treasury yields to breach both the 50- and 200-day moving averages, leading to a substantial steepening of the yield curve. With yields nearing the 100-day moving average, a breach could prompt a renewed surge of selling.
- The Fed’s consensus about when to unwind its balance sheet and how to set policy strategy in a time of low inflation is starting to fragment. The latest Fed meeting minutes reveal the debate highlighted divisions over the timing of balance sheet roll-off and unease over recent weak readings on inflation. For inflation, while the official baseline outlook is that recent weakness is transitory, the minutes show a split of about half the members on policy strategy. The policy committee was also divided over when to start gradual tapering off of the balance sheet, leading to no decision made on timing. Such division could result in instability within the Fed and lack of clarity on policy, leading to market turmoil.
- According to the New York Times, hackers have been trying to break into U.S. power stations, including nuclear power operators, through phishing attacks. The attacks have been perpetuated by sending fake CVs to trick targets into opening malicious messages. So far, there's no evidence it has worked.
Gold Market
This week spot gold closed at $1,212.54, down $29.01 per ounce, or 2.34 percent. Gold stocks, as measured by the NYSE Arca Gold Miners Index, ended the week lower by 4.21 percent. Junior-tiered stocks outperformed seniors for the week, as the S&P/TSX Venture Index slipped just 1.50 percent. The U.S. Trade-Weighted Dollar Index finished the week slightly higher by 0.38 percent following the previous week’s shellacking drop of 1.66 percent.
| Date | Event | Survey | Actual | Prior |
|---|---|---|---|---|
| Jul-2 | Caixin China PMI Mfg | 49.8 | 50.4 | 49.6 |
| Jul-3 | ISM Manufacturing | 55.3 | 57.8 | 54.9 |
| Jul-5 | Durable Goods Orders | -0.8% | -0.8% | -1.1% |
| Jul-6 | ADP Emplotyment Change | 188k | 158k | 230k |
| Jul-6 | Initial Jobless Claims | 243k | 248k | 244k |
| Jul-7 | Change in Nonfarm Payrolls | 178k | 222k | 152k |
| Jul-13 | Germany CPI YoY | 1.6% | -- | 1.6% |
| Jul-13 | PPI Final Demand YoY | 1.9% | -- | 49.6 |
| Jul-13 | Initial Jobless Claims | 245k | -- | 248k |
| Jul-14 | CPI YoY | 1.7% | -- | 1.9% |
Strengths
- The best performing precious metal for the week was palladium, down just 0.34 percent on little news over the week. Gold traders and analysts remained bullish for a third week following North Korea’s test of an intercontinental ballistic missile, writes Bloomberg News.
- The Federal Reserve’s recent meeting showed a lack of consensus on when to shrink its balance sheet, reports Bloomberg, along with how to approach policy strategy at a time of low inflation. Gold held on to its gains following the release of the meeting’s minutes this week.
- Joni Teves at UBS writes that right now gold appears fragile, particularly with market participants digesting a hawkish shift in tone among key central banks of late. She adds that the yellow metal is currently being helped by lean positioning and dollar weakness.
Weaknesses
- The worst performing precious metal for the week was silver, down 6.09 percent. Silver prices plunged as much as 10 percent, as greater than 25 million ounces traded in just under a minute in Singapore on Friday morning. China’s gold reserves remain unchanged for an eighth month. China’s central bank previously raised its gold assets every month through October, aside from one, after announcing a 57 percent jump as of June 2015, reports Bloomberg.
- Gold is set for a fourth weekly loss in five, reports Bloomberg, while silver fell to the lowest level in 15 months. Central banks are moving in synch to tighten policy, boosting yields, curbing liquidity, and hurting some assets including precious metals, the article continues. Gold futures pare declines following the report showing U.S. hiring picked up in June while wage gains disappointed yet again, reports Bloomberg. “Wage growth has stalled, and that could mean inflation is also stalling,” Phil Streible with RJO Futures said. Ric Spooner with CMC Markets commented that yields are rising in response to a market rethink on the timing of central bank plans to reduce QE programs, noting this as a short-term negative for the gold price.
- Tahoe Resources saw its share price decline by nearly 40 percent on news out of a Guatemalan court that their mining license in the country had been suspended. President Jimmy Morales expressed dismay over how the opinion could hurt further investment in the country but told lawmakers if there is a law for such an activity as mining and we don’t want that activity, then change the law.
Opportunities
- Gold miners have cut costs but trade at a fraction of peak valuations, reports Bloomberg Intelligence. Since peak levels in 2008, gold-miner valuations have fallen over 50 percent based on enterprise value to reserves and resources. Miners have cut staff, focused on shrinking debt and are using new technology to garner cost efficiencies, the article continues, and valuations don’t yet reflect these efforts. So, do the miners see the value opportunity? Yes. In fact, CIBC World Markets reports that gold miners have invested around $290 million in exploration companies during the first six months of the year, the highest level recorded in the past decade. In addition, nearly half of equity raised by junior gold stocks on the TSX this year has been through direct investments – no previous year has exceeded 20 percent, CIBC continues.
- UBS Wealth says it’s neither bullish nor bearish on gold right now, but does recommend investors buy the yellow metal near the $1,200 range for insurance, selling it again near the $1,300 range, reports Bloomberg. Wayne Gordon, executive director for commodities and foreign exchange at UBS, says this is because the group has a view that real rates go sideways. A similar report from Canaccord this week notes that gold prices were down in June despite weakness in the U.S. dollar. “This confirms our view that gold is divorcing the U.S. dollar and marrying inflation,” the group writes.
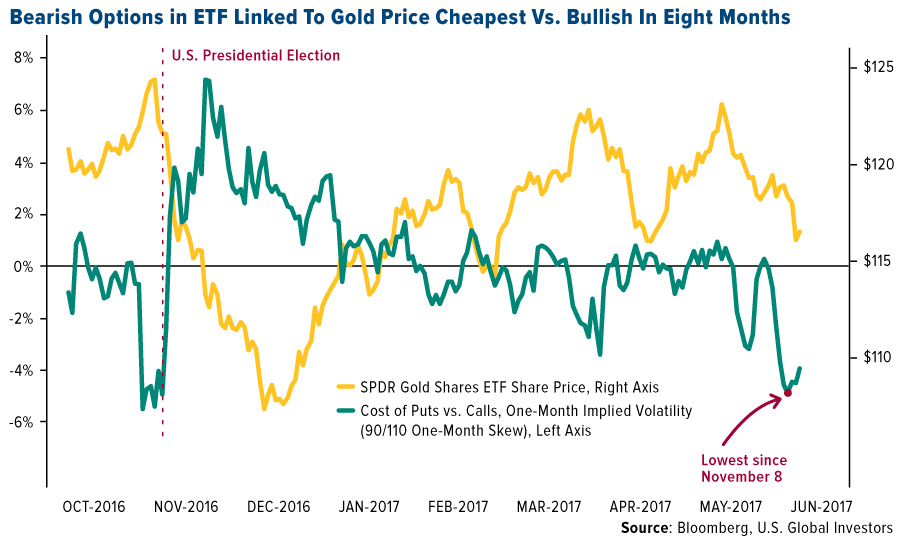
- The cost of bearish over bullish contracts in the SPDR Gold Shares ETF has dropped to the lowest level since the election of Donald Trump, reports Bloomberg. Capital Gold Group reports that commitment of traders (COT) speculative positions are now at very attractive levels for entry in physical gold and silver, according to analysts from Reuters and Seeking Alpha. For a third week, the COT Report reflected speculative longs cut back on their long positions, during a time when the gold price rose 0.59 percent – suggesting strength in gold outside of these pullbacks. Lastly, Peter Berezin of BCA believes gold will finally have its day in the sun once the Fed starts cutting rates in 2019 and stagflationary forces begin to gather steam in the early 2020s.
Threats
- Harry Tchilinguirian, head of commodity markets strategy at BNP Paribas (and one of the most bearish forecasters), is betting bullion will drop from $1,225 an ounce Thursday, to $1,165 an ounce in the fourth quarter. BNP expects the next rate increase in December and Tchilinguirian said in an email that investors will face “a greater opportunity cost of holding gold” as the Fed hikes drive real rates higher, reports Bloomberg.
- According to Bloomberg, electric cars will outsell fossil-fuel powered vehicles within two decades as battery prices plunge. The adoption of emission-free vehicles will happen more quickly than previously estimated because the cost of building cars is falling so fast, shows the Bloomberg New Energy Finance forecast. In fact, Volvo recently vowed the end of combustion cars, saying that every new model launched from 2019 will have an electric motor. These shifts could depress future demand for the platinum group metals.
- Banro Corp. suspended operations at one of its two gold mines in the eastern Democratic Republic of Congo, reports Bloomberg. A convoy of trucks was seized when it was trapped at the cross-fire as the national army battled an armed group, the article continues. In addition, the South African rand fell to a seven-week low against the dollar after the African National Congress was said to propose that the Reserve Bank should be fully state-owned, writes Bloomberg. This fuels concern that the ruling party may target the central bank’s independence.
Energy and Natural Resources Market
Strengths
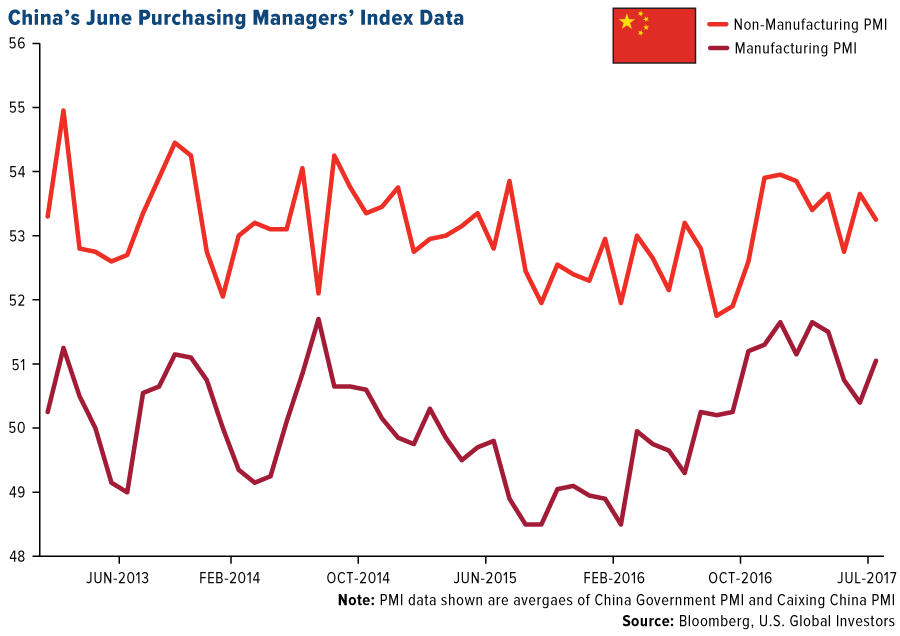
- China's factory activity rebounded in June to show an expansion, indicating an improvement in the manufacturing sector. The Caixin China manufacturing purchasing managers' index rose to 50.4 in June from 49.6 in May, showing a rise in activity. The reading for the last month also crossed above the three-month average, demonstrating upwards momentum; this behavior has traditionally been associated with improving demand for natural resources.
- The best performing sector this week was the FTSE 350 Mining Index. The index of global diversified miners rose 2.18 percent on the back of positive comments by JP Morgan analysts. The bank’s analysts cited the strong iron ore price rebound, strong Chinese demand, and limited supply growth out of India during the upcoming monsoon season as reasons to support the sector.
- Norsk Hydro ASA, the Oslo-based supplier of aluminum and aluminum products, was the best performing stock this week finishing up 5.47 percent. The company rallied on the back of reports that suggest aluminum demand may be nearing a pivot point, out of which it may rally strongly as demand from the auto sector in the U.S. could triple over the next eight years. The tripling potential is attributed to policies that seek to double vehicle fuel efficiency from 2011 levels to 54.5 miles per gallon average.
Weaknesses
- Ethylene, a major petrochemical benchmark was the worst performing commodity this week dropping 5.88 percent. The drop corresponded with Total SA’s announcement that its chemical and refining platforms in Antwerp has started official production of ethylene after a $60 million reinvestment in the facility. The new production is expected to add significant supply to the global petrochemicals market, and thus weighed heavily on ethylene prices.
- The worst performing sector this week was the S&P/TSX Gold Index. The index fell 5.03 percent on the back of weaker gold prices. For a second week in a row, gold prices dropped, weighing on the performance of gold miners.
- The worst performing stock for the week was Devon Energy Co. The Oklahoma-based gas producer dropped 7.66 percent following a rating downgrade from analysts at Bernstein. The broker’s analysts suggest that Devon’s valuation is no longer compelling following a reduction in its oil price forecasts.
Opportunities
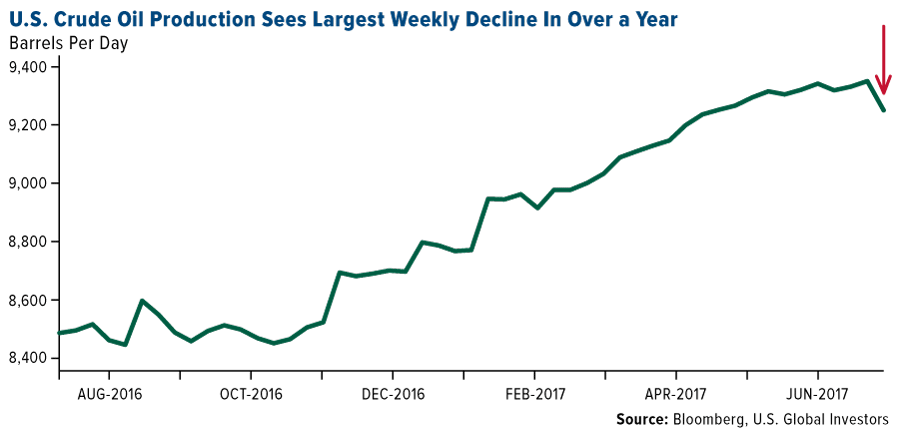
- The spike in U.S. oil drilling, and the positive production momentum may be stalling, suggesting a short squeeze could be in the cards for crude. The EIA reports that U.S. oil production dipped by 100,000 barrels per day (bpd) for the week ending June 23, the largest weekly decline in over a year. In addition, the additions of new oil rigs has all but stalled, suggesting producers are not enticed by current prices and may allow production to decline in order to secure higher prices.
- Major diversified miners have risen to two-month highs after Credit Suisse upgraded the sector to “overweight” in its latest update. In the bank’s analysis, it concludes that miners offer a higher degree of protection on inflation and higher oil prices than other assets classes, and recommends being overweight the sector based on this risk and reward dynamic.
- Wheat prices have been on a tear as agriculture analysts suggest U.S. crops may disappoint as drought conditions spread. With temperatures reaching in excess of 100 degrees Fahrenheit (38 degrees Celsius) in parts of Montana and the Dakotas, the chances of drought affecting crop yields has risen, leading to a sharp rally in the commodity.
Threats
- Iran’s crude output topped 3.9 million barrels per day in June. The figure is the highest production number since the sanctions relief back in January 2016, and suggest that OPEC production currently exempted from the production caps may be growing faster than expected, and may dilute the rebalancing efforts of other OPEC members.
- Russia would oppose any attempts to deepen the oil production cuts currently in effect in OPEC, according to Bloomberg. Russian sources have stated that deepening the cuts would give the impression that OPEC is uncertain about the effectiveness of its production cuts to rebalance the global oil market. The comments were ill-received by the markets who now fear the recent Saudi-Russia cooperation may be at risk, and with it the stability of crude prices.
- Bernstein has joined bulge-bracket banks in downgrading its oil price forecast for 2017 and 2018. According to the broker, shale supply is set to outpace any production cuts from OPEC sources, adding to the overall market imbalance. The broker now expects prices to average $50 in 2017 and 2018, down from $60 and $70 respectively.
China Region
Strengths
- The Caixin China Manufacturing PMI jumped back up into expansionary territory, climbing to 50.4 in June from last month’s 49.6 showing. Notably, China’s FX reserves came in higher as well—up for a fifth straight month.
- The Shanghai Composite Index finished the week up 0.93 percent, among the best in the region for the last five trading days and as the index climbed back up to levels last seen in April.
- Exports rose in Taiwan by 13 percent year-over-year for June, ahead of forecasts for only 8.8 percent. Both imports and exports in Malaysia beat expectations.
Weaknesses
- The Hang Seng Composite Index declined 90 basis points for the week. The Jakarta Composite also finished down for the week, reopening after its lengthy holiday period.
- The World Bank reduced forecasts for the Philippines’ growth in 2017 GDP to a mere 6.8 percent, down from 6.9 percent. (Needless to say, most countries would love to have this “weakness.”)
- Macao’s June casino revenues rose some 25 percent year-over-year, shy of expectations for a rate of 30 percent. Analysts speculate that the drop may well have corresponded with Chinese President Xi Jinping’s visit.
Opportunities
- This week Volvo—a Geely Automobile Hdgs. Ltd. (175 HK) subsidiary—caused a ruckus when it announced that by 2019 it will cease production of combustion-only vehicles. The announcement has generated a significant amount of press about the pace of adoption of electric and hybrid vehicles, and indeed, about the future of the auto industry. Guangzhou Automotive (2238 HK) also climbed this week on the back of upbeat sales numbers and outlook, as well as broker upgrades.
- India’s new nationwide goods and services tax, or GST, was officially introduced on July 1. The move should be a long-term positive.
- China’s new bond link opened trading on Monday this week, offering offshore investors another way to invest in the mainland Chinese debt market, and providing another slow step forward in the internationalization of the renminbi.
Threats
- North Korea successfully tested a missile with the supposed capability of striking Alaska or Hawaii. You might recall one of the last tests resulted in much media discussion about the possibility of North Korea striking only as far as Guam. Given the significant pickup in coverage about North Korea in international media over the past several months, one suspects that analysts within the governments of the U.S. and her allies may well have seen—and feared—something like this coming soon. Recent reports suggest that the U.S. is thus far unable to muster a formal U.N. condemnation of this week’s launch as an ICBM.
- China’s President Xi continues his rhetoric against the THAAD missile program. So too China remains apparently aloof to U.S. concerns about North Korea. And finally, in what is similarly unsurprising from a geopolitical perspective, Xi heralded the “great potential” of Sino-Russian trade ties.
- With the G20 summit this weekend in Hamburg, higher tension about North Korea, and a decidedly more hawkish outlook in rates this week in Europe, the China region remains subject to some headline risk coming out of the weekend. (Of course, if one takes the view that G20 is more about photo opps and careful coordination, then perhaps what should be said is that there is a distinctly higher risk of a misstep or a lack of coordination coming out of an event like this.)
Emerging Europe
Strengths
- Romania was the best performing country this week, gaining 2.4 percent. Gross domestic product grew 1.7 percent in the first quarter of this year, and annual GDP accelerated to 5.7 percent. Romania is the fastest growing country within central emerging Europe.
- The Hungarian forint was the best performing currency this week, gaining 12 basis points against the dollar. The European Commission’s Economic Sentiment Indicator (ESI) hit a record high in June, pushed higher by a surge in construction and services components of the index.
- The materials sector was the best performing sector among eastern European markets this week.
Weaknesses
- Poland was the worst performing country this week, losing 50 basis points. June inflation was reported at 1.5 percent year-over-year, easing from 1.9 percent in May and missing market expectations of 1.8 percent. It was the lowest inflation rate since December last year.
- The Russian ruble was the worst performing currency this week, losing 3.9 percent against the dollar. The weaker oil outlook weighed on the Russian currency. The price of Brent crude oil declined to $46.67 per barrel, losing 2.3 percent this week.
- The real estate sector was the worst performing sector among eastern European markets this week.
Opportunities
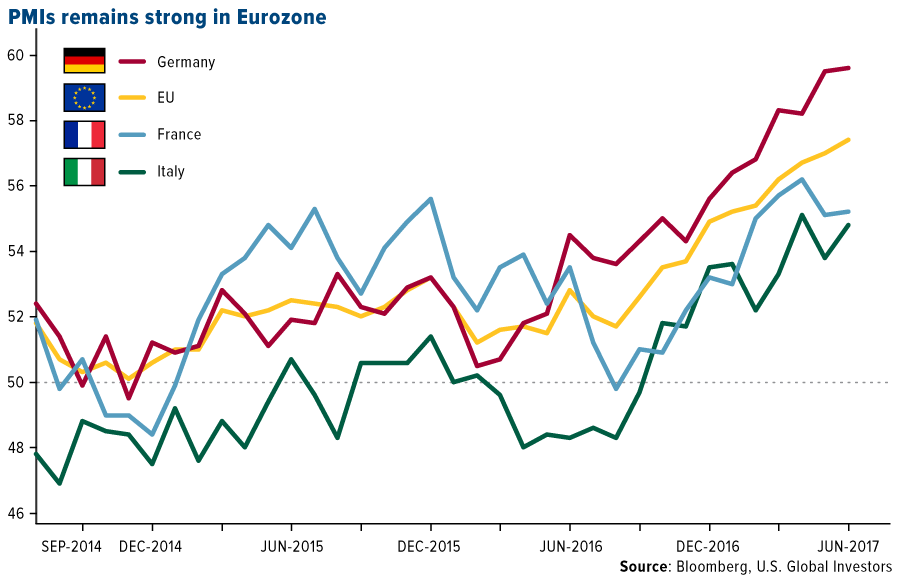
- Germany’s manufacturing growth reached its highest level in more than six years in June, driven by sharp increase in new orders. France and Italy’s PMI stayed well above the 50 level that separates growth from contraction. Eurozone PMI ticked higher to 57.4 from 57. With Greek PMI jumping from 49.6 in May to 50.5 in June, all central emerging Europe countries have their PMIs above the 50 level.
- Poland has achieved a significant diplomatic victory. On his way to the G20 meeting, Donald Trump visited Poland to attend the Three Seas Initiative Summit, a meeting of 12 EU members grouped along the Baltic, Black and Adriatic seas. The Three Seas Initiative was launched in 2016 by the presidents of Croatia and Poland. The main goal of the project is to improve trade, infrastructure and energy links among the 12 central and Eastern Europe nations.
- According to Sebastien Barbe, head of emerging-market research and strategy at Credit Agricole CIB, Russian currency will recover to trade at 57 per dollar by the end of the year. The central bank of Russia started to cut its main rate and even if policy makers continue reducing the key rate by a further 75 basis points this year to 8.25 percent, the real yield would still be very high, Barber said.
Threats
- In Poland, the financial stability committee is working on a draft bill that assumes the creation of a sub-fund for restructuring foreign mortgages. The polish banks with the FX exposure could contribute up to 0.5 percent of their FX mortgage portfolio in quarterly instalments. The contributions may amount to as much as PLN 3 billion for, according to Wood & Company research.
- The Russian government said it would oppose any proposal for deeper production cuts at the group’s ministerial meeting later this month. The country has reduced output by about 300,000 barrels a day, and agreed in May to extend its production cuts to the first quarter of 2018. Lower oil prices will put pressure on the country’s revenue as it is primarily generated from the sale of oil and gas.
- Turkey’s 250 mile “Justice March” organized by the main opposition party to protest against President Erdogan is scheduled to reach Istanbul this weekend. Kemal Kilicdaroglu, the head of the main opposition Republican People’s Party, says he is marching for jailed journalists, academics who have been fired, all those who he says have been unjustly purged in the aftermath of the attempted coup, and anyone else who is looking for justice. The risk of confrontation between parties will increase as the march reaches its destination, Istanbul.
Leaders and Laggards
| Index | Close | Weekly Change($) |
Weekly Change(%) |
|---|---|---|---|
| Russell 2000 | 1,415.84 | +0.48 | +0.03% |
| S&P Basic Materials | 339.41 | +1.99 | +0.59% |
| Nasdaq | 6,153.08 | +12.66 | +0.21% |
| Hang Seng Composite Index | 3,497.29 | -31.89 | -0.90% |
| S&P 500 | 2,425.18 | +1.77 | +0.07% |
| Gold Futures | 1,211.80 | -30.50 | -2.46% |
| Korean KOSPI Index | 2,379.87 | -11.92 | -0.50% |
| DJIA | 21,414.34 | +64.71 | +0.30% |
| S&P/TSX Global Gold Index | 185.73 | -9.13 | -4.69% |
| SS&P/TSX Venture Index | 755.22 | -11.52 | -1.50% |
| XAU | 77.50 | -3.28 | -4.06% |
| S&P Energy | 471.95 | -5.96 | -1.25% |
| Oil Futures | 44.35 | -1.69 | -3.67% |
| 10-Yr Treasury Bond | 2.39 | +0.08 | +3.47% |
| Natural Gas Futures | 2.86 | -0.18 | -5.90% |
| Index | Close | Monthly Change($) |
Monthly Change(%) |
|---|---|---|---|
| Korean KOSPI Index | 2,379.87 | +19.73 | +0.84% |
| Hang Seng Composite Index | 3,497.29 | -36.11 | -1.02% |
| Nasdaq | 6,153.08 | -144.30 | -2.29% |
| XAU | 77.50 | -9.09 | -10.50% |
| S&P/TSX Global Gold Index | 185.73 | -31.98 | -14.69% |
| Gold Futures | 1,211.80 | -81.40 | -6.29% |
| S&P 500 | 2,425.18 | -7.96 | -0.33% |
| S&P Basic Materials | 339.41 | +3.10 | +0.92% |
| DJIA | 21,414.34 | +240.65 | +1.14% |
| Russell 2000 | 1,415.84 | +19.16 | +1.37% |
| SS&P/TSX Venture Index | 755.22 | -37.66 | -4.75% |
| Oil Futures | 44.35 | -1.37 | -3.00% |
| S&P Energy | 471.95 | -4.10 | -0.86% |
| Natural Gas Futures | 2.86 | -0.16 | -5.43% |
| 10-Yr Treasury Bond | 2.39 | +0.21 | +9.71% |
| Index | Close | Quarterly Change($) |
Quarterly Change(%) |
|---|---|---|---|
| Korean KOSPI Index | 2,379.87 | +228.14 | +10.60% |
| Hang Seng Composite Index | 3,497.29 | +153.96 | +4.60% |
| Nasdaq | 6,153.08 | +275.27 | +4.68% |
| Natural Gas Futures | 2.86 | -0.41 | -12.42% |
| Gold Futures | 1,211.80 | -48.80 | -3.87% |
| S&P 500 | 2,425.18 | +69.64 | +2.96% |
| S&P Basic Materials | 339.41 | +9.67 | +2.93% |
| S&P/TSX Global Gold Index | 185.73 | -28.80 | -13.42% |
| XAU | 77.50 | -8.62 | -10.01% |
| DJIA | 21,414.34 | +758.24 | +3.67% |
| Russell 2000 | 1,415.84 | +51.27 | +3.76% |
| SS&P/TSX Venture Index | 755.22 | -69.05 | -8.38% |
| S&P Energy | 471.95 | -45.18 | -8.74% |
| Oil Futures | 44.35 | -7.89 | -15.10% |
| 10-Yr Treasury Bond | 2.39 | +0.00 | +0.08% |
U.S. Global Investors, Inc. is an investment adviser registered with the Securities and Exchange Commission ("SEC"). This does not mean that we are sponsored, recommended, or approved by the SEC, or that our abilities or qualifications in any respect have been passed upon by the SEC or any officer of the SEC.
This commentary should not be considered a solicitation or offering of any investment product.
Certain materials in this commentary may contain dated information. The information provided was current at the time of publication.
Some links above may be directed to third-party websites. U.S. Global Investors does not endorse all information supplied by these websites and is not responsible for their content.
All opinions expressed and data provided are subject to change without notice. Some of these opinions may not be appropriate to every investHoldings may change daily.
Holdings may change daily. Holdings are reported as of the most recent quarter-end. The following securities mentioned in the article were held by one or more accounts managed by U.S. Global Investors as of 03/31/2017:
Geely Automobile Hdgs. Ltd.
Guangzhou Automotive
SPDR Gold Shares ETF
Qualcomm Inc.
The Dow Jones Industrial Average is a price-weighted average of 30 blue chip stocks that are generally leaders in their industry.
The S&P 500 Stock Index is a widely recognized capitalization-weighted index of 500 common stock prices in U.S. companies.
The Nasdaq Composite Index is a capitalization-weighted index of all Nasdaq National Market and SmallCap stocks.
The Russell 2000 Index® is a U.S. equity index measuring the performance of the 2,000 smallest companies in the Russell 3000®, a widely recognized small-cap index.
The Hang Seng Composite Index is a market capitalization-weighted index that comprises the top 200 companies listed on Stock Exchange of Hong Kong, based on average market cap for the 12 months.
The Taiwan Stock Exchange Index is a capitalization-weighted index of all listed common shares traded on the Taiwan Stock Exchange.
The Korea Stock Price Index is a capitalization-weighted index of all common shares and preferred shares on the Korean Stock Exchanges.
The Philadelphia Stock Exchange Gold and Silver Index (XAU) is a capitalization-weighted index that includes the leading companies involved in the mining of gold and silver.
The U.S. Trade Weighted Dollar Index provides a general indication of the international value of the U.S. dollar.
The S&P/TSX Canadian Gold Capped Sector Index is a modified capitalization-weighted index, whose equity weights are capped 25 percent and index constituents are derived from a subset stock pool of S&P/TSX Composite Index stocks.
The S&P 500 Energy Index is a capitalization-weighted index that tracks the companies in the energy sector as a subset of the S&P 500.
The S&P 500 Materials Index is a capitalization-weighted index that tracks the companies in the material sector as a subset of the S&P 500.
The S&P 500 Financials Index is a capitalization-weighted index. The index was developed with a base level of 10 for the 1941-43 base period.
The S&P 500 Industrials Index is a Materials Index is a capitalization-weighted index that tracks the companies in the industrial sector as a subset of the S&P 500.
The S&P 500 Consumer Discretionary Index is a capitalization-weighted index that tracks the companies in the consumer discretionary sector as a subset of the S&P 500.
The S&P 500 Information Technology Index is a capitalization-weighted index that tracks the companies in the information technology sector as a subset of the S&P 500.
The S&P 500 Consumer Staples Index is a Materials Index is a capitalization-weighted index that tracks the companies in the consumer staples sector as a subset of the S&P 500.
The S&P 500 Utilities Index is a capitalization-weighted index that tracks the companies in the utilities sector as a subset of the S&P 500.
The S&P 500 Healthcare Index is a capitalization-weighted index that tracks the companies in the healthcare sector as a subset of the S&P 500.
The S&P 500 Telecom Index is a Materials Index is a capitalization-weighted index that tracks the companies in the telecom sector as a subset of the S&P 500.
The NYSE Arca Gold Miners Index is a modified market capitalization weighted index comprised of publicly traded companies involved primarily in the mining for gold and silver.
The Consumer Price Index (CPI) is one of the most widely recognized price measures for tracking the price of a market basket of goods and services purchased by individuals. The weights of components are based on consumer spending patterns.
The Purchasing Manager’s Index is an indicator of the economic health of the manufacturing sector. The PMI index is based on five major indicators: new orders, inventory levels, production, supplier deliveries and the employment environment.
The S&P/TSX Venture Composite Index is a broad market indicator for the Canadian venture capital market. The index is market capitalization weighted and, at its inception, included 531 companies. A quarterly revision process is used to remove companies that comprise less than 0.05% of the weight of the index, and add companies whose weight, when included, will be greater than 0.05% of the index.
The Bloomberg Commodity Index is made up of 22 exchange-traded futures on physical commodities. The index represents 20 commodities, which are weighted to account for economic significance and market liquidity.
The Baker Hughes North American rig count tracks weekly changes in the number of active operating oil & gas rigs.
The FTSE 100 Index is an index of the 100 companies listed on the London Stock Exchange with the highest market capitalization.
The Caixin China General Services PMI (Purchasing Managers' Index) is based on data compiled from monthly replies to questionnaires sent to purchasing executives in over 400 private service sector companies. The index tracks variables such as sales, employment, inventories and prices.
The Caixin China Manufacturing PMI (Purchasing Managers' Index) is based on data compiled from monthly replies to questionnaires sent to purchasing executives in over 400 private manufacturing sector companies.
The S&P/TSX Global Gold Index is an international benchmark tracking the world's leading gold companies with the intent to provide an investable representative index of publicly-traded international gold companies.
The FTSE 350 Mining Index is a capitalization-weighted index of all stocks designed to measure the performance of the mining sector of the FTSE 350 Index. The index was developed with a base value of 1000 as of December 31, 1985.
The European Commission Economic SentiMent Indicator Eurozone is a monthly indicator that reflects general economic activity of the EU. The indicator combines assessments and expectations stemming from business and consumer surveys. Such surveys include different components of the economy: industry, consumers, constructions and retail trade.
The ISM manufacturing composite index is a diffusion index calculated from five of the eight sub-components of a monthly survey of purchasing managers at roughly 300 manufacturing firms from 21 industries in all 50 states.
The Consumer Price Index (CPI) is one of the most widely recognized price measures for tracking the price of a market basket of goods and services purchased by individuals. The weights of components are based on consumer spending patterns.
The Shanghai Composite Index (SSE) is an index of all stocks that trade on the Shanghai Stock Exchange.
The Jakarta Stock Price Index is a modified capitalization-weighted index of all stocks listed on the regular board of the Indonesia Stock Exchange.


