
It has been an exciting week for U.S. Global Investors. If you haven’t heard, my team and I had the distinct honor of ringing the closing bell at the New York Stock Exchange yesterday afternoon to mark the launch of our latest ETF.
While in New York this week, I had the privilege of seeing many colleagues face-to-face. It’s always a pleasure for me to be able to talk gold with industry friends and experts. One stop during my trip that I thoroughly enjoyed was to chat with Pimm Fox and Lisa Abramowicz on Bloomberg Radio. Our discussion was dynamic as always and I shared with them my outlook for gold in the second half of the year, along with the opportunities I continue to see with royalty names.
Jason Karp’s Tourbillon Capital: FAANGs Are Not Investments; Bubbles Everywhere
 |
I still find it curious that many investors don’t realize what a significant role royalty and streaming companies play in the mining business.
Last year I wrote about some of my favorite royalty names, and how I came to know about this business model in the gold mining industry early in my career. If you haven’t read that blog post, I encourage you to go back and explore the groundbreaking work done by Seymour Schulich and Pierre Lassonde, the two founders of Franco-Nevada.

I think that now is a good time to take another look at royalty companies. Here are the top six things I believe investors should know about this specialized sector.
Low Volatility Could Last Another 18 Months: Goldman
1. What Is a Royalty Company?
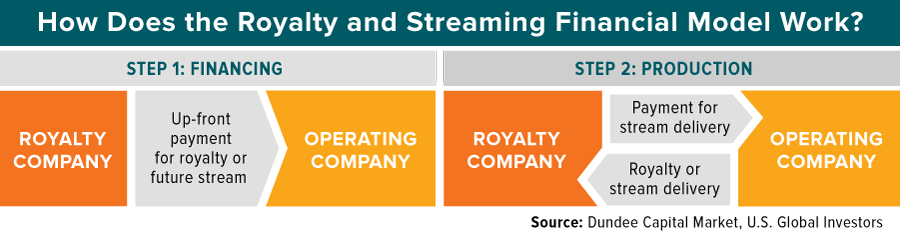
Royalty companies, sometimes called streaming companies, serve a special role in the mining industry. Developing a mine property to start producing gold or other precious metal is an expensive, often time-consuming process. Infrastructure needs to be built out, permits applied for, laborers hired and more.
A royalty company serves as a specialized financier that helps fund exploration and production projects for cash-strapped mining companies. In return, it receives royalties on whatever the project produces, or rights to a “stream,” an agreed-upon amount of gold, silver or other precious metal.
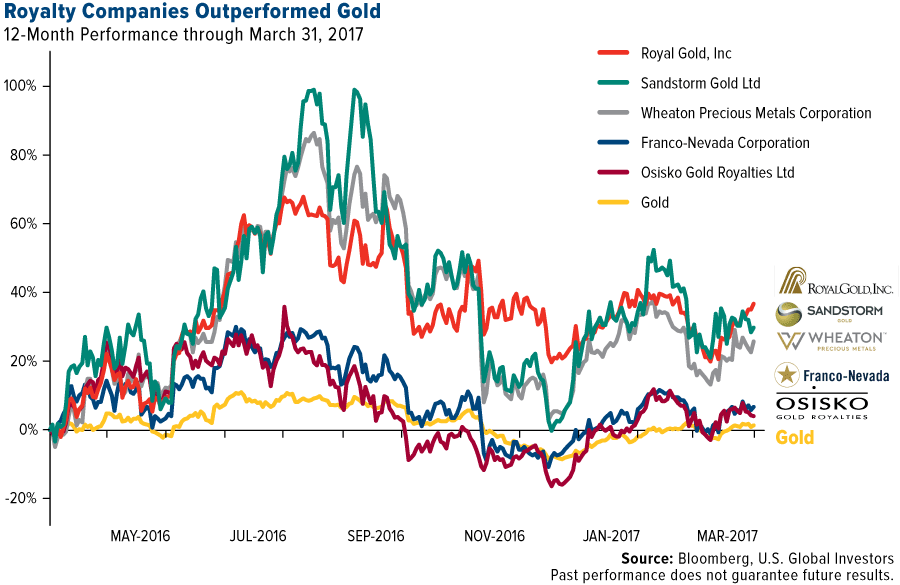
2. Many Gold Royalty Companies Have Still Been Outperforming Gold
When looking over the last 12 months, many of the royalty companies have outperformed gold. While this is indeed remarkable, it is important to remember that royalty companies do have a robust business model. Their ability to generate revenue in times when the gold (or other precious metal) price is both rising and falling is what makes them attractive.
3. Remember Real Interest Rates
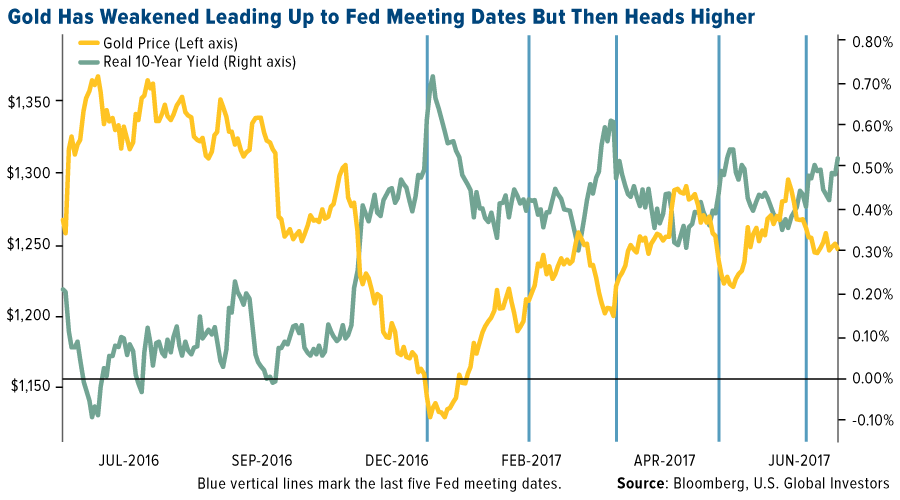
There’s no question that the gold price is volatile, and in any given 12-month rolling period, historically it’s not unusual for the price of the yellow metal to fluctuate up or down by 20 percent. It’s important for investors to remember that gold historically shares a strong inverse relationship with real interest rates. You can see in the chart that as rates rise, the price of gold falls, and vice versa.

This is another reason why I like the royalty model. Since royalty companies set fixed, lower-than-market prices for mining output, they can better manage the volatility that is inherent in the gold market. For example, Wheaton Precious Metals’ 19 agreements in 2016 entitled the company to buy silver at an average price of $4.42 an ounce and gold at $391 an ounce.
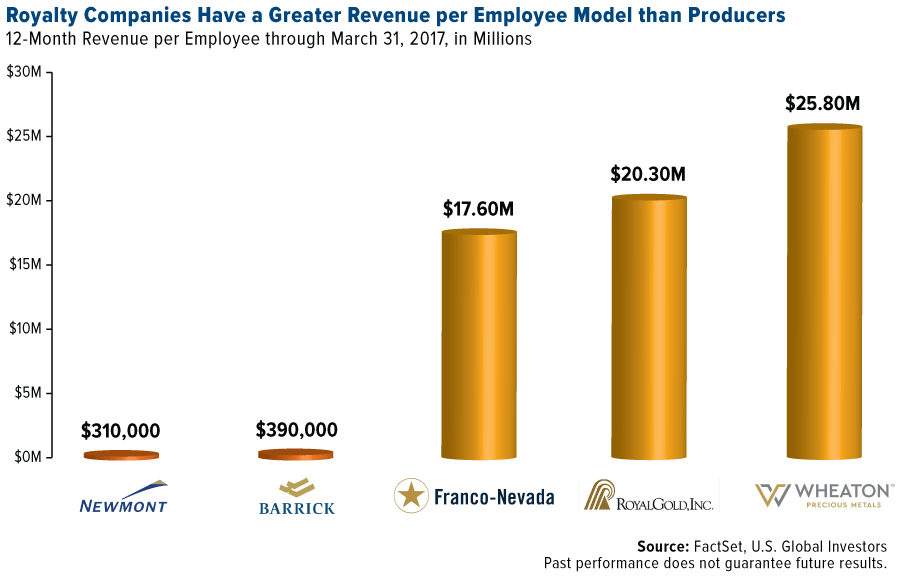
4. Speaking of Revenue
Last time I wrote about these companies, I shared with you that the three big royalty names boast impressive sales per employee. This is still true. Take a look at the 12-month revenue per employee of Franco-Nevada, Royal Gold and Wheaton Precious Metals. Wheaton has only around 30 employees, but has one of the highest rates in the world, generating $25.8 million per employee. By comparison, Newmont, which employs around 30,000 people, generated $310,000 per employee during the same period. Barrick also falls short by comparison.
5. Friendly to Shareholders
Paying dividends is important to investors, as it reflects the health of a company in terms of its cash flow and profits. Even more favorable in the eyes of investors is a company that is growing its dividends. Between 2012 and 2017, royalty companies had a combined annual dividend growth rate of 17 percent. Compare that to 11 percent growth for the S&P 500 Index, and as low as negative 23 and negative 32 percent for global and North American precious metal miners.
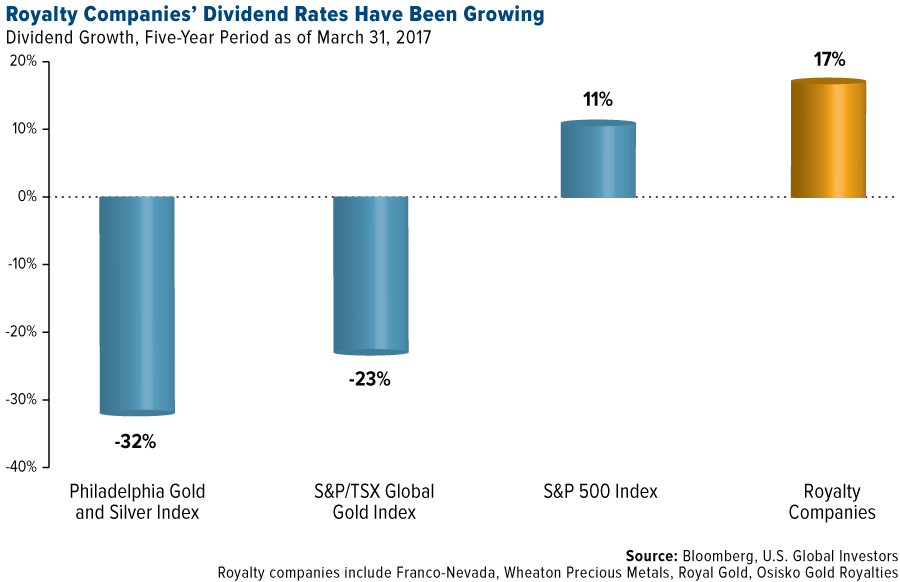
In fact, 2017 marks Franco-Nevada’s 10th straight year of dividend increases since the company went public in 2007.
6. Less Reliance on Debt
Royalty companies are better allocators of capital than some of the biggest gold miners. Take a look at Newmont Mining, which has a 43 percent debt-to-equity ratio, and Barrick has a massive 91 percent. By comparison, many of the royalty companies have much lower debt, and Franco-Nevada has zero debt. This history of profitability and fiscal discipline is one of the main reasons I find royalty companies so attractive.

Index Summary
- The major market indices finished mixed this week. The Dow Jones Industrial Average lost 0.21 percent. The S&P 500 Stock Index fell 0.61 percent, while the Nasdaq Composite fell 1.99 percent. The Russell 2000 small capitalization index gained 0.04 percent this week.
- The Hang Seng Composite gained 0.77 percent this week; while Taiwan was up 0.17 percent and the KOSPI rose 0.55 percent.
- The 10-year Treasury bond yield rose 15 basis points to 2.30 percent.
Domestic Equity Market
Strengths
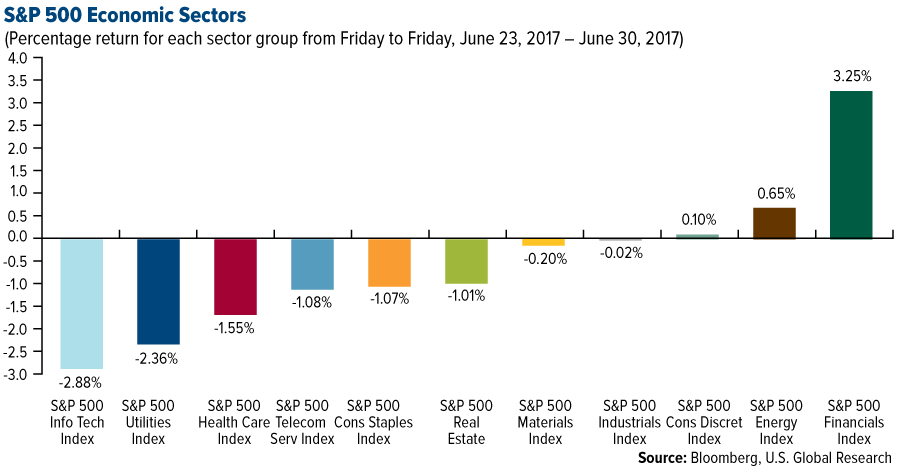
- Financials was the best performing sector of the week, increasing by 3.25 percent versus an overall decrease of 0.25 percent for the S&P 500.
- Acuity Brands was the best performing stock for the week, increasing 14.75 percent.
- Warren Buffett's Berkshire Hathaway made a big investment in real estate. Store Capital, a real estate investment trust, announced that Berkshire Hathaway invested $377 million in the company.
Weaknesses
- Information technology was the worst performing sector for the week, falling 2.88 percent versus an overall decrease of 0.25 percent for the S&P 500.
- Advanced Micro Devices was the worst performing stock for the week, falling 11.93 percent.
- General Motors cut its U.S. 2017 new vehicle sales guidance. The company now forecasts new vehicle sales in the U.S. totaling in the "low $17 million" range, down from its previous estimate of "mid $17 million," according to Reuters.
Opportunities
- Third Point, the $18 billion activist hedge fund led by Dan Loeb, has taken a $3.5 billion stake in Nestlé. It is the largest position Loeb has ever taken and the biggest company his fund has ever gone after. The main points in Third Point’s thesis are for Nestlé to adopt a formal margin target, return capital in conjunction with a formal leverage target, re-shape its portfolio, and sell its stake in L’Oréal.
- Apple and Alphabet have separately partnered with car rental firms Hertz and Avis, respectively, to aid with its self-driving vehicle program. Apple is leasing vehicles from Hertz for its tests, while Avis will store and service Alphabet's fleet of self-driving cars.
- According to MacRumours, Apple has acquired a German eye-tracking firm called SensoMotoric. The firm develops eye-tracking hardware and software for virtual and augmented reality.
Threats
- According to The Register, Microsoft suffered a massive code leak after Windows 10 source code was posted online anonymously. Microsoft confirmed the leak, which included confidential Windows 10 code builds that hackers could exploit for security flaws.
- Smartwatches are taking consumer tastes and it's likely to get worse for traditional Swiss watchmakers, according to UBS. Analysts from the bank noted that the Apple watch is already bigger than every Swiss watch brand except Rolex. Among brands, Swatch is most vulnerable in this environment, according to the analysts.
- Google was handed a massive €2.4 billion ($2.7 billion) fine by EU regulators for promoting its shopping search service above competitors. According to the fine, Google has 90 days to change its behavior. Otherwise it will start paying up to 5 percent of parent firm Alphabet's global daily turnover.
June 29, 2017San Francisco Named a Global Leader in Disruptive Innovation |
June 26, 2017Brexit One Year Later, in Five Charts |
June 21, 2017Does Coal Stand a Chance Against Renewable Energy? |
The Economy and Bond Market
Strengths
- The Consumer Confidence Index rose to 118.9 in June, despite expectations for a drop, The Conference Board announced on Tuesday.
- U.S. home prices rose at a healthy pace in April although the increase slowed a bit from the previous two months. The Standard & Poor's CoreLogic Case-Shiller 20-City Home Price Index rose 5.7 percent in April, after increases of 5.9 percent in March and February. Those gains were the highest in nearly three years.
- German business confidence is booming. The ifo Business Climate Index hit a record 115.1 in June.
Weaknesses
- Italy is spending 17 billion euros to wind down two failing banks. The regional lenders Popolare di Vicenza and Veneto Banca are being wound down, and their good assets will be transferred to the nation's biggest retail bank, Intesa Sanpaolo.
- The pending home sales index dropped 0.8 percent month-over-month. The third consecutive decline in signed contracts to purchase previously owned U.S. homes indicates progress in the housing market is stalling on the heels of lean inventory and rising prices, according to data released Wednesday from the National Association of Realtors in Washington.
- The Institute of International Finance said global debt levels rose $500 billion last year to a record $217 trillion or 327 percent of GDP. The IIF report highlighted “rollover” risks, especially in emerging markets that have borrowed in hard currencies, which could be problematic if commodities fall or the hard currencies strengthen. The increase was largely down to a $3 trillion rise in debt levels across the developing world, of which China was $2 trillion. $200 billion of the emerging market increase was in hard currencies, with 70 percent in the dollar.
Opportunities
- Federal Reserve Chair Janet Yellen said she does not believe there will be another financial crisis soon. She stated, “I do think we're much safer and I hope that it will not be in our lifetimes and I don't believe it will be.”
- The U.S. economy’s first-quarter growth was less tepid than previously reported, as consumer spending and trade added more to expansion, Commerce Department data showed Thursday. First quarter GDP rose at a 1.4 percent annualized rate (forecast and previous estimate were 1.2 percent). Consumer spending, the biggest part of the economy, rose 1.1 percent (forecast and previous estimate were 0.6 percent). Exports grew 7 percent, revised from 5.8 percent.
- The European Commission’s Economic Sentiment Indicator, which aggregates business and consumer confidence, jumped from 109.2 in May to 111.1 in June, its highest level since August 2007. Economists surveyed by The Wall Street Journal last week had expected a more modest rise to 109.5. The surprisingly strong improvement should aid the eurozone’s recovery, since businesses and households are likely to spend more freely if they feel more confident.
Threats
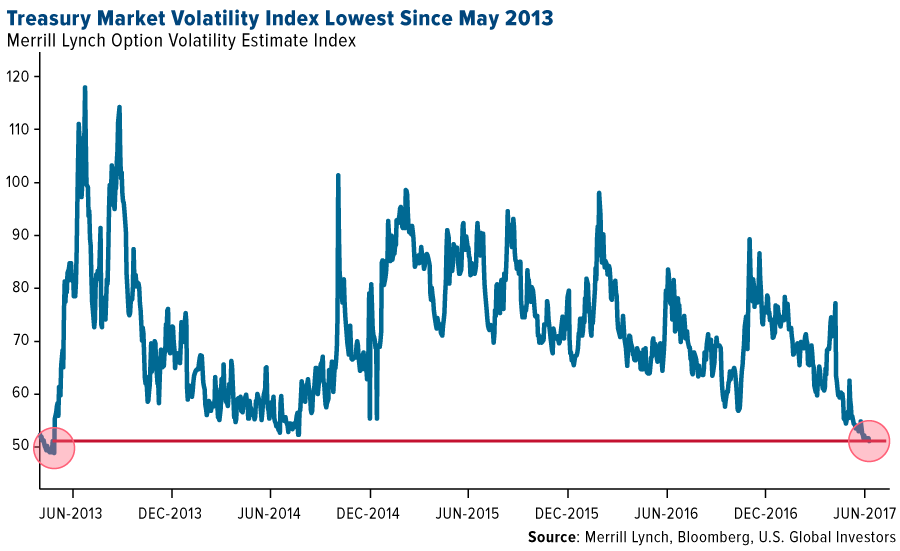
- A measure of volatility in the Treasuries market has fallen to levels that preceded the taper tantrum that shocked the bond world four years ago. The Merrill Lynch Option Volatility Estimate, which is derived from over-the-counter options on Treasuries maturing in two to 30 years, dropped to 51.1 last week, the lowest level since May 2013. Back then, shortly after the measure dropped to those levels, signals by the Federal Reserve that it would begin tapering its bond purchases sent the measure to the highest since 2010.
- The International Monetary Fund cut its outlook for the U.S. economy, removing assumptions of President Donald Trump’s plans to cut taxes and boost infrastructure spending to spur growth. The IMF reduced its forecast for U.S. growth this year to 2.1 percent from 2.3 percent and also cut its projection for next year to 2.1 percent, from 2.5 percent.
- According to Chris Krueger, an analyst at Cowen Washington Research Group, the Senate health care bill process "could end in a raging political dumpster fire.” With almost every other agenda item stuck behind healthcare reform, the pressure is on for republicans to deliver. Further, the Congressional Budget Office released its analysis of the Senate Republican health care bill and projected that 22 million fewer people would have coverage under the Better Care Reconciliation Act in 2026 than under the current health care system.
Gold Market
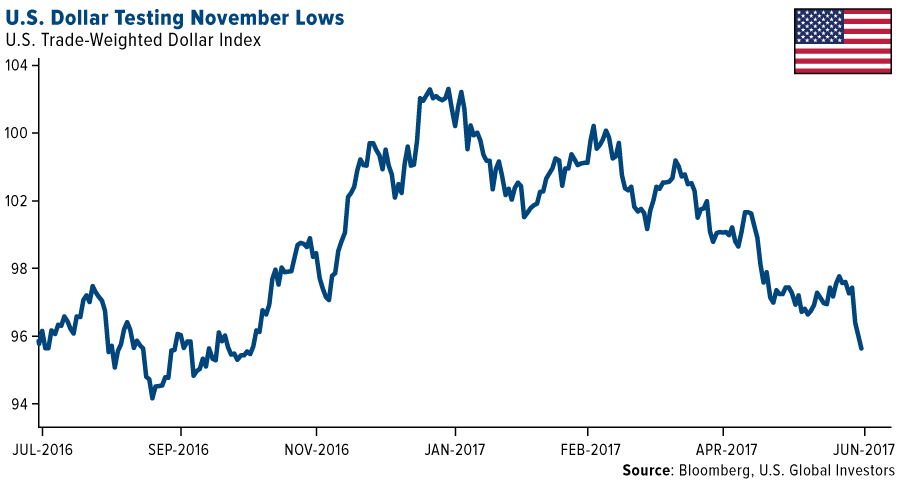
This week spot gold closed at $1,241.51, down $15.24 per ounce, or 1.21 percent. Gold stocks, as measured by the NYSE Arca Gold Miners Index, ended the week lower by 3.24 percent. Junior-tiered stocks outperformed seniors for the week, as the S&P/TSX Venture Index slipped just 1.35 percent. The U.S. Trade-Weighted Dollar Index finished the week significantly lower with a drop of by 1.66 percent.
| Date | Event | Survey | Actual | Prior |
|---|---|---|---|---|
| Jun-26 | Hong Kong Exports YoY | 7.9% | 4.0% | 701% |
| Jun-26 | Durable Goods Orders | -0.6% | -1.1% | -0.9% |
| Jun-27 | Conf. Board Consumer Confidence | 116.0 | 118.9 | 117.6 |
| Jun-29 | Germany CPI YoY | 1.4% | 1.6% | 1.5% |
| Jun-29 | U.S. GDP Annualized QoQ | 1.2% | 1.4% | 1.2% |
| Jun-29 | Initail Jobless Claims | 240k | 244k | 242k |
| Jun-30 | Eurozone CPI Core YoY | 1.0% | 1.1% | 0.9% |
| Jul-2 | Caixin China PMI Mfg | 49.8 | -- | 49.6 |
| Jul-3 | ISM Manufacturing | 55.2 | -- | 54.9 |
| Jul-6 | ADP Employment Change | 190k | -- | 253k |
| Jul-6 | Initail Jobless Claims | 243k | -- | 244k |
| Jul-7 | Change in Nonfarm Payrolls | 177k | -- | 138k |
Strengths
- The best performing precious metal for the week was silver, with a fall of just 0.51 percent with platinum just behind that. Following wild price swings on heavy volume Monday and Tuesday in a suspected erroneous trade, gold traders and analysts remained bullish for a second week, reports Bloomberg. On Monday, 1.8 million ounces of the yellow metal were sold in a single minute and on Tuesday prices spiked in early European trading with about 815,000 ounces of gold bought in five minutes – a suspected reverse on the Monday fat finger trade.
- The euro has climbed to a 13-month high on speculation that Mario Draghi’s ECB is poised to reduce unprecedented monetary stimulus, writes Bloomberg News. This has allowed Europeans to pay the least this year to buy gold, the article continues, while comments from Fed Chair Janet Yellen this week did little to support the U.S. currency.
- HKEK and the Chinese Gold & Silver Exchange Society signed MoU on Thursday to consider cooperation on matters such as product promotion and storage vaults, according to a statement on the Hong Kong Exchanges & Clearing website. MoU signifies strategic partnership that aims to build a major gold and commodities trading center in Asia Pacific, said CGSE President Haywood Cheung in a statement, reports Bloomberg.
Weaknesses
- The worst performing precious metal for the week was palladium, down 2.13 percent on money managers cutting their bullish bets on palladium futures to the least bullish level in three weeks. Bullion for immediate delivery is down around 2 percent in June, reports Bloomberg, and on course to end the longest run of monthly gains since 2010. Central banks around the world have taken a more hawkish stance on monetary policy, curbing the appeal of assets that don’t pay interest.
- On Monday, gold fell around $20 in a matter of seconds around 4am ET. While the yellow metal recovered a portion of those losses, it still traded down 1 percent. “No-one has a clue, apart from the unfortunate individual that pressed the wrong button,” David Govett, head of precious metals trading at Marex Spectron Group, said about the unusual plunge. Gold has gained 7.36 percent year-to-date, writes Bloomberg, but has struggled to break through its pre-election level of about $1,300.
- China’s gold imports from Hong Kong fell for a second month in May, reports Bloomberg, as world prices wavered. Data from the Hong Kong Census and Statistics Department show that the country purchased a net 44.8 metric tons, down from 74.9 tons in April.
Opportunities
- According to Bloomberg, global central bankers are all hinting that the cost of money is heading higher. Euro-area economic confidence jumped to its highest level since August 2007 and German inflation unexpectedly rose in June. In a note from BCA this week, the group writes: “If the U.S. dollar turns and the downside pressure on their currencies abate, emerging market central banks will no longer have to sell their FX reserves. If the banks take advantage of currency stability/strength to ease policy, it would underpin a cyclical improvement in their economies. EM assets and commodity prices, along with commodity currencies, would benefit if this would transpire.”
- There are two major developments that have emerged in the capital markets, writes Drew Mason of St. Joseph Partners. First, the dollar has broken its long-term major uptrend of more than a decade. Second, we’re seeing pressure on bonds, and long-term rates in particular are rising. And, despite these trends capping gold’s performance, gold (despite having no income stream attached to it as all the market pundits point out) has still outperformed the stock market since 2000 at a ratio of almost 2:1.
- Despite opposition from nearly the entire Trump Cabinet, the President and a few top advisers are “hell bent” on imposing tariffs on steel imports of 20 percent, reports Seeking Alpha. Penalties could eventually be extended to other imports too. In related sector news, Societe Generale raised its 2017 aluminum and gold price outlook, while cutting copper. Morgan Stanley listed palladium, gold and silver as its top picks, while cutting nickel.
Threats
- Tanzania’s parliament introduced three draft laws on Thursday, that would allow it to force mining and energy companies to renegotiate their contracts, reports CNBC. “They follow 18 months of wrangling between mining companies and President John Magufuli that have delighted Tanzanian voters but alarmed foreign investors,” the article continues. In a note from Luke Nelson at JP Morgan, the draft regulations contain a number of concerning provisions. For example, they suggest existing stability agreements could be renegotiated should the National Assembly find their terms to be “unconscionable.” Similarly, the drafts suggest future stabilization agreements shall be time bound and make provision for periodic renegotiation.
- Gabriel Resources is seeking $4.4 billion from Romania for destroying the value of the long-stalled gold mine project, reports Bloomberg. Gabriel says the government has unlawfully blocked permits, disregarded existing license rights and ignored all requests for conciliation and negotiation. The company was once worth more than C$2.7 billion, but its value has collapsed to a fraction of that, the article continues.
- Although historical patterns are all pointing to the fact that inflation should surge, these patterns may be in the process of breaking with history, reports Bloomberg. “Global labor markets have seen profound changes over the past decades, with significant implications for wage and price information,” the Bank for International Settlements said. “The question for many central banks is whether these developments have so weakened the relationship between inflation and labor-market slack that the recent tightening of labor markets poses little threat of an inflation overshoot.” Famous last words, perhaps.
Energy and Natural Resources Market
Strengths
- Crude was the best performing commodity this week. WTI prices rallied 7.5 percent for the five-day period as U.S. crude output dropped 100 thousand barrels per day (b/d) to 9.25 million b/d last week, the biggest drop in almost a year and third decrease in the last seven weeks, according to an Energy Information Administration (EIA) report. In addition, the Baker Hughes U.S. oil rig count dropped two to 756, the first drop in almost six months. The data above suggests we may have reached a seasonal production peak, leading crude prices higher for the seventh up-day in a row.
- The best performing sector this week was the MVIS Global Steel Producers Index. The index of global steel and iron ore producers rose 5.6 percent on the back of a strong recovery in iron ore prices. The move in iron ore prices has been attributed to a surprisingly strong demand from Chinese steel mills into quarter end.
- Rio Tinto LTD, the London-based major producer of raw materials, was the best performing stock this week, finishing up 8 percent. The company rallied on the back of strong iron ore and base metals prices. In addition, the company announced it reached an agreement to sell its Coal & Allied unit to China’s Yancoal International.
Weaknesses
- Palladium was the worst performing commodity this week, dropping 4 percent. Analysts are trimming 2017 forecasts for sales of new vehicles because of slower-than-predicted demand after General Motors Co. announced it was cutting its U.S. sales outlook for 2017 after its sales posted a 2 percent decline through May this year.
- The worst performing sector this week was the S&P/TSX Gold Index. The index fell 4 percent on the back of weaker gold prices. Gold prices dropped over 1 percent for the week, following a flash crash early Monday morning, and a set of positive macro data points coming out of Europe and China.
- The worst performing stock for the week was Goldcorp Inc. The Canadian senior gold producer dropped 8.5 percent as gold prices declined. In addition, the company announced two corporate events: the sale of its participation in the San Nicolas copper-zinc project, as well as its intention to acquire the remaining outstanding shares it doesn’t already own in Exeter Resource Corp.
Opportunities
- Commodities are set to rally in the second half, according to a recent Bloomberg story. With the U.S. dollar decline year-to-date, and trading at levels not seen since before the U.S. election, commodities should be posting strong returns due to their negative correlation to the greenback. However, this year has seen coincident commodity and dollar declines, a rare anomaly for the markets. Bloomberg reports this may be about to change--in the history of the Bloomberg Dollar Spot Index since 2004, the Bloomberg Commodity Index Total Return has never been down with the dollar off 6 percent or more on a six-month basis. With the dollar down almost 7 percent in 2017, past movements would suggest the potential for a strong recovery in the Bloomberg Commodity Index for the remainder of the year.
- China's manufacturing sector expanded for the 11th-straight month in June, indicating strength in the world's second-largest economy. The country's manufacturing purchasing managers' index (PMI) came in at 51.7 in June, up from 51.2 in May. Sub-indices for production and new orders came in at 54.4 and 53.1, respectively, up from 53.4 and 52.3 last month, indicating accelerated growth in both supply and demand, according to a news release by Xinhua News Agency.
- Iron ore has entered a bull market, rising 21 percent from the one-year low prices of $53.36 per tonne it reached on June 13. The rebound has been attributed to an unexpected increase in Chinese steel mill purchases into quarter end. Traditionally, bull markets are associated with continued strength in the commodity price.
Threats
- OPEC June oil output rose 280,000 barrels per day from last month, according to a Reuters survey. The June production numbers also mark the highest output level in 2017, mainly as a result of a marked recovery in production out of Nigeria and Libya.
- Both Saudi Aramco and Abu Dhabi National Oil Company are expected to lower the upcoming official selling prices of their respective crude products in view of recent trades, according to an S&P Platts story. Such pricing decisions usually correspond with weaker import demand out of China, suggesting the market remains oversupplied.
- U.S. natural gas futures logged their biggest second-quarter loss since 2013, dropping 5 percent, on speculation that July won’t be warm enough to boost demand and balance out the current supply glut, according to a Bloomberg story.
China Region
Strengths
- China’s official manufacturing PMI numbers came in positive for the month of June, increasing to 51.7 and beating all estimates compiled by a Bloomberg survey of economists, reports Bloomberg News. The non-manufacturing PMI also rose slightly to 54.9 in June from 54.5 in May.
- New export orders in China rose to 52.0 this month, the highest level since April 2012. The 1.3 percent surge suggests external demand pickup, which may help offset some of the deleveraging in China.
- The Shanghai Composite Index finished up 1.17 percent for the week.
Weaknesses
- The FTSE Bursa Malaysia KLCI closed down 83 basis points for the week, while Thailand’s SET Index finished down 47 basis points.
- Month-over-month industrial production in South Korea fell to a 0.2 percent growth rate, below expectations for a rate of 1.1 percent.
- Year-over-year exports from Hong Kong dropped to 4.0 percent, down from 7.1 percent in April and below expectations for a 7.1 percent number. Retail sales also missed in Hong Kong.
Opportunities
- Vietnam’s year-over-year second quarter GDP came in at a 5.73 percent growth rate, up from the prior quarter’s showing of 5.1 percent and ahead of expectations for a 5.5 print.
- Chinese bike-sharing giant Ofo Inc. announced its partnership with California-based Universal Pictures on Friday, reports ChinaDaily.com, rolling our new tailor-made bikes based on the Minions character in the Asian nation. “With the bike-sharing boom, there is a growing need for personalized user experiences,” Ofo CEO Fai Wei said. According to figures from the company, Ofo has provided more than 1 billion rides since its debut in 2015.
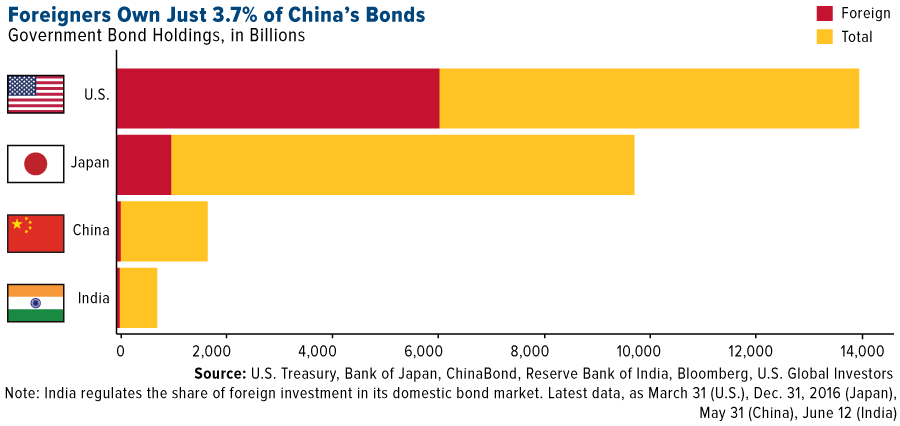
- China’s bond market, at $9.4 trillion, is the third-largest in the world. However, it has minimal foreign investment compared to other major bond markets. Nomura notes that if Chinese government bonds were to be included in global bond indexes, this would be a “major positive.” China’s new Bond-Connect program with Hong Kong is slated to open Monday.
Threats
- As U.S. President Trump hosted South Korea’s President Moon late this week at the White House, Trump insisted upon renegotiating trade with the East Asian country, calling attention to the current trade deficit. Trump also highlighted continued concerns about North Korea, referring to the U.S.-South Korea alliance as a cornerstone of peace in the region. Trump also hosted India’s Prime Minister Modi this week at the White House.
- Chinese President Xi Jinping visited Hong Kong on Friday for the 20th anniversary of its return to Chinese rule, reports Reuters. The leader of the Asian nation said that the city’s “one country, two systems” formula faces new challenges as pro-democracy campaigners ramped up protests, the article continues. Despite the promise of wide-ranging autonomy under the “two systems” agreement, people are worried about Beijing’s interference in the city’s affairs.
- Central banking policies and currency moves in the developed markets may continue to create outsized effects for emerging markets.
Emerging Europe
Strengths
- Turkey was the best performing country this week, gaining 80 basis points. Turkish President Recep Erdogan spoke with U.S. President Donald Trump amid tensions over Washington's decision to arm Syrian Kurdish forces fighting the Islamic State group. The details of their discussions were not provided, but the Turkish leader later also spoke with Russian President Vladimir Putin, according to Mahir Unal, a spokesman for Erdogan’s ruling party.
- The Czech kurona was the best performing currency this week, gaining 2.7 percent against the dollar. The central bank of Czech Republic left its main interest rate unchanged at a record low of 0.05 percent. Final gross domestic product was revised up to 3 percent from 2.9 percent year-over-year, and final quarterly GDP data was published at 1.5 percent versus prior reading 1.3 percent.
- Material sector was the best performing sector among eastern European markets this week.
Weaknesses
- Romania was the worst performing country this week, losing 5.9 percent. Mihai Tudose was appointed as a premier and the newly formed government proposed changes to the tax structure and pension system. Most of the ideas proposed have been discussed before, with the biggest surprise being to eliminate the second-pillar pension system, which holds about 40 billion lei ($10 billion) of voluntary contributions.
- The Turkish lira was the worst performing currency this week, losing 30 basis points against the dollar. Turkey’s trade gap widened to $7.31 billion in May, the biggest since 2014. Imports rose 21.7 percent year-over-year to $20.9 billion and exports rose 12.5 percent year-over-year to $13.6 billion. Increased imports were led by precious stones and metals--gold purchases from abroad rose 237 percent year-over-year to $2.23 billion.
- The telecommunication service sector was the worst performing sector among eastern European markets this week.
Opportunities
- The eurozone economic sentiment index strengthened more than expected to 111.1 in June, the highest since August 2007, from 109.2 in May. The strong increase in the consumer confidence reading validates the improving general economic situation.
- Russian gas producer Novatek aims to topple Qatar as the world’s biggest exporter of liquefied natural gas as it gets closer to completing its first LNG project. It is a long term project, but once completed it could produce more than 70 million tonnes of the liquefied gas annually. Last year, Qatar sold 77.2million tonnes, accounting for just under 30 percent market share, and Russia exported 10.8 million tonnes which accounted for a 4 percent market share.
- Eurozone inflation held up better than anticipated, as consumer prices rose by an annual 1.3 percent, down slightly from 1.4 percent the month before. The core inflation rate, which strips out the volatile items of food, alcohol, energy and tobacco, rose to 1.1 percent in the year to June from 0.9 percent. The increase in the core rate is a further sign that many prices are being pushed up by higher wages as unemployment across the region steadily falls and economic growth improves.
Threats
- Earlier this month the U.S. Senate voted 98-2 for new sanctions on Russia and this week the European Union extended sanctions on Russia by six months. Moscow will continue to have limited ability to raise capital as European businesses cannot borrow or lend money to Russia’s five main state owned banks for more than 30 days. The sanctions also include an export and import ban on arms sales and limit the country’s access to technology that can be used for oil production. In retaliation, Russia extended sanctions on food imports from Europe until the end of next year.
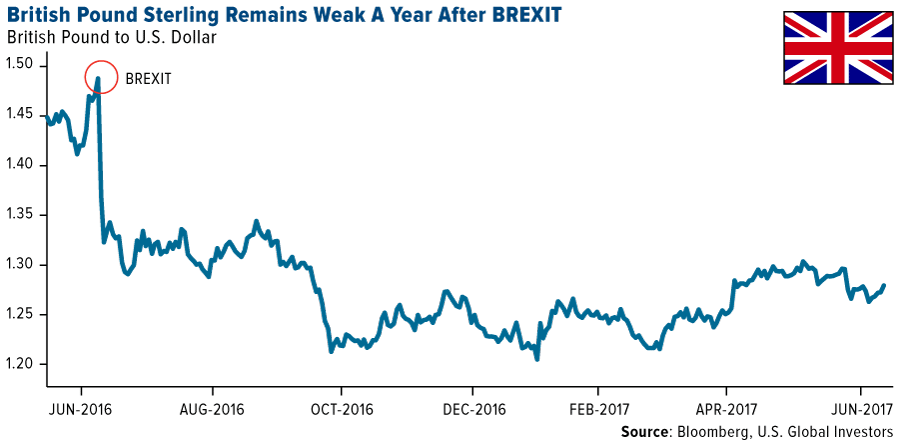
- The British pound remained weak over the past year despite the good economic performance in Great Britain. Real GDP growth has averaged 0.4 percent per quarter over the past year – only a notch below its historical trend. But the pound may remain weakened, until there is more progress in the UK-EU Brexit talks.
- The Czech National Bank signaled that economic growth and wage increases were robust enough to start tightening later his year. Liam Carsen, emerging Europe economist at Capital Economics, sees policy rate rising to 1 percent by the end of the next year, with the first hike at August’s meeting. This may be more tightening than the markets are currently pricing in.
Leaders and Laggards
| Index | Close | Weekly Change($) |
Weekly Change(%) |
|---|---|---|---|
| DJIA | 21,080.28 | +275.44 | +1.32% |
| S&P 500 | 2,415.82 | +34.09 | +1.43% |
| S&P Energy | 487.49 | -10.66 | -2.14% |
| S&P Basic Materials | 331.59 | +3.17 | +0.97% |
| Nasdaq | 6,210.19 | +126.49 | +2.08% |
| Russell 2000 | 1,382.24 | +14.91 | +1.09% |
| Hang Seng Composite Index | 3,487.96 | +61.95 | +1.81% |
| Korean KOSPI Index | 2,355.30 | +66.82 | +2.92% |
| S&P/TSX Global Gold Index | 209.47 | -2.55 | -1.20% |
| XAU | 84.65 | -0.51 | -0.60% |
| Gold Futures | 1,270.10 | +13.30 | +1.06% |
| Oil Futures | 49.77 | -0.56 | -1.11% |
| Natural Gas Futures | 3.24 | -0.02 | -0.61% |
| SS&P/TSX Venture Index | 808.59 | +1.69 | +0.21% |
| 10-Yr Treasury Bond | 2.25 | +0.01 | +0.54% |
| Index | Close | Monthly Change($) |
Monthly Change(%) |
|---|---|---|---|
| DJIA | 21,080.28 | +105.19 | +0.50% |
| S&P 500 | 2,415.82 | +28.37 | +1.19% |
| S&P Energy | 487.49 | -16.42 | -3.26% |
| S&P Basic Materials | 331.59 | -4.68 | -1.39% |
| Nasdaq | 6,210.19 | +184.97 | +3.07% |
| Russell 2000 | 1,382.24 | -37.19 | -2.62% |
| Hang Seng Composite Index | 3,487.96 | +117.30 | +3.48% |
| Korean KOSPI Index | 2,355.30 | +147.46 | +6.68% |
| S&P/TSX Global Gold Index | 209.47 | +4.21 | +2.05% |
| XAU | 84.65 | +1.34 | +1.61% |
| Gold Futures | 1,270.10 | +2.50 | +0.20% |
| Oil Futures | 49.77 | +0.15 | +0.30% |
| Natural Gas Futures | 3.24 | +0.09 | +2.99% |
| SS&P/TSX Venture Index | 808.59 | +1.92 | +0.24% |
| 10-Yr Treasury Bond | 2.25 | -0.06 | -2.47% |
| Index | Close | Quarterly Change($) |
Quarterly Change(%) |
|---|---|---|---|
| DJIA | 21,080.28 | +258.52 | +1.24% |
| S&P 500 | 2,415.82 | +48.48 | +2.05% |
| S&P Energy | 487.49 | -29.04 | -5.62% |
| S&P Basic Materials | 331.59 | +2.37 | +0.72% |
| Nasdaq | 6,210.19 | +364.89 | +6.24% |
| Russell 2000 | 1,382.24 | -12.28 | -0.88% |
| Hang Seng Composite Index | 3,487.96 | +214.74 | +6.56% |
| Korean KOSPI Index | 2,355.30 | +261.18 | +12.47% |
| S&P/TSX Global Gold Index | 209.47 | -7.03 | -3.25% |
| XAU | 84.65 | -3.97 | -4.48% |
| Gold Futures | 1,270.10 | +5.50 | +0.43% |
| Oil Futures | 49.77 | -4.22 | -7.82% |
| Natural Gas Futures | 3.24 | +0.61 | +23.18% |
| SS&P/TSX Venture Index | 808.59 | -27.68 | -3.31% |
| 10-Yr Treasury Bond | 2.25 | -0.07 | -2.85% |
U.S. Global Investors, Inc. is an investment adviser registered with the Securities and Exchange Commission ("SEC"). This does not mean that we are sponsored, recommended, or approved by the SEC, or that our abilities or qualifications in any respect have been passed upon by the SEC or any officer of the SEC.
This commentary should not be considered a solicitation or offering of any investment product.
Certain materials in this commentary may contain dated information. The information provided was current at the time of publication.
Some links above may be directed to third-party websites. U.S. Global Investors does not endorse all information supplied by these websites and is not responsible for their content.
All opinions expressed and data provided are subject to change without notice. Some of these opinions may not be appropriate to every investHoldings may change daily.
Holdings may change daily. Holdings are reported as of the most recent quarter-end. The following securities mentioned in the article were held by one or more accounts managed by U.S. Global Investors as of 03/31/2017:
Barrick Gold Corp
Franco-Nevada
Newmont Mining
Osisko Gold Royalties Ltd.
Royal Gold, Inc.
Sandstorm Gold Ltd.
Wheaton Precious Metals Corp.
The Dow Jones Industrial Average is a price-weighted average of 30 blue chip stocks that are generally leaders in their industry.
The S&P 500 Stock Index is a widely recognized capitalization-weighted index of 500 common stock prices in U.S. companies.
The Nasdaq Composite Index is a capitalization-weighted index of all Nasdaq National Market and SmallCap stocks.
The Russell 2000 Index® is a U.S. equity index measuring the performance of the 2,000 smallest companies in the Russell 3000®, a widely recognized small-cap index.
The Hang Seng Composite Index is a market capitalization-weighted index that comprises the top 200 companies listed on Stock Exchange of Hong Kong, based on average market cap for the 12 months.
The Taiwan Stock Exchange Index is a capitalization-weighted index of all listed common shares traded on the Taiwan Stock Exchange.
The Korea Stock Price Index is a capitalization-weighted index of all common shares and preferred shares on the Korean Stock Exchanges.
The Philadelphia Stock Exchange Gold and Silver Index (XAU) is a capitalization-weighted index that includes the leading companies involved in the mining of gold and silver.
The U.S. Trade Weighted Dollar Index provides a general indication of the international value of the U.S. dollar.
The S&P/TSX Canadian Gold Capped Sector Index is a modified capitalization-weighted index, whose equity weights are capped 25 percent and index constituents are derived from a subset stock pool of S&P/TSX Composite Index stocks.
The S&P 500 Energy Index is a capitalization-weighted index that tracks the companies in the energy sector as a subset of the S&P 500.
The S&P 500 Materials Index is a capitalization-weighted index that tracks the companies in the material sector as a subset of the S&P 500.
The S&P 500 Financials Index is a capitalization-weighted index. The index was developed with a base level of 10 for the 1941-43 base period.
The S&P 500 Industrials Index is a Materials Index is a capitalization-weighted index that tracks the companies in the industrial sector as a subset of the S&P 500.
The S&P 500 Consumer Discretionary Index is a capitalization-weighted index that tracks the companies in the consumer discretionary sector as a subset of the S&P 500.
The S&P 500 Information Technology Index is a capitalization-weighted index that tracks the companies in the information technology sector as a subset of the S&P 500.
The S&P 500 Consumer Staples Index is a Materials Index is a capitalization-weighted index that tracks the companies in the consumer staples sector as a subset of the S&P 500.
The S&P 500 Utilities Index is a capitalization-weighted index that tracks the companies in the utilities sector as a subset of the S&P 500.
The S&P 500 Healthcare Index is a capitalization-weighted index that tracks the companies in the healthcare sector as a subset of the S&P 500.
The S&P 500 Telecom Index is a Materials Index is a capitalization-weighted index that tracks the companies in the telecom sector as a subset of the S&P 500.
The NYSE Arca Gold Miners Index is a modified market capitalization weighted index comprised of publicly traded companies involved primarily in the mining for gold and silver.
The Consumer Price Index (CPI) is one of the most widely recognized price measures for tracking the price of a market basket of goods and services purchased by individuals. The weights of components are based on consumer spending patterns.
The Purchasing Manager’s Index is an indicator of the economic health of the manufacturing sector. The PMI index is based on five major indicators: new orders, inventory levels, production, supplier deliveries and the employment environment.
The S&P/TSX Venture Composite Index is a broad market indicator for the Canadian venture capital market. The index is market capitalization weighted and, at its inception, included 531 companies. A quarterly revision process is used to remove companies that comprise less than 0.05% of the weight of the index, and add companies whose weight, when included, will be greater than 0.05% of the index.
The Merrill Lynch Option Volatility Estimate Index is a yield curve weighted index of the normalized implied volatility on 1-month Treasury options which are weighted on the 2, 5, 10, and 30 year contracts.
There is no guarantee that the issuers of any securities will declare dividends in the future or that, if declared, will remain at current levels or increase over time.
The Philadelphia Gold and Silver Index (XAU) is a capitalization-weighted index that includes the leading companies involved in the mining of gold and silver.
The S&P/TSX Global Gold Index is an international benchmark tracking the world's leading gold companies with the intent to provide an investable representative index of publicly-traded international gold companies.
The Consumer Confidence Index (CCI) is an indicator which measures consumer confidence in the Economy.
The S&P/Case-Shiller Index tracks changes in home prices throughout the United States by following price movements in the value of homes in 20 major metropolitan areas.
The Ifo Business Climate Index is a widely observed early indicator for economic development in Germany.
The European Commission Economic SentiMent Indicator Eurozone is a monthly indicator that reflects general economic activity of the EU. The indicator combines assessments and expectations stemming from business and consumer surveys. Such surveys include different components of the economy: industry, consumers, constructions and retail trade.
The Bloomberg Dollar Spot Index (BBDXY) tracks the performance of a basket of 10 leading global currencies versus the U.S. Dollar.
Cash Flow is a measure of the amount of cash generated by a company’s normal business operations.
The European Commission Economic SentiMent Indicator Eurozone is a monthly indicator that reflects general economic activity of the EU. The indicator combines assessments and expectations stemming from business and consumer surveys. Such surveys include different components of the economy: industry, consumers, constructions and retail trade.
The MVIS Global Steel Index (MVSLX) covers the largest and most liquid companies which are active in the steel sector. The index is reviewed on a quarterly basis, float market capitalization weighted, and the maximum component weight is 8 percent.
The S&P/TSX Global Gold Index is an international benchmark tracking the world's leading gold companies with the intent to provide an investable representative index of publicly-traded international gold companies.
The U.S. Trade Weighted Dollar Index provides a general indication of the international value of the U.S. dollar.
The Bloomberg Dollar Spot Index (BBDXY) tracks the performance of a basket of 10 leading global currencies versus the U.S. Dollar.
The Bloomberg Commodity Index is made up of 22 exchange-traded futures on physical commodities. The index represents 20 commodities, which are weighted to account for economic significance and market liquidity.
The Shanghai Composite Index (SSE) is an index of all stocks that trade on the Shanghai Stock Exchange.
The Kuala Lumpur Stock Exchange Composite Index (KLCI) is a broad-based capitalization-weighted index of 100 stocks designed to measure the performance of the Kuala Lumpur Stock Exchange.
The Bangkok SET Index is a capitalization-weighted index of all the stocks traded on the Stock Exchange of Thailand.
Save


