
“The hardest part in trying to limit losses is not necessarily timing the market, but imparting the wisdom of limiting losses upon your clients.
To limit drawdowns advisors and their clients cannot fully embrace raging bull markets that are excessively valued.
They must also have the iron stomach required to buy when everyone else is selling and assets are cheap.”
I enjoy reading 720 Global’s research blog. Quick, crisp and to the point. The point in their most recent piece is tied to human behavioral tendencies and ego. Ultimately, it’s about how this awareness should be factored into our investment thinking.
In their piece, they told a story about NBA great Rick Barry. Do you remember him? He shot his free throws underhand, a.k.a. “granny” style. From the piece:
In 1962, Wilt Chamberlin scored 100 points in a single game, which to this day stands as a record. Less well known is, in that same game, he made 28 free throws which is also a single game record. Chamberlin, a career 51% free thrower shooter, shot 88% from the free throw line on that record-breaking night. It was not a fluke. That was the only game of his career that he shot free throws underhanded.
Despite his historic achievement that night, he never shot underhanded again. In his words “I felt silly, like a sissy shooting underhanded. I know I was wrong… I just couldn’t do it.”
Malcolm Gladwell, in his podcast series Revisionist History – The Big Man Can’t Shoot, highlights how ego, pride and the opinion of the masses can prevent us from doing the smart thing. Investing is much the same. Our brain is somehow wired to copy people… follow the herd, blend in. To act counter to the majority may prove embarrassing. Shooting granny style is silly. Except it works.
Last night at dinner, we discussed what my son, Matthew, is learning in his macroeconomics class. I was actually impressed. Such teachings are largely absent in our schools. Missed are some of the most important basics. The most important miss to me is the lack of understanding in math in how money compounds. He and his classmates now get it. Losses have to be minimized for the math to work; yet, too few think about employing a loss management process.
Why? I believe it takes time, requires discipline and requires you to do something that at times (like 1999 and 2007) require you to go against the crowd. It requires you to risk being wrong at times when you neighbor is right. Rick Barry explains why shooting underhanded is not only more natural but produces a softer shot which increases the probability of it going through the hoop. For investing, the growth is in the math and the math works when you limit your downside.
“Most investors are primarily oriented toward return, how much they can make and pay little attention to risk, how much they can lose.”
— Seth Klarman

In a separate piece “Limiting Losses,” 720 Global examples two simple scenarios to why limiting drawdowns is essential to building wealth. From the piece:
- Scenario A is a buy-and-hold portfolio with a 100% allocation to the S&P 500 at all times.
- In scenario B, the portfolio is also fully allocated to the S&P 500 except during the bear markets of 2000 (1/1/2000 – 3/31/2002) and 2008 (10/01/2007-04/30/09).
- During those bear markets, the portfolio had a 50% allocation to the S&P 500 and the other half was in cash. At the troughs of the downturns, portfolio B shifted back to a 100% equity position.
The graphs and table below show the cumulative total percentage return, cumulative annualized percentage return and other relevant performance statistics for both scenarios.

Source: 720 Global
“No one can time the market perfectly in the manner described in this scenario (SBB here – and I certainly wouldn’t recommend this particular process), but the point of the analysis is to illustrate just how important it is to avoid large losses. There are two big takeaways from the data above. The most obvious is the significant difference in returns over the period. After two bull and bear market cycles, scenario B’s value grew at a significantly faster clip than that of scenario A,” they noted.
It is also worth noting that from 2000-2012, scenario A’s return was negative 72% of the time over those 12 years. (SBB here — 72% of the time.) Scenario B produced positive cumulative returns uninterrupted since 2004 despite the second large drawdown in 2008 and was negative only 21% of the time. A far better emotional ride for the investor.
Further on point, “Compounding and the illusion of percentages are key factors that help explain why losses are hard to recover. Equal percentage gains and percentage losses are not, in fact, equal. This may sound confusing, but again consider an investor with $100,000. If the investor loses 25%, the portfolio value is only $75,000. A 33% gain ($25,000/$75,000) is then needed to regain the original 25% loss. The table below shows the percentage gains required to offset percentage losses. As highlighted, the gains necessary to recapture losses are manageable with limited losses but they get increasingly more challenging as percentage losses increase.”
The message is simply another gentle reminder that the ability to suppress the ego is needed if one is to mitigate the potential consequences of the current market bubble.
Source: 720 Global
You can read the full piece “Play the Game to Win” here and also their excellent piece “Limiting Losses” here.
Next week we’ll take another look at April 2017 month-end valuations. We’ll see the equity market remains expensively priced and forward 7-year and 10-year return probabilities remain low (estimated at approximately -2% to +3% nominal).
Rick Barry once approached Shaquille O’Neal about trying his underhand style. Shaq’s reply was “I’d rather shoot zero.” Investing requires work and to be successful, as Rick Barry pointed out, the best odds of success are doing something that may look and feel unconventional. It’s hard to go against the crowd at market extremes. I’d rather shoot 90% underhand. Or like Wilt Chamberlin, shoot 88% underhand vs. 51% average. But that wasn’t somehow good enough for him to stick with the process.
I believe a majority of investors do the same with their money. I believe if we are aware of risks, we will be better prepared to act on the opportunities that risk dislocations create. Putting a risk management plan in place is not hard to do nor does it look as silly as a grown man shooting underhand but is does require work; it requires discipline, conviction and the courage to stay on plan. Limiting losses and controlling drawdowns is paramount to successful long-term wealth accumulation.
Grab a coffee and find your favorite chair. Below I touch on tax reform and today’s low GDP number and share with you a few great charts from JP Morgan Asset Management. You’ll find several risk management processes that I favor posted each week in the Trade Signals blog (link below). Please feel free to reach out to me if you have any questions. Put risk management into your investment process and don’t be afraid to shoot granny style.
? If you are not signed up to receive my weekly On My Radar e-newsletter, you can subscribe here. ?
Included in this week’s On My Radar:
- The Era of Financial Engineering
- Charts of the Week
- Trade Signals — Bullish Equity and Fixed Income Trends Remain; Sentiment Neutral
- Personal Note — Sonoma
The Era of Financial Engineering
As a precursor to next week’s valuation and forward return update, I thought I’d share with you an interesting thought around what I believe is largely routine for corporate CFO’s nowadays in this era of creative financial engineering. Ned Davis wrote an excellent piece about IBM that suggested that IBM might be the poster child for such practices.
IBM’s sales growth has fallen and has actually been negative since 2015 (chart below), despite many acquisitions. However, through acquisitions and creative accounting, such as non-recurring write-offs to lower taxes, IBM has reported better-than-expected earnings almost every quarter.
Here’s how you read the chart:
- The upper section of the chart shows IBM’s sales growth has fallen to nearly 0%
- The bottom section shows how earnings were aided by a steep drop in IBM’s effective tax rate
The point isn’t to throw IBM under the bus. They are doing what they should be doing in regards to legally maximizing their tax opportunities. The point is that this may tell us something about U.S. economic growth rates since 2000 overall. It may also tell us that if a company cannot grow its year-over-year sales, we should not simply look at the earnings numbers, as they may have been reached by creative engineering of earnings.
When we look at price relative to earnings next week, I believe it is fair to say that the high prices relative to current earnings may be actually more out of skew than in past points in history due to creatively engineering earnings much as IBM has done.
Again, not a bad thing, but we have to wonder how much room remains for additional engineering. IBM has successfully adapted over many years and likely will in the future. But sales growth matters and we should consider that in comparison to current earnings and how they were calculated. Bottom line: The market is very richly priced.
Charts of the Week
Chart 1: S&P 500 Forward P/E, Dividend Yield and 10-year Treasury yield at inflection points
Here’s how to read the chart:
- Red arrows show forward P/Es when the market peaked (today’s 17.5x number (based on overly optimistic Wall Street estimates is higher than the 2007 peak)
- Green arrows show forward P/Es when the market bottomed
- Red circle – take a look at dividend yields and 10-year Treasury yields at peaks
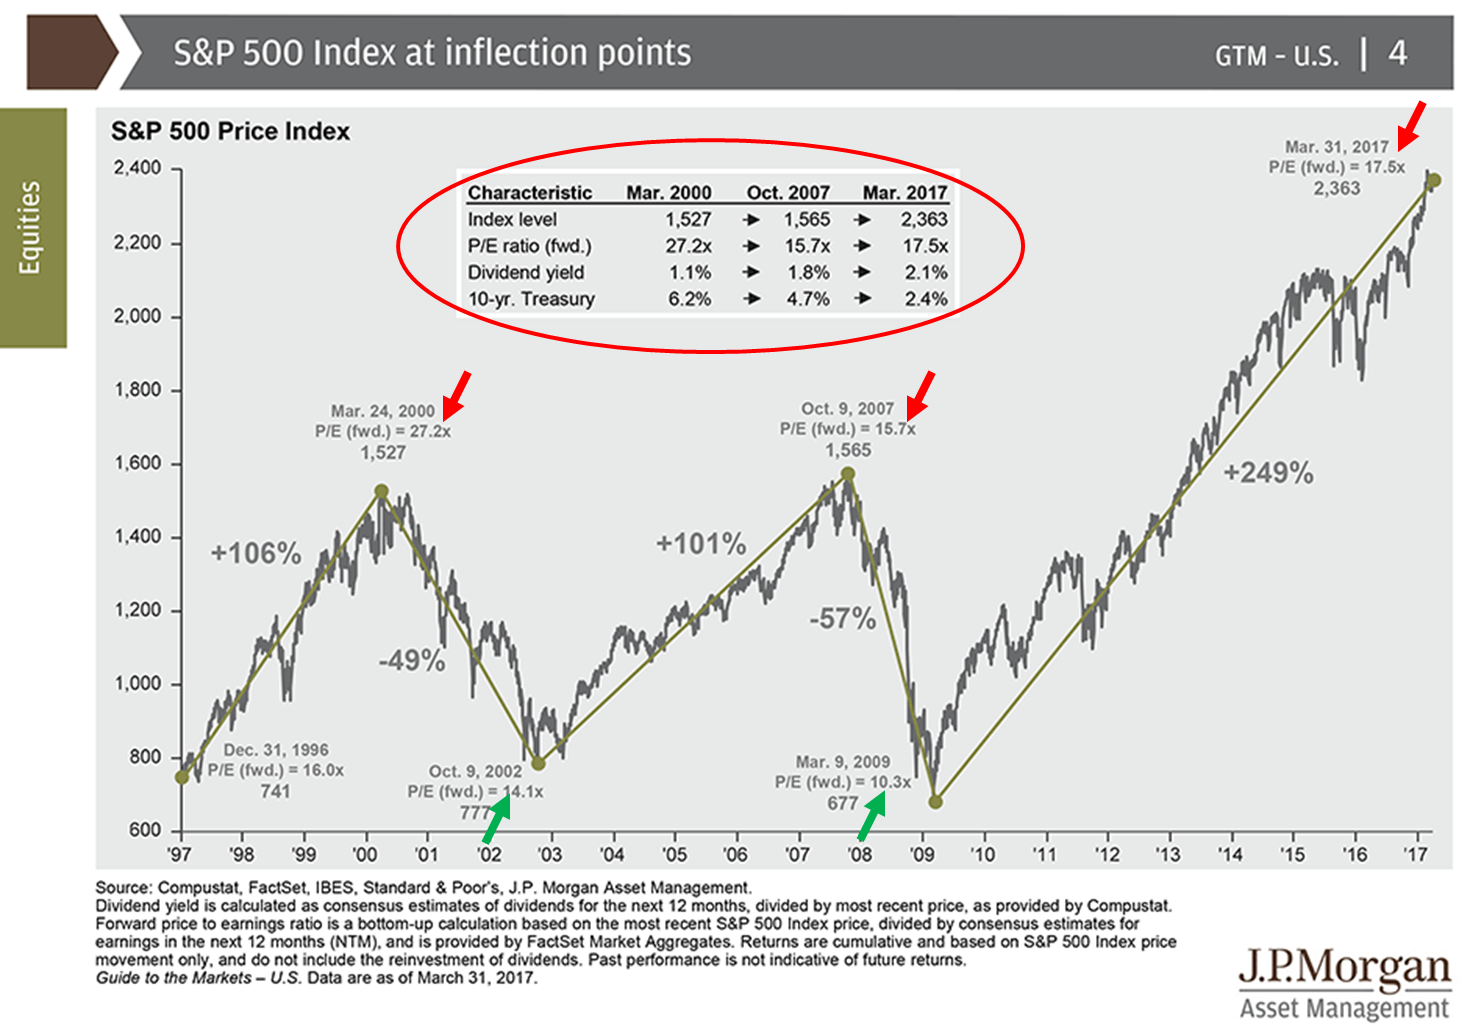
Chart 2: Annual Returns and Intra-year Declines
Here’s how to read the chart:
- Solid bar shows the return in % for the year
- The red negative numbers show the intra-year declines each year
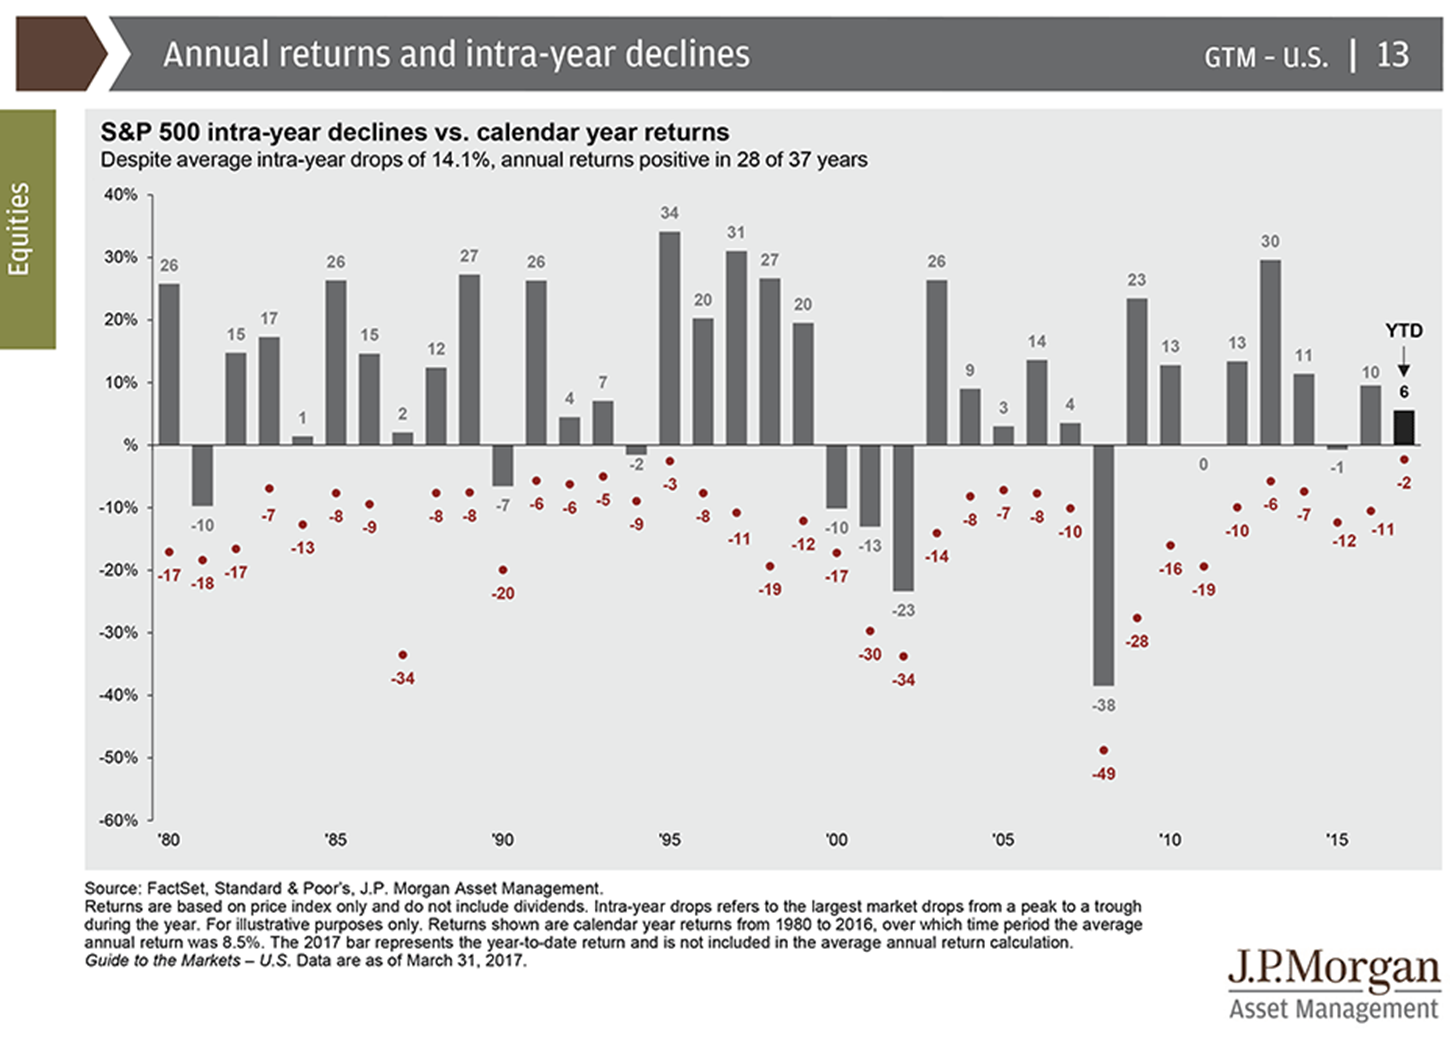
Chart 3: The length and strength of economic expansions
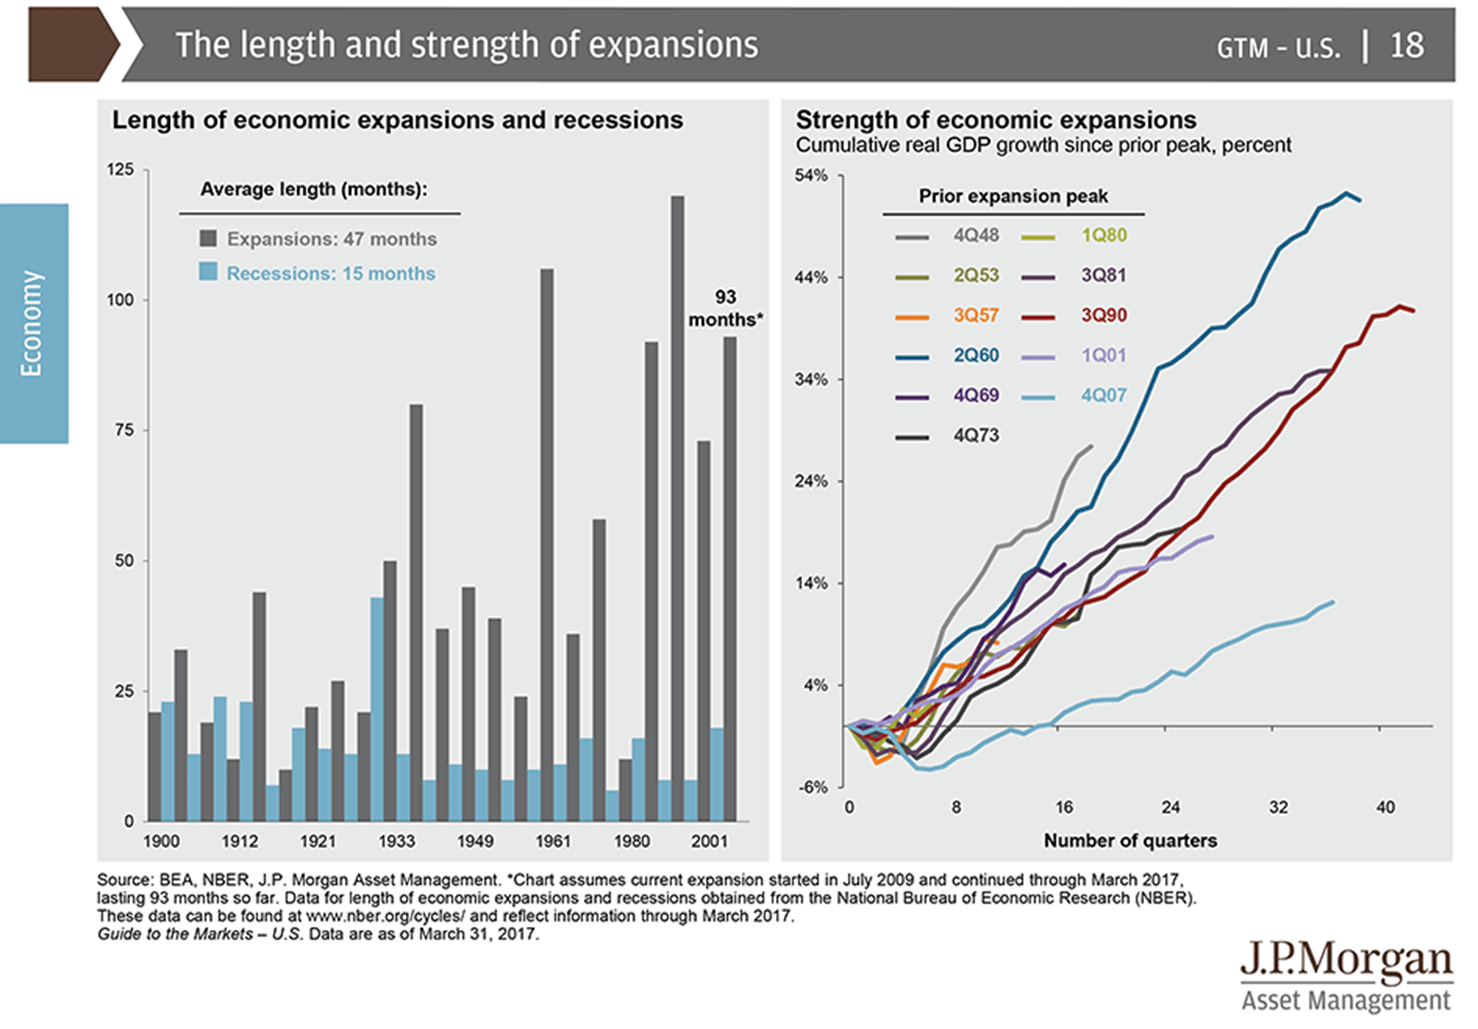
Chart 4: Consumer confidence and the stock market
Here’s how to read the chart:
- The chart is a plot of the University of Michigan Consumer Sentiment Index from 1970 to present.
- As you view the chart, think about the data this way: when consumer sentiment is optimistic (high), it is generally bearish for the market in terms of forward returns. When consumer sentiment is pessimistic (low), it is generally bullish for the market. Not too dissimilar with the “you want to buy when everyone else is selling and sell when everyone else is buying.”
- What moves the market is supply and demand. More buyers than sellers bids prices up. The logic in this chart is that by the time investors are optimistic they are largely fully invested in stocks. So less buying power to drive prices higher. With the reverse being true when consumer sentiment is low.
- The green arrows mark the low points in the “consumer sentiment index” and the subsequent 12-month return for the S&P 500 Index (which excludes dividends).
- The red arrows mark the peaks in consumer sentiment and also show the subsequent 12-month return.
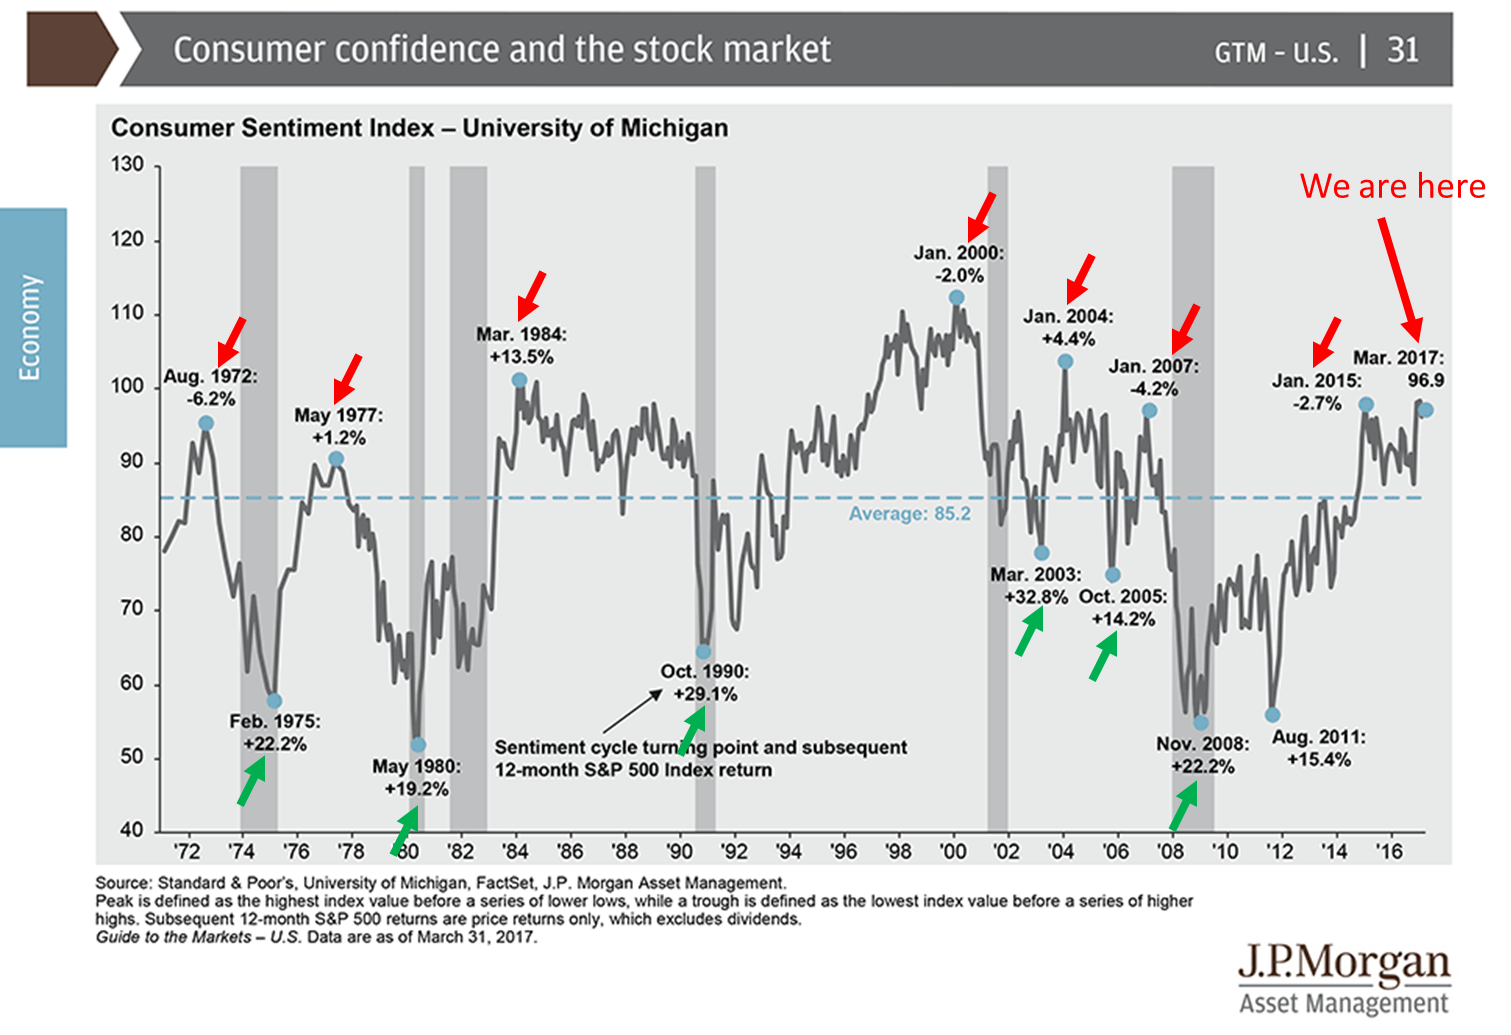
We’ll look at April month-end valuations next week. What caught my eye in Chart 4 above is that this gives a feel for what 12-month returns might look like. Past performance guarantees us ziltch, nada, zippo.
Chart 5 – Tax Reform
Source: The Wall Street Journal
Source: The Wall Street Journal
Chart 6: Atlanta Fed’s GDPNow projecting 0.2 GDP growth for Q1
GDP was reported at 8:30am today. This from Market Watch: U.S. economy bogs down in first quarter with slowest growth in 3 years, GDP shows.
This from CNBC: US first-quarter growth weakest in three years, as consumer spending falters.
No matter how you slice and dice it: GDP growth is poor.
Chart 7: European Central Bank in the news this week
Source: WSJ – The Daily Shot
Trade Signals – Bullish Equity and Fixed Income Trends Remain; Sentiment Neutral
S&P 500 Index — 2,394 (4-26-2017)
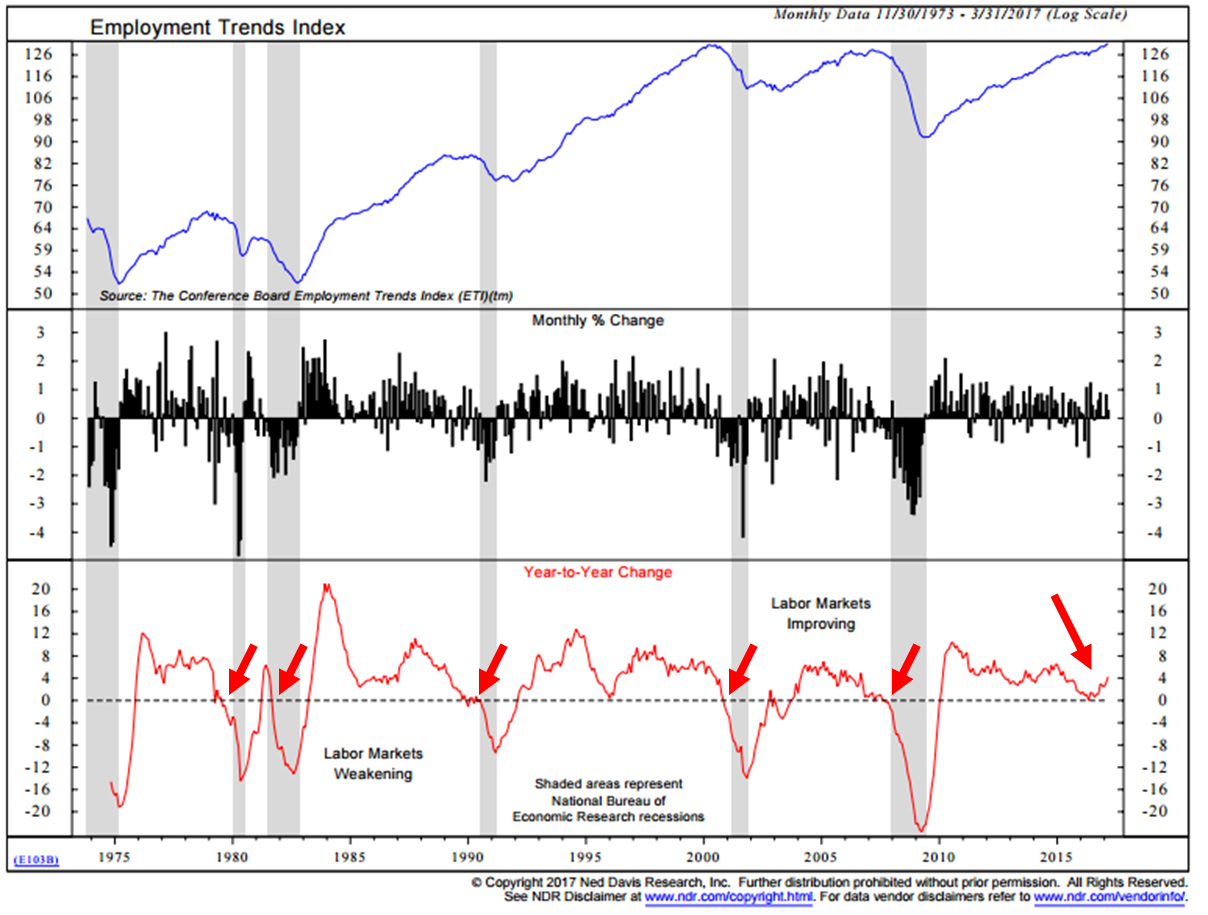
Notable this week: I thought I’d share with you one of my favorite recession watch charts. In short, no sign of recession. The small red arrows show the point at which the monthly percentage change in the Employment Trends Index turned negative. The slightly larger red arrow on the bottom right shows where we are today. I’ll be sharing this data with you from time to time.
Trend signals: The Zweig Bond Model remains in a buy signal. The equity market, as measured by the Ned Davis Research CMG U.S. Large Cap Long/Flat Index, remains bullish. The CMG Managed High Yield Bond Program remains in a buy signal. The CMG Tactical Fixed Income is positioned in muni bonds and emerging market sovereign debt. The CMG Tactical All Asset Index is positioned 45% in equities and 55% in fixed income (seeing a meaningful reallocation to fixed income). Both the long-term and short-term gold trend indicators are in buy signals (suggesting some exposure to gold). Investor sentiment is neutral – neither excessively optimistic nor pessimistic, which is historically neutral for equities.
On the economic front: from global and domestic perspectives, risk of recession remains low; however, risk of inflation is elevated and warrants monitoring.
Click here for the charts and explanations.
Personal Note — Sonoma
Sonoma was beautiful. My only previous visit was to attend my fraternity brother’s wedding nearly 30 years ago. It was foggy then and I didn’t get the full picture… though the wine was yummy. This past week, we co-hosted a dozen advisors at the Fairmont Sonoma Inn and Spa. We did a wine tour, had dinner in an underground cellar, met in the mornings and had Tuesday and Wednesday afternoons free. I’m checking in happy!
I’ll be in NYC next Thursday for a video interview with S&P Global as it relates to our Ned Davis Research CMG U.S. Large Cap Long/Flat Index. S&P is the calculation agent for the index and we’re really excited to be working closely with them (and my friends at Ned Davis Research and VanEck). Dallas follows on May 17-18 for a Mauldin Solutions Advisor Due Diligence Meeting. I see a lot more of Dallas in my future… we are one of four ETF strategists selected by John for his Mauldin Solutions Smart Core investment strategy. An exciting opportunity for us.
I’ll be in Orlando on May 22-25 for the Strategic Investment Conference. I’ll be taking notes and sharing them with you. The line-up includes David Rosenberg, Dr. Lacy Hunt, Mark Yusko, Neil Howe, Ian Bremmer and David Zervos from Jeffries. You can learn more about the conference here.
It’s good to be home. The weekend weather is looking pretty good and it’s time to get the outdoor furniture back out. It almost has become a bit of a yearly ritual. Hate when we store it away, love the feeling when we bring it back out. Good thing Susan and I have so many boys. An easier job now that they are young men.
An ice cold Head Hunter IPA while sitting in the backyard sounds like the perfect remedy to a productive but long week. Sharing that beer with Susan, well, priceless. I’m a lucky man.
Hope you have fun plans in your immediate future and time shared with those you love most.
Have a wonderful weekend!
If you find the On My Radar weekly research letter helpful, please tell a friend … also note the social media links below. I often share articles and charts during the week via Twitter and LinkedIn that I feel may be worth your time. You can follow me on Twitter @SBlumenthalCMG and on LinkedIn.
? If you are not signed up to receive my weekly On My Radar e-newsletter, you can subscribe here. ?
With kind regards,


