
How using different infographic makers can help with your presentation of financial data
In the investing business, presenting large number of datasets can be challenging. Financial dataset can be too complex to decipher and too boring to hold people’s attention. I personally have more than one trader/analyst friend with permanent bloodshot eyes from intensely staring at flashing stock charts and price lines often end. Don’t you wish you are looking at something more visually interesting than green lines moving up and down on a black screen?
Luckily our ingenius ancestors have already invented a better way to present information visually without losing all the important details. Infographics – short for information graphics – can radically improve the way financial data is communicated for their fully intended effect.
Infographics communicate importance of data by assigning it visual meaning. Want to highlight a spike in stock trends? Give it a different color. Looking for a way to highlight a company’s dominant market share? Try pie chart. Moreover, many leading financial media graphics departments such as WSJ have been experimenting with interactive infographics. Your financial data can tell a better story if you can let your audience find out the surprise on their own.
If you are deterred by the word “design” – being a fianncial wiz you are far from an artist – fret no more. There are tons of infographic makers loaded with professional grade templates out there for non-designers like you. As long as you’ve structured your data to tell a story, you can simply populate the template with the finance data without ever needing to learn design.
Here we walk you through a list of the best infographic makers so you can make a choice wisely.
Top 5 Best Online Infographic Makers
If you were to compare the Web to a huge, global classroom, then visual content, especially infographics, would be the popular kid in the class. They not only receive three times more “likes” than other types of online content, they also get a lot more “shares.”

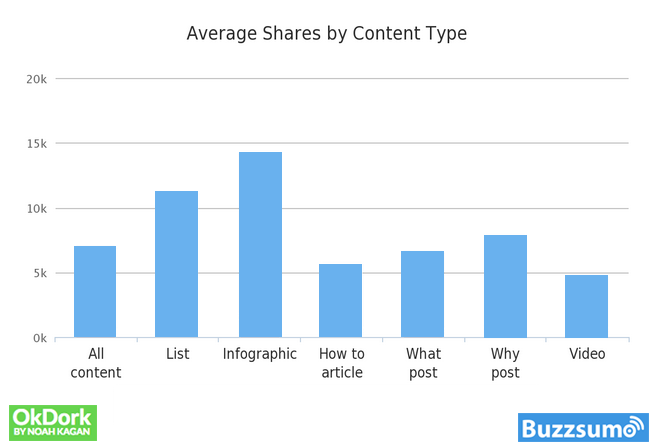
The reason for this is quite simple: 90% percent of the information processed by the brain is visual. Not only that, but visuals are reportedly processed 60,000 times faster than text alone.
It makes sense then that since 2010, infographics have steadily risen in popularity–and they’re only getting more popular as time goes on:
The only problem with infographics, however, is that they require a significant amount of time to produce–at least several days’ worth of work if you want to design a high-quality one that will go viral. And if you want to create one from scratch, you’ll have to invest in some pricey desktop software such as Adobe Illustrator or Photoshop.
On the other hand, there are now dozens of free online infographic makers that allow you to create your own professional-looking infographics in a fraction of the time it takes to do them on your own.
To help you choose which software best meets your needs, we’ve compiled a handy guide with a list of features and pros and cons for each online infographic maker.
Top 5 Best Online Infographic Tools
1 Visme
Unlike most of the tools on this list, Visme offers users the ability to create other visual content besides infographics, such as presentations, reports, social media memes, resumes, product demos, among other things.
Its easy-to-use drag-and-drop software is perfect for people with little to no design experience as it offers them hundreds of beautifully designed templates, thousands of graphic assets, chart tools in a variety of styles and millions of free, searchable images.
Of all the different options out there, Visme is one of the few infographic tools that is both simple to use and flexible, allowing users to create what they envision in their minds from scratch. Besides this, users can also add animation or interactivity to any element.
Features:
- Publish once, share anywhere: Embed a project into any site or share the URL.
- Access hundreds of professionally designed templates
- Use charts and graph tools in various styles
- All projects fully customizable
- Access more than 4,000 icons and millions of images
- Present projects offline: Download infographics in popular file formats, such as JPEG, PDF or HTML5 (in case you don’t have WiFI or only have access to a sluggish connection).
- Manage privacy: Control who can view your infographics.
- HTML5-based: Runs on any browser and device
- Add interactivity or animation to any object: Create call-to-action buttons, surveys, videos, quizzes, etc.
- Work as a team: Access content management and collaboration tools.
- View analytics: See combined statistics of infographic views in a single place.
- Use “Requires Registration” feature to generate leads with infographics.
Price: Access basic features for free for as long as you like. Paid plans start at $7 a month per user.
Pros: The possibilities are endless in terms of the types of visual content you can create besides infographics.
Cons: Free plans offer limited access to templates, assets and chart widgets.
Ideal for: Marketers, corporate teams, entrepreneurs, educators and non-designers in general
2 Canva
The best way to describe Canva is as an easy-to-use online version of Photoshop, but for non-designers. Its user-friendly image is solidified from the get-go: It starts off with a short tutorial on how to use their design program and then presents users with several templates and content types to choose from.
Unlike more sophisticated and expensive programs, it actually saves users the hassle of searching for images and icons and determining the dimensions and layout of projects.
Features:
- Dozens of ready-to-use templates
- Millions of searchable images
- Hundreds of free fonts
- Download as a JPG, PNG or PDF file
- Drag-and-drop infographic
Price: The standard plan is free for all users. If you want to access premium features, paid plans start at $9.95 a month per user. However, images and illustrations available in Canva cost $1 each time you publish a project.
Pros: Vast selection of stock images and templates to choose from.
Cons: Image assets have to paid for individually. No options for adding animation or interactivity to objects.
Ideal for: Non-designers
3 Piktochart
This program helps users feel at home with its intuitive interface and easy-to-follow tour of its main features and functions. It offers users hundreds of templates to choose from, as well as plenty of chart styles and interactive maps.
Features:
- Hundreds of templates for different uses
- Thousands of icons and images
- A variety of chart styles
- Ready-to-use text and photo frames
- Import data from Excel
- Download high-resolution infographics in JPEG, PNG or PDF formats
Price: Basic features can be accessed for free. Paid plans start at $15 a month per user.
Pros: Large selection of templates and chart styles
Cons: Price is high compared to other infographic makers. No options for adding animation or interactivity to objects.
Ideal for: Marketers, entrepreneurs, educators and non-designers in general
4 Venngage
An infographic tool developed by the online data visualization sharing community Visual.ly, Venngage offers users hundreds of professionally designed templates, charts, maps and icons. Like the other infographic makers on this list, it offers basic features for free but does not allow you to download projects until you upgrade to the Premium version.
Features:
- Create data-driven charts and maps
- Extensive selection of icons and pictograms
- Upload your own images
- Hundreds of professionally designed templates
- Ability to customize style, theme, size and color
- Drag and drop icons, charts and other visuals onto canvas
- Publish, embed or download
- Download as image or PDF file
Price: Basic features can be accessed for free. Paid plans start at $19 a month per user.
Pros: Wide selection of templates, icons and graphic assets
Cons: Free version does not offer ability to download projects or publish them privately
Ideal for: Marketers, entrepreneurs, educators and non-designers in general
5 Infogr.am
This infographic maker is ideal for those who want to create more complex charts, graphs and data visualizations in general. It offers more than 35 different chart styles, from common bar charts to more complex bubble charts and maps. You can insert data directly into the tools spreadsheet or import data from Excel.
Features:
- More than 200 types of maps
- Rich text editing
- Import Excel and CSV files
- Connect live data to charts using Google Sheets and Google Analytics
- Manage privacy
- Download as PNG or PDF file
- Publish and download infographics programmatically
- Access analytics
Price: Paid plans start at $19 a month per user.
Pros: Large selection of chart types
Cons: No free plans.
Ideal for: Users who want to create more complex data visualizations, such as journalists or researchers.
This is our take of the top 5 best infographic makers available on the Web right now. Which do you think is the best infographic tool for your needs? We would love to hear your thoughts and reactions in the comments section below.


