
“There have been 13 Fed rate hike cycles in the post-WWII era and 10 landed the economy in recession.
Soft landings are rare and when they have occurred, they have come in the third year of the expansion, not the eighth.”
– David Rosenberg, Gluskin Sheff + Associates Inc.
The Fed finds itself in a tricky place. Next week will likely be rate hike number three. “Three steps and a stumble?” We’ll see. My dad used to always say, “Stuck between a rock and a hard place.” I’ll try my best to explain what I see.
A few weeks ago I wrote about debt. If your brother earns $100,000 per year and has very little debt, he can borrow on his credit card and buy stuff. That’s good for the economy. In the early phase and for much of a credit cycle, income spending and credit expansion is good for the economy. But at some point an end point is reached.
Creditable academic studies show that the stress point is reached when the debt-to-GDP ratio reaches 90%. In English, as it relates to your brother, that is the point in which his total debt grows to $90,000 vs. his $100,000 income. Debt is 90% of his “GDP.”
At the end of the line for your brother is a point in which he can borrow no more. You can see how his personal economy begins to unwind. His deleveraging and inability to spend is deflationary for him and collectively if this happens to all our brothers at the same time it is deflationary for the entire system.
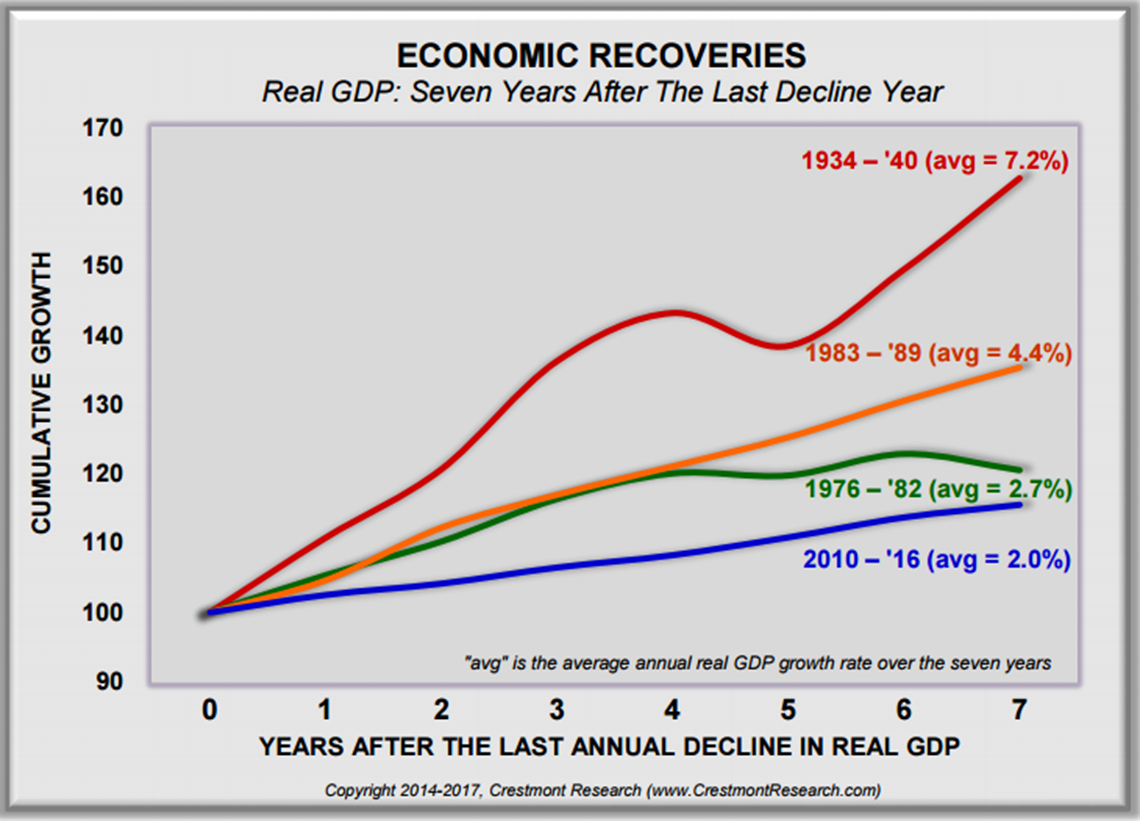
We reach a point in time when the system must deleverage. The economy slows. Is it any wonder that growth since 2010 has been the worst on record (blue line next chart).
Trillions here, trillions there… It gets confusing and frankly what do trillions really mean to you and me? Take a zero or two off, big whoop. But those zeroes do matter. To make it easier to understand, economists like to look at debt relative to income (as in my example) or debt-to-GDP in the economic world.
Here’s the skinny: The debt-to-GDP ratio in the U.S. is 352%. Way north of that problematic 90% threshold. It’s 450% in the Eurozone, near 300% in China and 500% in Japan. For simplicity purposes, think of GDP the same way you think about your brother’s annual income. In the U.S., it’s like your brother earning $100,000 and owing $352,000.
OK — he’s got issues. We’ve got issues. Raise interest rates and your brother feels more pressure. Raise again, more pressure. Raise again… defaults and subsequent recession. Bottom line is that we are facing something few of us has ever witnessed. We are near the end of a long-term secular debt super-cycle. Something has to give.
It is important to understand how the complexities of all of this effect your life. So what I want to do is focus in on the banking system because that is where the big debt fault line sits. If too many of our brothers default on their loans to the bank, like sub-prime before it, it will shake us all.
So let’s take a simple look at banking. Janus’ Bill Gross wrote a great piece this week titled, “Show Me the Money.” He shares a story of a conversation he had with his children. As he put it, feeling “the necessity to teach my own kids the complexities and pitfalls of investing.” From Bill’s piece:
“Pretend,” I told the “fam” huddled around the kitchen table, that there is only one dollar and that you own it and have it on deposit with the Bank of USA – the only bank in the country. The bank owes you a buck any time you want to withdraw it. But the bank says to itself, “she probably won’t need this buck for a while, so I’ll lend it to Joe who wants to start a pizza store.” Joe borrows the buck and pays for flour, pepperoni and a pizza oven from Sally’s Pizza Supplies, who then deposits it back in the same bank in their checking account. Your one and only buck has now turned into two. You have a bank account with one buck and Sally’s Pizza has a checking account with one buck. Both parties have confidence that their buck is actually theirs, even though there’s really only one buck in the bank’s vault.
The bank itself has doubled its assets and liabilities. Its assets are the one buck in its vault and the loan to Joe; its liabilities are the buck it owes to you – the original depositor – and the buck it owes to Sally’s Pizza. The cycle goes on of course, lending and relending the simple solitary dollar bill (with regulatory reserve requirements) until like a magician with a wand and a black hat, the fractional reserve system pulls five or six rabbits out of a single top hat. There still is only one dollar bill but fractional reserve banking has turned it into five or six dollars of credit and engineered a capitalistic miracle of growth and job creation. And importantly, all lenders of credit believe that they can sell or liquidate their assets and receive the single solitary buck that rests in the bank’s vault. Well . . . not really.
“And so,” my oldest son, Jeff, said as he stroked his beardless chin like a scientist just discovering the mystery of black holes. “That sounds like a good thing. The problem I’ll bet comes when there are too many pizza stores (think subprime mortgages) and the interest on all of the loans couldn’t be paid and everyone wants the dollar back that they think is theirs. Sounds like 2008 to me – something like Lehman Brothers.” “Yep,” I said, as I got up to get a Coke from the refrigerator. “Something like Lehman Brothers.”
I share his full letter below. I love how he summed up the risks that exist today, “our highly levered financial system is like a truckload of nitro glycerin on a bumpy road.”
To this end, we must keep our eyes on the banks. We must keep an eye on risk. The banking system is once again sitting at the epicenter of another potential earthquake. Too much debt is the issue in Italy, France, Germany, Japan, China, Spain and the U.S.
We are not talking 90% debt-to-GDP here, we are four times that number and higher in many countries. The Fed, the ECB and the JCB are walking a tight line. We need to find a global solution to this global problem. Some solution that makes this debt problem go away.
And potential solutions exist. But they require bringing our leadership together in a productive way. Maybe? Can we find great coordination between the Fed and our Fiscal Authorities (Trump and Congress)? That’d be a good start. Can we work closely with our global friends? Everything is connected.
What are the odds of cooperation between U.S., European, Japan and China leadership? How about the EU, the ECB? How about German with France? Who’s going to bail out the Italian banks? And growing protectionism? Brexit, Le Pen and Merkel.
Beautiful resolution or ugly? Absolutely everything is connected. We just don’t yet know how it will play out.
Now, with all that said, our equity trend indicators are bullish. Don’t worry. Just have a plan in place to manage risk so that you can be in a position to take advantage of the next great opportunity. Grab a coffee and find that favorite chair. I share with you (and please share it with your clients and children) Gross’s explanation. He does such a good job at explaining how banks leverage your and my money up… your kids will totally get it.
? If you are not signed up to receive my weekly On My Radar e-newsletter, you can subscribe here. ?
Included in this week’s On My Radar:
- Show Me the Money by Bill Gross
- Charts of the Week
- Trade Signals – Zweig Bond Model Reverses to Sell, Equity Trend Remains Bullish, S/T and L/T Gold Trends Bearish
- Personal Note — NJ, Boston, Utah, Dallas, Philadelphia and Sonoma
Show Me the Money by Bill Gross
“School days” inexorably continue at the Gross household, not just because of grandchildren, but because of the necessity to teach my own kids the complexities and pitfalls of investing. As I get older, I fear I may unduly introduce them to a 1930s Will Rogers warning about losing money: “I’m not so much concerned about the return on my money,” he wrote, “but the return of my money.” “Don’t lose it” is my first and most important conceptual lesson for them despite the Trump bull market and the current “animal spirits” that encourage risk, as opposed to the preservation of capital.
Recently I also explored with them the concept of financial leverage – specifically that of fractional reserve banking, which has been the basis of credit and real economic growth since the system was blessed by central banks over a century ago. “It still mystifies me,” I told them, “how a banking system can create money out of thin air, but it does.” By rough estimates, banks and their shadows have turned $3 trillion of “base” credit into $65 trillion + of “unreserved” credit in the United States alone – Treasuries, munis, bank loans, mortgages and stocks too, although equities are not officially “credit” they are still dependent on the cash flow that supports the system.
But I jump ahead of myself. “Pretend,” I told the “fam” huddled around the kitchen table, that there is only one dollar and that you own it and have it on deposit with the Bank of USA – the only bank in the country. The bank owes you a buck any time you want to withdraw it. But the bank says to itself, “she probably won’t need this buck for a while, so I’ll lend it to Joe who wants to start a pizza store.” Joe borrows the buck and pays for flour, pepperoni and a pizza oven from Sally’s Pizza Supplies, who then deposits it back in the same bank in their checking account. Your one and only buck has now turned into two. You have a bank account with one buck and Sally’s Pizza has a checking account with one buck. Both parties have confidence that their buck is actually theirs, even though there’s really only one buck in the bank’s vault.
The bank itself has doubled its assets and liabilities. Its assets are the one buck in its vault and the loan to Joe; its liabilities are the buck it owes to you – the original depositor – and the buck it owes to Sally’s Pizza. The cycle goes on of course, lending and relending the simple solitary dollar bill (with regulatory reserve requirements) until like a magician with a wand and a black hat, the fractional reserve system pulls five or six rabbits out of a single top hat. There still is only one dollar bill but fractional reserve banking has turned it into five or six dollars of credit and engineered a capitalistic miracle of growth and job creation. And importantly, all lenders of credit believe that they can sell or liquidate their assets and receive the single solitary buck that rests in the bank’s vault. Well . . . not really.
“And so,” my oldest son, Jeff, said as he stroked his beardless chin like a scientist just discovering the mystery of black holes. “That sounds like a good thing. The problem I’ll bet comes when there are too many pizza stores (think subprime mortgages) and the interest on all of the loans couldn’t be paid and everyone wants the dollar back that they think is theirs. Sounds like 2008 to me – something like Lehman Brothers.” “Yep,” I said, as I got up to get a Coke from the refrigerator. “Something like Lehman Brothers.”
My lesson continued but the crux of it was that in 2017, the global economy has created more credit relative to GDP than that at the beginning of 2008’s disaster. In the U.S., credit of $65 trillion is roughly 350% of annual GDP and the ratio is rising. In China, the ratio has more than doubled in the past decade to nearly 300%. Since 2007, China has added $24 trillion worth of debt to its collective balance sheet. Over the same period, the U.S. and Europe only added $12 trillion each. Capitalism, with its adopted fractional reserve banking system, depends on credit expansion and the printing of additional reserves by central banks, which in turn are re-lent by private banks to create pizza stores, cell phones and a myriad of other products and business enterprises. But the credit creation has limits and the cost of credit (interest rates) must be carefully monitored so that borrowers (think subprime) can pay back the monthly servicing costs. If rates are too high (and credit as a % of GDP too high as well), then potential Lehman black swans can occur. On the other hand, if rates are too low (and credit as a % of GDP declines), then the system breaks down, as savers, pension funds and insurance companies become unable to earn a rate of return high enough to match and service their liabilities.

Central banks attempt to walk this fine line – generating mild credit growth that matches nominal GDP growth – and keeping the cost of the credit at a yield that is not too high, nor too low, but just right. Janet Yellen is a modern day Goldilocks.
How is she doing? So far, so good, I suppose. While the recovery has been weak by historical standards, banks and corporations have recapitalized, job growth has been steady and importantly – at least to the Fed – markets are in record territory, suggesting happier days ahead. But our highly levered financial system is like a truckload of nitro glycerin on a bumpy road. One mistake can set off a credit implosion where holders of stocks, high yield bonds, and yes, subprime mortgages all rush to the bank to claim its one and only dollar in the vault. It happened in 2008, and central banks were in a position to drastically lower yields and buy trillions of dollars via Quantitative Easing (QE) to prevent a run on the system. Today, central bank flexibility is not what it was back then. Yields globally are near zero and in many cases, negative. Continuing QE programs by central banks are approaching limits as they buy up more and more existing debt, threatening repo markets and the day to day functioning of financial commerce.
I’m with Will Rogers. Don’t be allured by the Trump mirage of 3-4% growth and the magical benefits of tax cuts and deregulation. The U.S. and indeed the global economy is walking a fine line due to increasing leverage and the potential for too high (or too low) interest rates to wreak havoc on an increasingly stressed financial system. Be more concerned about the return of your money than the return on your money in 2017 and beyond.
Source: Janus
Charts of the Week
The most experienced investors talk about wealth preservation. As Bill Gross said, “Be more concerned about the return of your money than the return on your money in 2017 and beyond.” We looked at extremely high market valuations last week… risk is high.
But I believe a great opportunity remains ahead and there are some steps you can take to preserve your wealth. In the “what you can do” category, here are a few ideas that I shared with Linda (my assistant of 20 years and fearless co-editor of this weekly piece) and her admin team yesterday. I tried to explain it in a way they might better understand. I share my explanation to the geeky looking charts in the same way with you below.
As a quick aside, it was a really fun two hours. I walked away from that meeting telling myself I need to connect with them more frequently. I totally need work on upping my management skills.
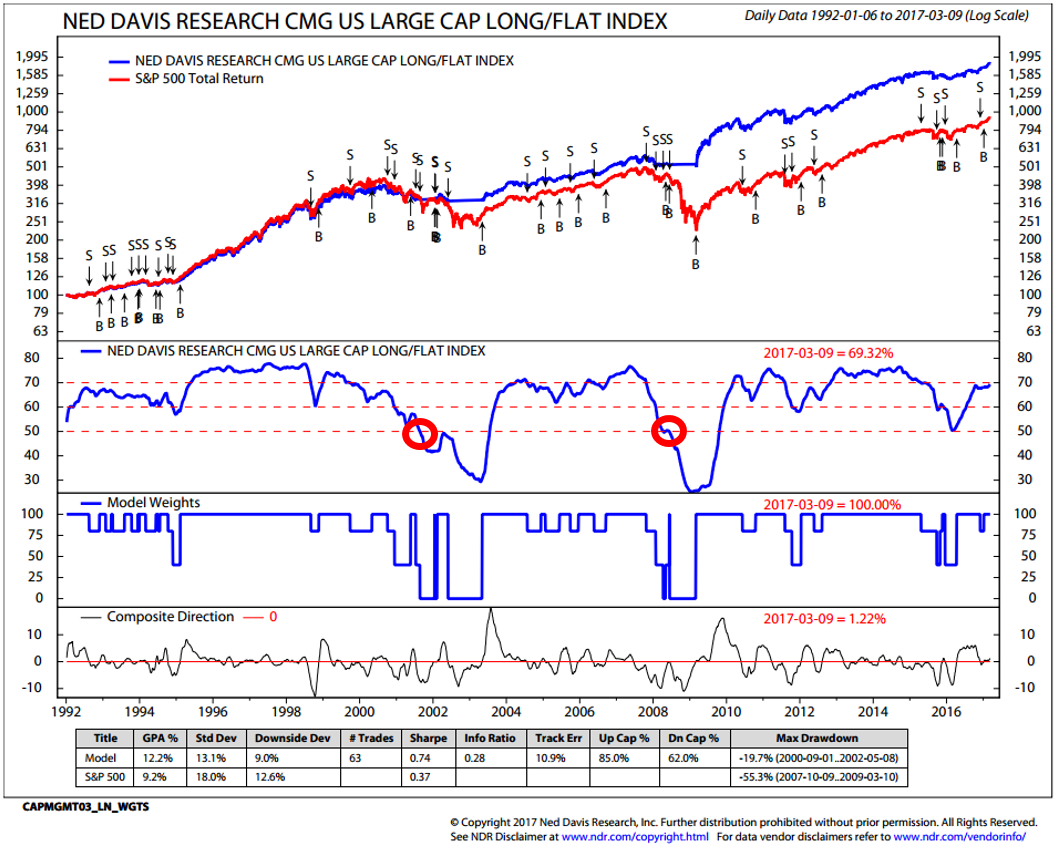
My favorite trend following indicator is something we co-created with Ned Davis Research. It looks at the underlying trends in 22 industry sectors and scores the weight of evidence on a 0 to 100 scale. Here is the chart if you haven’t seen it before (note: I post it every Wednesday afternoon in Trade Signals). The trend for equities is currently bullish.
First – here is the chart. I know it must look like an EKG from your doctor but hang in there with me… first look at the chart then I’ll explain how I use it below.
How I use it:
- The engine of the model is plotted in the middle section of the chart. I sat with our admin team yesterday and explained the process this way. If you are going into a hypothetical battle with 100 soldiers and you lose 10 of them, then 15, then 20 and then 50. You may be able to hold up the fight a little while longer but your army has lost much of its strength. It runs the risk of eventually breaking down.
- Think of the market the same way. This is something we have seen before other important market dislocations. No guarantees, of course.
- When the majority of stocks start declining in trend, collectively the market overall strength is weakening.
- We measure the strength of trend (up and down) by looking at 22 sectors that make up the S&P 500 Index and we plot the results daily. If just one sector is doing poorly than that doesn’t tell us a lot about the overall economy. When many across multiple sectors break down, it is a warning that recession is probable. A bigger issue is at foot.
- The biggest declines comes when the weight of evidence as measured by the indicator line drops below 50. (Big red circles.)
- We developed a process with NDR that scales exposure to large-cap equities from 100% to 80% to 40% and then to 0%, if the model equity line drops below 50 (red circles). You can see the weightings of the index over time in the third panel.
- We use this method as a “ten-percenter” in our private client portfolios, as a disciplined way to manage a portion of our equity exposure. If you are in our CMG Tactical All Asset Strategy, please know that is an entirely different trading strategy (to which we have exposure to in our personal client portfolios). We like to diversify trading strategies.
- The fourth panel tracks the trend. Simply, is the model equity line higher or lower than it was 42 days ago?
- I explain the process in detail in Trade Signals if you’d like to learn more. Click through in the next session.
Look, the process is not perfect, but the long-term success in investing is about how money compounds over time. It is in the not losing big that is most important.
What about bond exposure?
I told Linda that if she has bond exposure that is not invested in one or our two tactical bond strategies, she might want to follow the Zweig Bond Model signals.
First – the chart. Followed by how it works:
Here is how it works:
There are five steps to the scoring process.
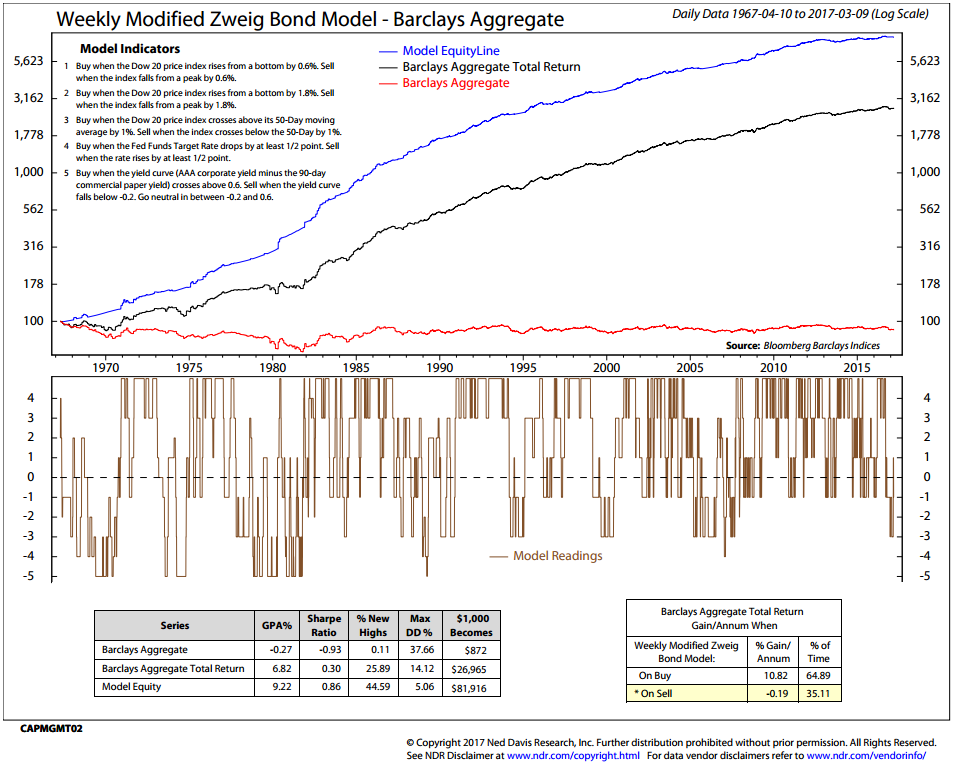
- Score a +1 when the Dow Jones 20 Bond Price Index (index symbol $DJCBP) rises from a bottom price low by 0.6%. Score a -1 when the index falls from a peak price by 0.6%.
- Score a +1 when the Dow Jones 20 Bond Price Index rises from a bottom price by 1.8%. Score a -1 when the index falls from a peak price by 1.8%.
- Score a +1 when the Dow Jones 20 Bond Price Index crosses above its 50-day moving average by 1%. Score a -1 when the index crosses below its 50-day MA by 1%.
- Score a +1 when the Fed Funds Target Rate drops by at least ½ point. Score a -1 when the rate rises by at least ½ point. Score +1 if a buy and -1 if a sell.
- Score a +1 when the yield difference of the Moody’s AAA Corporate Bond Yield minus the yield on 90-day Commercial Paper Yield crosses above 0.6. Score a -1 when the yield difference falls below -0.2. Score it 0 for a neutral score between -0.2 and 0.6.
Next, sum the scores of steps 1 through 5 once a week (the chart below reflects Friday’s close calculations).
A buy is generated on scores > 0 and a sell on scores < 0.
The model is on a sell signal as of last night’s market close.
If the total is +1 or higher, the trend for high quality bond funds and ETFs is favorable. When -1 or lower the trend is unfavorable.
The chart reflects the annual gain per annum versus a buy-and-hold gain.
The process was developed in the mid-1980s and remains the same since its inception. The data goes back to 1967 with the Barclays Aggregate Bond Index to 1976 and the Ibbotson Long-Term U.S. Bond Index from 1967 to 1976. I intend to post this chart each Wednesday in Trade Signals. Over that stretch of time, the model has done a good job at enhancing return and reducing risk in rising rate environments (refer to the chart – highlighted orange rectangle).
The bottom section of the chart shows the combined score of the model’s five measurements.
A quick aside: If you choose to trade following the Zweig Bond Model or any other process for that matter, there are several important questions to ask yourself: Do you have the time to follow the model every day? Do you have the infrastructure in place to trade across multiple accounts? Can you execute ETF trades with little market impact and trade for very low commission? Do you have the conviction and belief necessary to follow the process through both losing trades and winning trades? Can you stick to the process over time?
I have traded our high yield trend following strategy for more than 20 years. Not every trade wins. This is about probabilities and staying in line with the primary bull market trend. It is about avoiding significant declines. There were many times when I fundamentally questioned a trade yet, for most trades, the process proved correct. I frequently say that half the battle is having a sound investment process and the other half is having the discipline to stick to the process.
So if you don’t have the time and/or infrastructure, then find some flexible bond funds and/or a managed bond strategist who can do the work for you.
The most important piece of advice I can share is for you to find something you understand, have conviction in that enables you to have the discipline to stick to the game plan. I share some additional ideas in Trade Signals.
Finally, I believe the key to investing and perhaps the most important lesson to learn is how money compounds over time. To that end, I wrote a piece called the “Merciless Mathematics of Loss.” Next is the chart and you can find the full piece here.
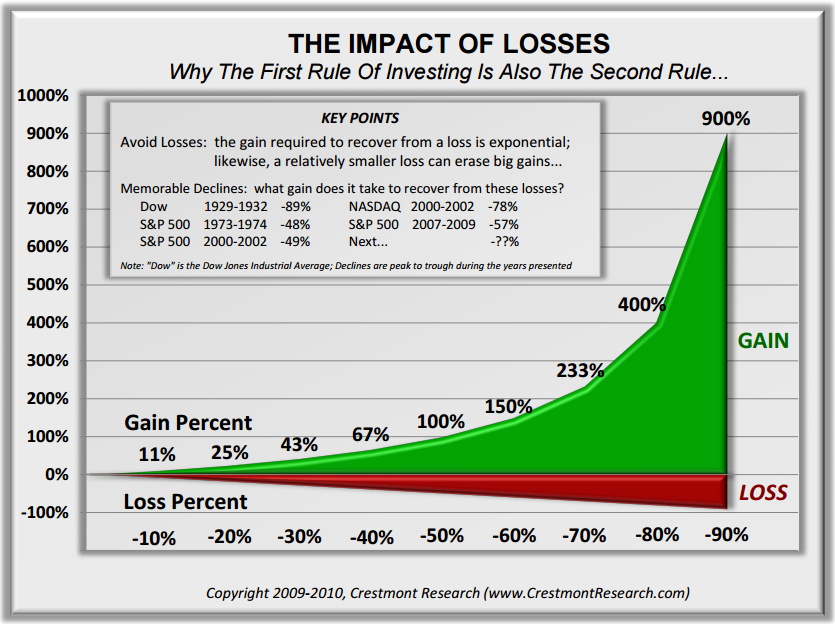
As Gross shared with his children, “Don’t lose it” is my first and most important conceptual lesson for them despite the Trump bull market and the current “animal spirits” that encourage risk, as opposed to the preservation of capital.
It’s in the math.
Trade Signals – Zweig Bond Model Reverses to Sell, Equity Trend Remains Bullish, S/T and L/T Gold Trends Bearish
S&P 500 Index — 2,368 (3-8-2017)
Notable this week: The Zweig Bond Model moved back to a sell. Our favorite short-term gold trend indicator moved to a sell. Daily investor sentiment improved somewhat (now modestly bullish). The equity market trend evidence remains bullish. The CMG Managed High Yield Bond Program remains in a buy signal but trend evidence is weakening. PLEASE NOTE – it moved to a SELL signal a day after the TS post. The Barclay’s Aggregate Bond Index is now negative over the trailing 12 months.
Click here for the charts and explanations.
Personal Note — NJ, Boston, Utah, Dallas, Philadelphia and Sonoma
Last week’s “Anything Goes” high school musical was really great fun. I have to say that most of the high school plays and musicals are – well – not so heavily attended. Last minute ticket purchases never worried me. This time was different. The theater was packed and the show was great fun.
The travel schedule is picking back up. I am presenting next week on March 14 and 15 in Summit, Red Bank and Hackensack, New Jersey on behalf of Josh Jalinski, aka “The Financial Quarterback.” Josh is a popular financial radio talk show host on iHeart Radio. The man can fill a room. The latest count is nearing 300.
A quick due diligence trip to Boston follows on March 21. Then it’s off to Snowbird on the 23’rd with family for our annual ski trip. Brianna is flying in from the New York. Seems like just yesterday I strapped her into a baby backpack and skied her down the mountain. Now she can out ski me but don’t tell her so. Dad’s still in denial. But I’m going to give her a run for her money. We are really excited and the down time together is so important.
The Snowbird trip will be momentarily interrupted by a quick in and out to Dallas. Mauldin is hosting a Chili Dinner on March 28 to be followed by a half-day work session with a group of advisors on March 29. That chili better be good.
I’ll be presenting at a Bloomberg/Invesco PowerShares ETF event in Philadelphia on April 5. I’m speaking about how to tactically trade fixed income ETFs. If you are an advisor and are interested in attending, the event is being held at the Philadelphia Ritz-Carlton. More information here.
I’ll be sharing the Zweig Bond Model shared with you above and will present on how we use ETFs in the CMG Tactical Fixed Income Strategy. I’ll be making the point that there are ways to navigate the ultra-low interest rate, high-risk fixed income environment we find ourselves in today.
Sonoma and San Francisco follow on April 24-26. We are co-hosting an advisor summit with Peak Capital. Twenty advisor clients in California’s wine country. I do love a nice red wine. Susan will be joining me. I think they had me at “wine.” Lucky man.
Wishing the very best to you and your wonderful family. Have a great weekend!
If you find the On My Radar weekly research letter helpful, please tell a friend … also note the social media links below. I often share articles and charts during the week via Twitter and LinkedIn that I feel may be worth your time. You can follow me on Twitter @SBlumenthalCMG and on LinkedIn.


