
Risk free Rates in a Static World
A few months ago, I posted on the hubris of central bankers who (a) believe that they control the level of interest rates and (b) that by changing the level of rates, they can affect stock/bond prices as well as real investments at companies. It is this misguided view of the world that, in my view, has given us years of ever-lower central banking rates, without the promised for results (of more capital investment and higher real growth). It is instructive that almost a decade into quantitative easing, the global economy still seems to be struggling to find its footing.

Unfortunately, this delusion that you can change the risk free rate and leave all else in the process unaffected is not restricted to central bankers and seems to have spread like a virus among valuation analysts, leading to many following the Bernstein script and abandoning DCF. The mathematics are impeccable. If you leave risk premiums (equity risk premiums and default spreads) unchanged, hold on to old growth rates and lower just the risk free rate, you will see value increase as the risk free rate decreases and perhaps approach infinity at really low or negative risk free rates.
To see why, let’s assume that you had valued a company in 2007, when the risk free rate was close to 4% and the equity risk premium was also 4% and that you had assumed that this company’s cash flow to equity, $100 million in the most recent year, would grow at 10% a year for the following five years and 4% thereafter. The value that you would obtain in a DCF would be $3.378 billion. Now assume that you have been revaluing the company every year in the years since, keeping the rest of your parameters fixed and changing just the risk free rate. As the risk free rate has dropped to levels not seen in recent history, your valuations will have zoomed:
 |
| Download spreadsheet |
Your value of this company increase from $3.4 billion to $9.1 billion , as the risk free rate dropped to 1.5%, and lowering the risk free rate further will only increase value. In fact, at a 0% risk free rate (which is where the Euro and the Swiss Franc are at in November 2016), your valuation would approach infinity. As an added feature, as your risk free rate decreases, a greater proportion of your value comes from the terminal value, accounting for almost 94% of your value at a 1.5% risk free rate compared to 84% of value at a 4% risk free rate. That is the crux of the Bernstein argument against DCF, with the twist that estimating future cash flows is always difficult and that lower risk free rates have tilted valuation towards cash flows even further into the future.
Risk free Rates in a Dynamic World
Let’s get real. When risk free rates change substantially, it is not because central banks will them to be lower or higher, but because of shifts in the fundamentals, and those shifts will affect your other inputs into valuation. In this section, I aim to start by showing how changing risk free rates affect growth rates and risk premiums and then argue that the value effect of a change in the risk free rate can be complicated (as market watchers have found out over the decades).
Risk free Rates and Growth (Real and Nominal)
If you have read my prior posts on interest rates and central banks, one of my favorite tools for understanding interest rates is the Fisher equation, which breaks down a riskless rate into two components: an expected inflation rate and an expected real interest rate. Using a proxy of real GDP growth for the real interest rate, I derive an “intrinsic” risk free rate as the sum of the inflation rate and real GDP growth. I may be stretching but it works surprisingly well at explaining why interest rates move over time, as evidenced in the graph below, where I compare the T.Bond rate to the sum of inflation and GDP growth each year from 1954 to 2015.
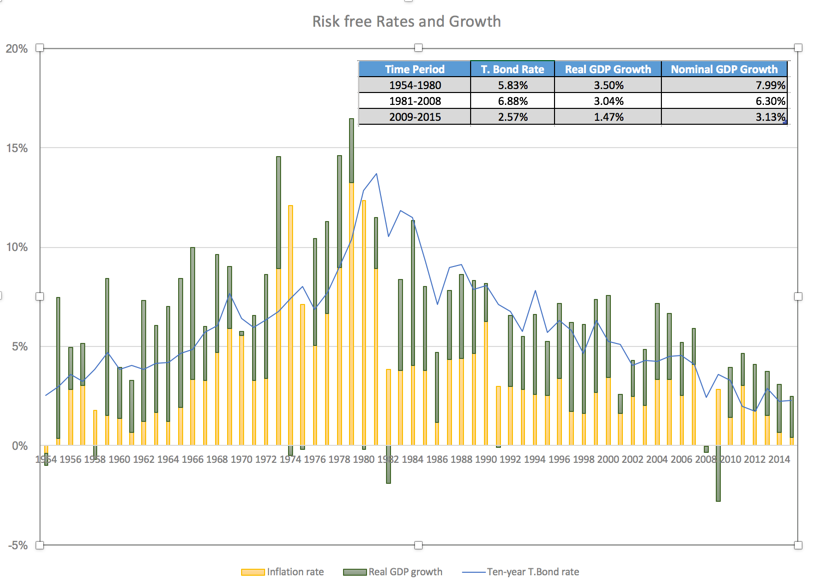
So, what’s the point of this graph? In addition to emphasizing the fact that central banks can affect rates only at the margin, it brings home the reality that low interest rates are indicative of a market that expects both inflation and real growth to remain low. It is entirely possible that the market is wrong but if you are doing valuation, you cannot selectively override the market on one variable (growth in the static example) while holding on to it on the other (risk free rate).
Dynamic Implication: As the risk free rate changes, your estimates of nominal growth will have to be stepped down, not because you have changed your beliefs about a specific company, but because you should be lowering the base growth rate for the economy (global or domestic).
Risk free Rates and ERP
The second variable that goes into play when risk free rates change is the equity risk premium. Again, you have to let go of the notion that equity risk premiums are static numbers that come out of historical data but are reflections of market worries about the future and investor risk aversion. Not surprisingly, the same forces that cause interest rates to move also affect the market’s perception of risk and will cause equity risk premiums to shift. This can be seen when you look at implied equity risk premiums, where you back out what the market is demanding as an expected return on stocks from cash flows and subtract the risk free rate. In the graph below, I outline this effect since 2008.
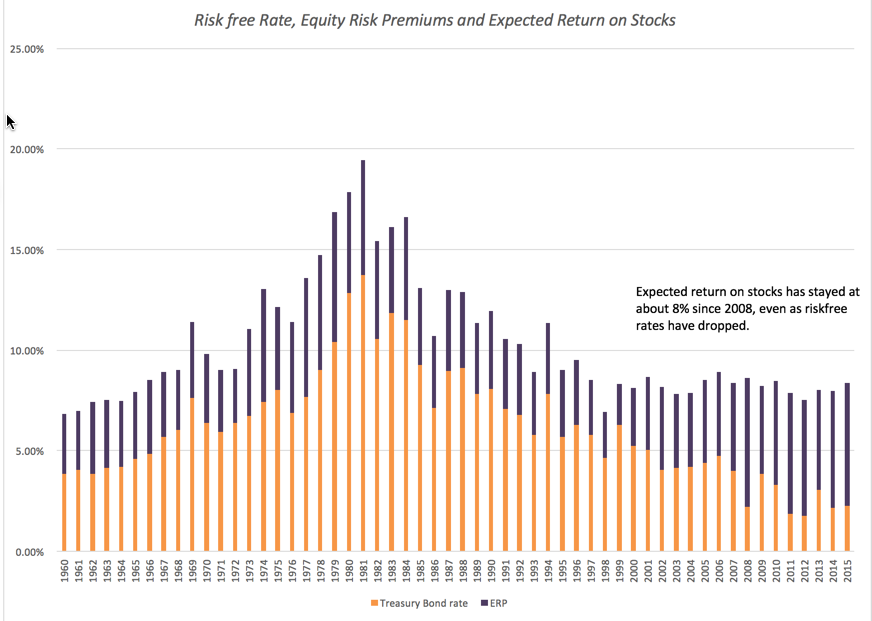
The most striking finding, at least for me, is how little the expected return on stocks has changed since 2008, staying around 8%, while risk free rates have more than halved. The net effect is that the equity risk premium, close to 4% prior to 2008, has now moved to 6% and above.
Dynamic Implication: As the risk free rate changes, the equity risk premiums you use will also have to change to reflect the market’s updated expectations. A crisis that causes rates to plummet will also make risk premiums rise. If you stick with historical risk premiums, while using current risk free rates, you will misvalue companies.
Risk free Rates and Default Spreads
The same forces that cause equity risk premiums to rise as risk free rates drop also come into play in the bond market in the form of default spreads on bonds. In the graph below, I estimate the default spread on a Baa rated bond by comparing the Baa bond rate to the T.Bond rate each year from 1960 to 2015.

As with the equity risk premium, default spreads have widened since 2008, from 2.02% in 2007 to 3.23% in 2015.
Dynamic Implication: As the risk free rate changes, the default spread used to estimate the cost of debt should also change, thus ensuring that the cost of debt will not move in lock step with the risk free rate.
[drizzle]
Risk free Rates and Debt Ratios
To complete the story, the final ingredient that you need for the cost of capital estimation is a debt to capital ratio in market value terms. If as risk free rates change, both the equity risk premium and default spread also change, it should come as no surprise that the relative benefits of using one (debt0 over the other (equity) will also shift. To chronicle these change, I looked at the aggregate debt to capital ratios, in market and book value terms, for all US stocks, each year from 2000 to 2015.
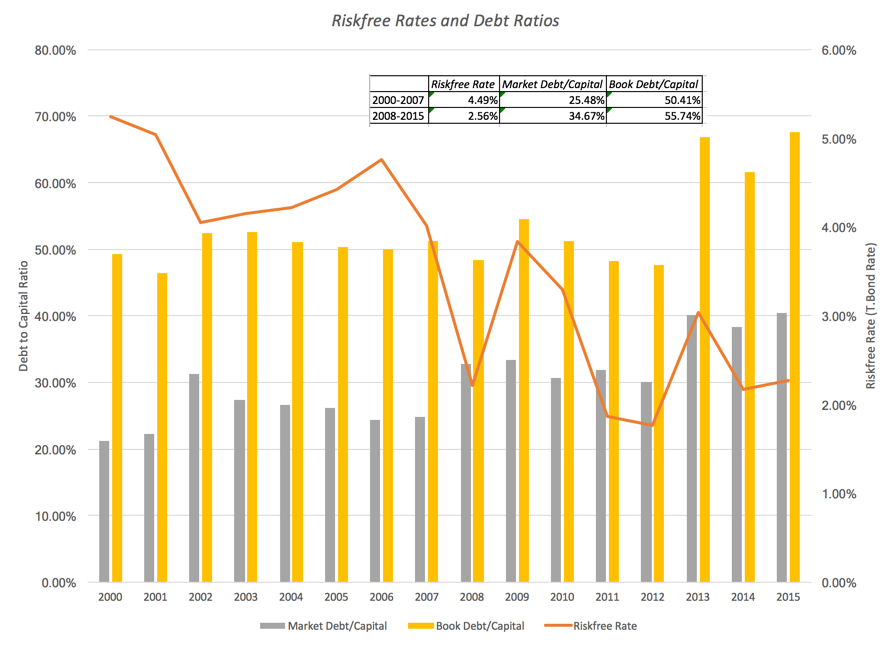
If you divide the time period into pre-2008 higher risk free rate and post-2008 lower risk free rate sub periods, it seems quite clear that US companies are borrowing more money than they used to. The facile explanation is that this is exactly what you would expect with lower interest rates but remember that those lower rates feed into both the cost of equity and debt. This effect is a more subtle one and reflects the relative risk premiums for equity and debt, perhaps suggesting that the price of equity risk has risen more than debt risk.
Dynamic Implication: As the risk free rate changes, the debt ratios for companies will also change as they reevaluate the trade off of using debt as opposed to equity. That change, in conjunction with tax and default risk assessments, will lead to a change in the cost of capital.
Risk free Rates and Value: The Full Picture
Now that we have a fuller picture of how risk free rates are interconnected to risk premiums and growth rates, let me revisit the example that I initiated in the static world of valuing equity in a company with a base year cash flow to equity of $100 million. Rather than let the growth rates and the risk premiums stay unchanged, here is what I assumed:
- The nominal growth rate in the economy will be equal to the risk free rate, reflecting how closely the T.Bond rate has tracked the nominal GDP growth rate.
- The company will grow at a rate 6% higher than the nominal growth rate of the economy for the next five years. Thus, with a 4% riskfree rate, the growth rate is 10%, matching the original assumption, but at a 2% riskfree rate, the nominal growth in cash flows will be 8%. In perpetuity, the company will now grow at the riskfree rate = nominal growth rate of the economy,
- The equity risk premium is the trickiest component, but if the market’s behavior over the last decade is any indication, the expected return on stocks will stay at 8%, with the equity risk premium adjusting to the new risk free rate. Thus, if the riskfree rate drops to 2%, the equity risk premium will be 6%.
The effect on value of changing the growth rate is captured in the picture below:
 |
| Download spreadsheet |
Note that the neither the value nor the percentage of the value from terminal value change much as the risk free rate drops; in fact, they both decline marginally. Furthermore, I can now explore the effect on value of having a zero or negative riskfree rate and it is benign.
I can only give you my personal perspective on how lower interest rates have affected my valuations. With lower rates, contrary to the Bernstein thesis, I find myself less worried about terminal values and the assumptions that I might have made incorrectly. When my nominal growth rate in perpetuity is capped at 2%, 1% or even 0%, I can do far less damage with my assumptions about what a firm can do in perpetuity, than I did in 2007. If anything, low risk free rates makes my intrinsic valuations less volatile, not more so. It is true that these are dangerous times for auto-pilot DCFs where a combination of inertia, trust in historical data (on risk premiums and growth rates) and failure to check for internal consistency can lead to explosively bad DCFs. If Bernstein’s point is that a good pricing (based upon multiples and comparable firms) is better than an auto-pilot DCF, I am in agreement!
Playing Devil’s Advocate
If you are skeptical about my arguments, I don’t blame you! In fact, I will preempt you and bring up some counter arguments that you can make against my thesis.
If you are skeptical about my arguments, I don’t blame you! In fact, I will preempt you and bring up some counter arguments that you can make against my thesis.
- Mean Reversion: The essence of mean reversion is that when something looks unusually low or high, it will be revert back to historic norms. Using this argument on risk free rates, there are some who use “normalized” risk free rates (with the extent of normalization varying across users) in valuation. There are two problems with this argument. The first, and I referenced it in a different context in my post on CAPE, is that assuming things will revert back to the way they used to be can be dangerous, if there has been a structural shift in the process. The second, and perhaps even stronger, argument is that you cannot selectively mean revert some numbers and not mean revert others. Thus, if you decide to replace today’s risk free rate with a normalized risk free rate of 4%, reflecting 2007 levels, you have to also adjust your growth rates and risk premiums to reflect 2007 levels. In effect, you will be valuing your company in 2016, as if your were back in 2007. Good luck with that!
- Central Bank as Master Manipulators: The conventional wisdom is that the Fed (and central banks) are all-powerful and that the low rates of today have little to do with fundamentals and more to do with central banking policy. If you believe that and you also believe that markets are being led by the nose, you do have the basis for a “bubble” argument, where “artificially” low interest rates are leading all financial assets into bubble territory. The problem, though, is that if this were the case, the cost of equity should be tracking down, in step with the risk free rate, and as the figure on equity risk premiums (in the section above) notes, that does not seem to be the case.
That is not to say that I am sanguine about low interest rates. The low growth and low inflation that these numbers signal are having their effect on companies. Real investment has declined, cash flows to investors (in dividends and buybacks) have increased and cash balances have surged. The increase in debt at companies will not only increase default risk but make these companies more sensitive to macro economic shifts, with more distress and default coming in the next downturn. Finally, to the extent that central banks send signals about the future, the desperation that is being signaled by their policies does not evoke much confidence in them.
Conclusion
The risk free rate is an input into a discounted cash flow valuation but it is not an input that can be changed in isolation. When risk free rates change, they reflect shifts in fundamentals that should also show up in risk premiums and growth rates, making any resulting change in value difficult to forecast. As the hysteria mounts ahead of the next FOMC meeting, my suggestion is that you step back and take a big-picture perspective. This too shall pass!
YouTube Video
Attachments
Attachments
- Risk free rates, Inflation and GDP Growth
- Risk free rates and ERP
- Risk free rates and the Baa Default Spread
- Risk free rates and Debt Ratios over time
- Static and Dynamic Valuation Spreadsheet
DCF Myth Posts
Introductory Post: DCF Valuations: Academic Exercise, Sales Pitch or Investor Tool
- If you have a D(discount rate) and a CF (cash flow), you have a DCF.
- A DCF is an exercise in modeling & number crunching.
- You cannot do a DCF when there is too much uncertainty.
- It’s all about D in the DCF (Myths 4.1, 4.2, 4.3, 4.4 & 4.5)
- If most of your value in a DCF comes from the terminal value, there is something wrong with your DCF.
- A DCF requires too many assumptions and can be manipulated to yield any value you want.
- A DCF cannot value brand name or other intangibles.
- A DCF yields a conservative estimate of value.
- If your DCF value changes significantly over time, there is something wrong with your valuation.
- A DCF is an academic exercise.


