
Crescat September Mid-Month Performance Estimates
Also see top Q3 hedge fund letters
And
Bridgewater Goes Bearish On China As Climate …
September 17, 2016
[drizzle]The tandem selloff recently taking place in stocks and bonds represents a major warning signal for the financial markets. On September 9th, a week ago Friday, the S&P 500 sold off by 2.5% at the same time as German 10-year Bunds sold off (from an all-time high) in a five standard deviation move. U.S. Treasury bonds also sold off that day, continuing a downtrend that began July 6th. Japanese sovereign bonds have been selling off consistently since topping out with yields of -30 basis points (-0.30%), on July 27th. Before September 9th, the last significant tandem selloff in stocks and bonds in the US was on December 3rd, 2015, as shown below in the scatter plot of the daily performance of the S&P 500 and Barclays Long Term Treasury ETF over the last year.
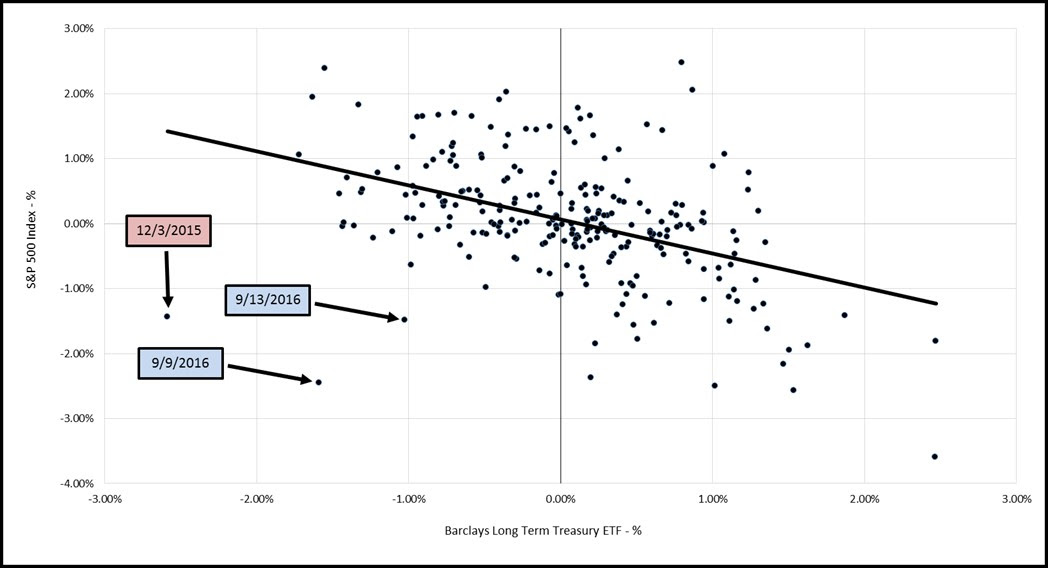
This is important to note right now because the 12/3/15 tandem selloff kicked off an ugly 2-month period for stocks to close out 2015 and begin 2016. From 12/3/15 to 2/11/16, the S&P 500 dropped by 10.4%. We want to remind our investors that the Crescat Global Macro fund gained 8.8% net over that same period. As the chart shows, a tandem stock and bond selloff just happened – again, twice in the last two weeks; on 9/9/16 and on 9/13/16. Once again, this could portend a difficult period for global stocks in the near term. We believe Crescat is well prepared across all of our strategies for such an environment.
Since September 9th, the S&P 500 has been down four out of the last six trading days. On those four days combined, the S&P 500 was down 4.3%. Over the same four days, the Crescat Global Macro fund had combined gains of 0.9% net! When including the two up days in the market this week, cumulatively since September 9th, the S&P 500 is down 1.9% while the Global Macro fund is up 0.6%. We believe there is more market turmoil ahead.
The recent surprise selloff in sovereign bonds across US Treasuries, Japanese Government Bonds, and German Bunds all at the same time raises the suspicion that China is in the market selling its foreign reserves. China holds its foreign reserves across these same three instruments. In the ugly period of the most recent December and January, China sold a record $206 billion of foreign reserves over those two months. At the same time, its currency was declining. The risks in the global financial markets as a result of the Chinese Currency and Credit Bubble are substantial. We have written extensively about this macro theme in our quarterly letters and believe we are well positioned for it at Crescat to the best of our ability within the constraints of each of the three Crescat investment strategies.
Based on the recent market signals we just discussed above, the unsustainable stock market melt-up that has occurred since mid-February may be over. Our short positions are once again working in our favor.
China’s record liquidity injections of 2.2 trillion USD this year is putting substantial downward pressure on the yuan. China’s credit expansion capabilities are maxed out. The massive cash injections are necessary in order to bail out existing bad loans, while China is left with little fire power to grow its real economy. All the while, money is fleeing the country and putting substantial downward pressure on the yuan. The combination of a yuan devaluation and the Chinese selling of foreign reserves wreaked havoc on the global financial markets in late 2015 and early 2016. We believe that was just a foreshadowing of what is to come, because the Chinese currency and credit imbalances have yet to be resolved. According to our macro work, the Chinese Currency and Credit Bubble is unquestionably the largest financial bubble of the 21st century to date. It is only in the beginning stages of bursting.
Below you will find September mid-month and YTD net estimates for all three strategies:
Crescat Global Macro: -0.5%
Crescat Equity Long/Short: -0.7%
Crescat Large Cap: -0.7%
S&P 500: -1.4%
2016 YTD Net Estimates (through 9/16/16)
Crescat Global Macro: -3.2%
Crescat Equity Long/Short: -2.1%
Crescat Large Cap: +9.7%
S&P 500: +6.3%
Please also be sure to download the most recent performance reports using the links below showing Crescat’s robust, long-term performance. Thank you for your continued support and we look forward to finishing September strong!
Sincerely,
Crescat Capital
[/drizzle]


