
On My Radar: I Don’t Know How to Love Him
July 15, 2016
By Steve Blumenthal
I don’t know how to love him,
What to do, how to move him.
I’ve been changed, yes, really changed.
In these past few days when I’ve seen myself
I seem like someone else…
Should I bring him down? Should I scream and shout?
Should I speak of love – let my feelings out?
I never thought I’d come to this – what’s it all about?
Don’t you think it’s rather funny
I should be in this position?
I’m the one who’s always been
So calm, so cool, no lover’s fool
Running every show
He scares me so.
– Andrew Lloyd Webber from Jesus Christ Superstar
We have four interns this summer and today I took them to lunch. One asked what I wrote about today. I said the title of the piece is, “I Don’t Know How to Love Him” and, of course, they gave me a funny look.
I asked them if they had ever heard of the Broadway musical, Jesus Christ Superstar. Unfortunately, the answer was no. At the start of their internships, we required that they read “How the Economic Machine Works” by Ray Dalio. The paper discusses how central bankers have certain levers they can pull, such as raising and lowering interest rates and other tools to speed up or slow down the economy.
I told them that I’m thrilled our fixed income strategies are doing well yet the unprecedented central bank experiments have so distorted price discovery that I just don’t know if I should scream or shout. I’m concerned that the Fed has boxed itself into a Keynesian corner and, thus, the title of today’s piece.
Stuck in an academic theory. Stuck in groupthink. “Running every show. He scares me so.” Therefore, on guard we stand.
Last week, we looked at valuations — probable 3, 7 and 10-year forward returns. I think you’ll find the following chart from Research Affiliates, as I did, quite interesting. It shows their forecast for coming 10-year annualized real returns (net after inflation) on various asset classes. RA adds confidence bands around their predictions (the red arrows are mine).
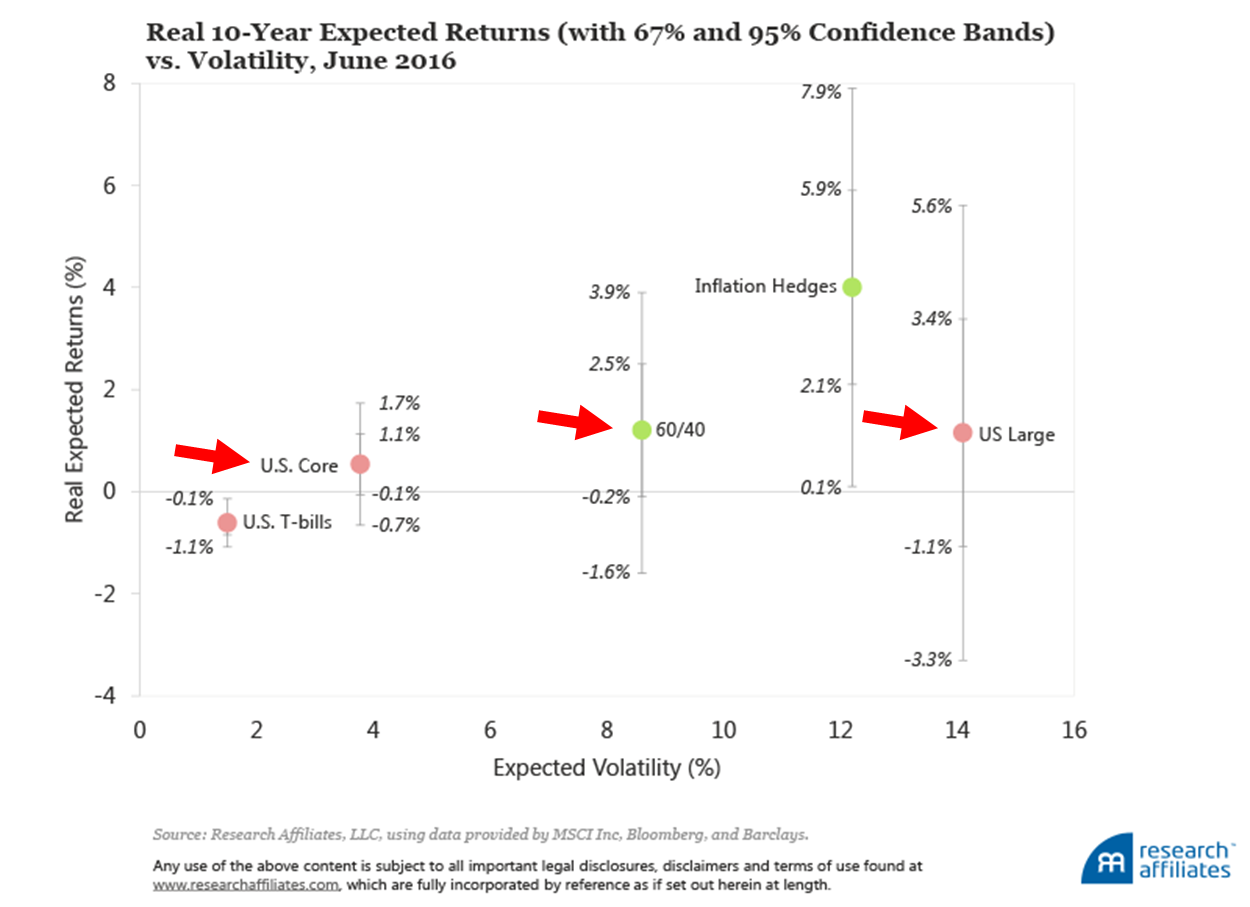
Well, holy cow! Not so good. U.S. Core bonds at less than 1%, U.S. large-cap equities at 1% and 60/40 at 1%. I appreciate that Research Affiliates included confidence bands in the chart. The colored dots are the expected real returns and the vertical line shows the high end and low end of the probable outcome ranges. Results could come in a bit higher or a bit lower from the dots marked by the red arrows (expected outcome).
If you missed it, click here for a link to last week’s OMR for more on current valuations and what they tell us about coming returns (and risk). You’ll find that we pretty much get to the same place.
I also liked the next chart. It shows the starting yields as of June 30, 2016 for various investments. You’ll see that high-yield bonds look relatively attractive and to that end HY has had a great run.

Look at that high yield real yield percentage. I’ve been trading the trend in HY for over 23 years. We know high yield well. Don’t go “all in.” The chase for yield has flooded investor capital into HY bonds and funds. This has enabled companies (I call them zombie companies) to receive funding that they otherwise would not have and at terms that should scare every investor. The next recession will wash them out.
You can find the link to RA’s charts and further commentary here.
I told the interns that HY credit quality has never been worse. There is little protection and high risk in that 6% yield. We are invested in HY today. A generational trading opportunity will present in the next recession. Think a 20% yield opportunity versus 6% today. I told them how important it is to not get run over on the way to that opportunity. Stay tactical.
I just can’t help finding myself thinking about the Fed and QE, the EU and QE, Japan and QE, ZIRP and NIRP and wondering how they are going to get out of the corner into which they have painted themselves. The lyrics “I don’t know how to love you, I don’t know how to use you… He scares me so,” keep running through my head.
Former Fed President (Dallas) Richard Fisher appeared on CNBC this week. I like his candid way. You’ll find some brief notes below and a link to his interview. Lacy Hunt is out with his quarterly letter. Always a great read. I share a few highlights, a link to his letter and my thoughts below.
In the “what can you do with your fixed income exposure” category, I wrote a piece this week for ETF.com, “The Zweig Bond Model – How It Works.” I noted that Wall Street analysts missed the 22% gain in longer-dated Treasury bonds this year. They completely missed the rally in bonds in 2015.
In December 2014, the consensus (25 out of 25 Wall Street economists) predicted interest rates would rise from 2.75% to 3.25% by the end of 2015. They missed. The 10-year Treasury note finished the year with a yield of 2.25%. Can you imagine the trillions of dollars that followed those recommendations to shorten bond maturities? No small miss. We touched 1.38% last week and sit near 1.50% today.
The trend-following Zweig Bond Model stayed invested, suggesting longer duration exposure over that time frame. It continues to signal positioning in longer dated high quality bond exposure.
Each week you can find the Zweig Bond Model in Trade Signals. It is a process you can do on your own. I suggest considering ETFs, such as longer-term dated ETFs on trend based buy signals and own shorter-term dated ETFs such as “BIL” on sell signals. I’m not sure how else to navigate the period ahead given today’s ultra-low rates and central banker determination to inflate economies. You can click here for how the Zweig Bond Model works.
The mother of all bubbles is in the bond market. I believe we have to think differently about investing especially in regards to fixed income exposure. There are ways to navigate the path ahead. Nothing in this business hits 100% all the time. Period. However, trend following works! I share some insights with you today, along with links to further research.
The Fed and their global central banker friends want to manufacture inflation and ultimately they will win. The problem will be getting that inflation genie back in the bottle once she’s out. We need to think differently now more than ever. If you are interested in learning more about trend following, see the section, Trend Following Works!, you’ll find a link below.
Finally, last week I promised a look at the latest recession watch data. You’ll find a few of my favorite “recession watch” charts when you click through to the full piece. In short, there is no sign of U.S. recession. I’m sticking with my call for a recession to begin within the next 18 months.
I hope you enjoy today’s OMR. Grab a coffee and find that comfortable chair.
? If you are not signed up to receive my weekly On My Radar e-newsletter, you can subscribe here. ?
Included in this week’s On My Radar:
- CNBC – Richard Fisher
- Lacy Hunt’s Quarterly Letter
- Recession Watch Indicators
- Trend Following Works!
- Brexit and The Italian Banks
- Trade Signals – All-Time Record High
CNBC – Richard Fisher
“Listen to what they are saying. Watch carefully in what they are doing,” I told the interns. To this end, I believe Richard is the most candid and critical former Fed insider.
Following are a few select bullet points (his comments) from his interview on CNBC:
- Lowest yield since the year of 1790 when Hamilton issued the first series of bonds
- The Dutch 10-year traded at the lowest level in 500 years
- Question, how long does this last? “That’s for you market na-bob’s to figure out.”
- We’ve had a lot of QE and we are not sure if it works.
- Former Chairman Ben Bernanke is in Japan and he is still talking about more helicopter money. They literally wrote checks to people over a certain age and it did not work.
- There is this monetary experiment that has taken place. It is the anchor of the system. Weak economic growth remains, particularly in Europe. They (central bankers) are trying to spur those economies. We are the beneficiaries over here because we see the money coming here. (SB here: I’ve been talking about capital flows over the last number of months. Money will flow to where it is treated best. A coming Sovereign Debt crisis in Europe will cause money to race to the U.S. On a relative basis, we are most attractive but like similar events of the late 1920’s, we are not detached from the global economy. Such an event will be good in the short term, but painful longer term. Thus, own equities but hedged.)
- Chairwoman Yellen says we can always lengthen the duration of the Fed’s portfolio to accomplish more accommodation. They have a huge portfolio, the Fed owns 20% of the federal debt. (SB: 20%! The Bank of Japan owns 59% of Japanese stocks. Unusual, experimental… “should I scream or shout?”)
- But still… You look at low rates everywhere, where do you go. You come here.
- If you take interest rates to zero, it changes the way you discount future cash flows for anything else you are going to buy. And theoretically if you take things to zero the math on your discounted cash flows goes to infinity.
- We had purchased a trillion dollars in securities by February 2009, the market turned March 9, 2009. It is what we hoped to see happen…
- The real question to me is, how do you un-do this at the right time? That is what the Fed is struggling with. Doing this without kicking the economy over.”
The Fed balance sheet is now north of $5 trillion. So I sing, “I don’t know how to love him.”
- Here is the link to the short clip: CNBC Video – Fed’s biggest struggle? Interest rates: Richard Fisher
- CNBC – Benefits of Brexit: Richard Fisher – If Brussels learns anything from Brexit it is “Back off on over regulating…” Great number that came out on Ireland GDP growth. 8% plus. “Who has the lowest tax rate? “I hope both the Brits and the Europeans take the positives from this, which is you have to attract job creating businesses and bureaucracy stifles and overregulation stifles and kills growth.”
- CNBC – Britain wins currency wars with one vote: Ex-Fed’s Fisher – “Britain comes out ahead.”
Lacy Hunt’s Quarterly Letter
Each quarter I look forward to Lacy and his team’s economic commentary. I am going to cut and paste what Mauldin shared in his weekly “Outside the Box” letter. You can sign up for John’s free letters here.
Hoisington Investment Management – Quarterly Review and Outlook, Second Quarter 2016
JOHN MAULDIN | July 13, 2016
It has come to be a near truism that high levels of government debt and deficit spending suppress economic growth, but how exactly does that happen? In today’s Outside the Box, Dr. Lacy Hunt and Van Hoisington of Hoisington Investment Management give us a very detailed explanation of the dynamics involved.
On the deficit spending front, the authors state that the best evidence suggests that the US government expenditure multiplier is -0.01, which means that each additional dollar of deficit spending reduces private GDP by $1.01, resulting in a one-cent decline in real GDP. Additionally, the authors say, the multiplier is likely to become drastically more negative over time since the mandatory components of government spending (Social Security, Medicare, veteran’s benefits and the Affordable Care Act, etc.) will represent an ever-increasing share of the federal budget.
With regard to government debt, the authors describe a 2012 study by Carmen Reinhardt, Vincent Reinhardt, and Kenneth Rogoff (RR&R) that identified 26 major public debt overhang episodes in 22 advanced economies since the early 1800s, characterized by public debt-to-GDP levels exceeding 90% for at least five years.
RR&R determined that these debt overhang episodes reduced the economic growth rate by slightly more than 33%, on average. As of last year, the US economy has met these criteria for reduced growth: government debt first exceeded 90% of GDP in 2010 and surpassed 100% in each of the past five years.
It is very significant, too, say Hoisington and Hunt, that while debt begins reducing economic growth at relatively low levels of government debt-to-GDP, as the debt level rises the debilitating impact on growth speeds up. That is, the impact increases nonlinearly.
The bottom line, say our authors, is that with global debt levels moving ever higher, we can expect that worldwide business conditions will continue to be poor and that the slowdown ahead will cut the already weak trajectory of nominal growth. We are at risk, they warn, of falling into a global “policy trap.”
Hoisington Investment Management Company (www.hoisington.com) is a registered investment advisor specializing in fixed-income portfolios for large institutional clients. Located in Austin, Texas, the firm has over $5 billion under management and is the sub-adviser of the Wasatch-Hoisington US Treasury Fund (WHOSX).
Click here to read Hoisington’s Quarterly letter. Print it out and come back to it from time to time.
Recession Watch
Each month I look at a number of recession watch charts. Let’s take a look at my favorite two and also consider several other data points. In short summary, I see no immediate sign of U.S. recession but I believe there is a high probability that much of the globe is in recession.
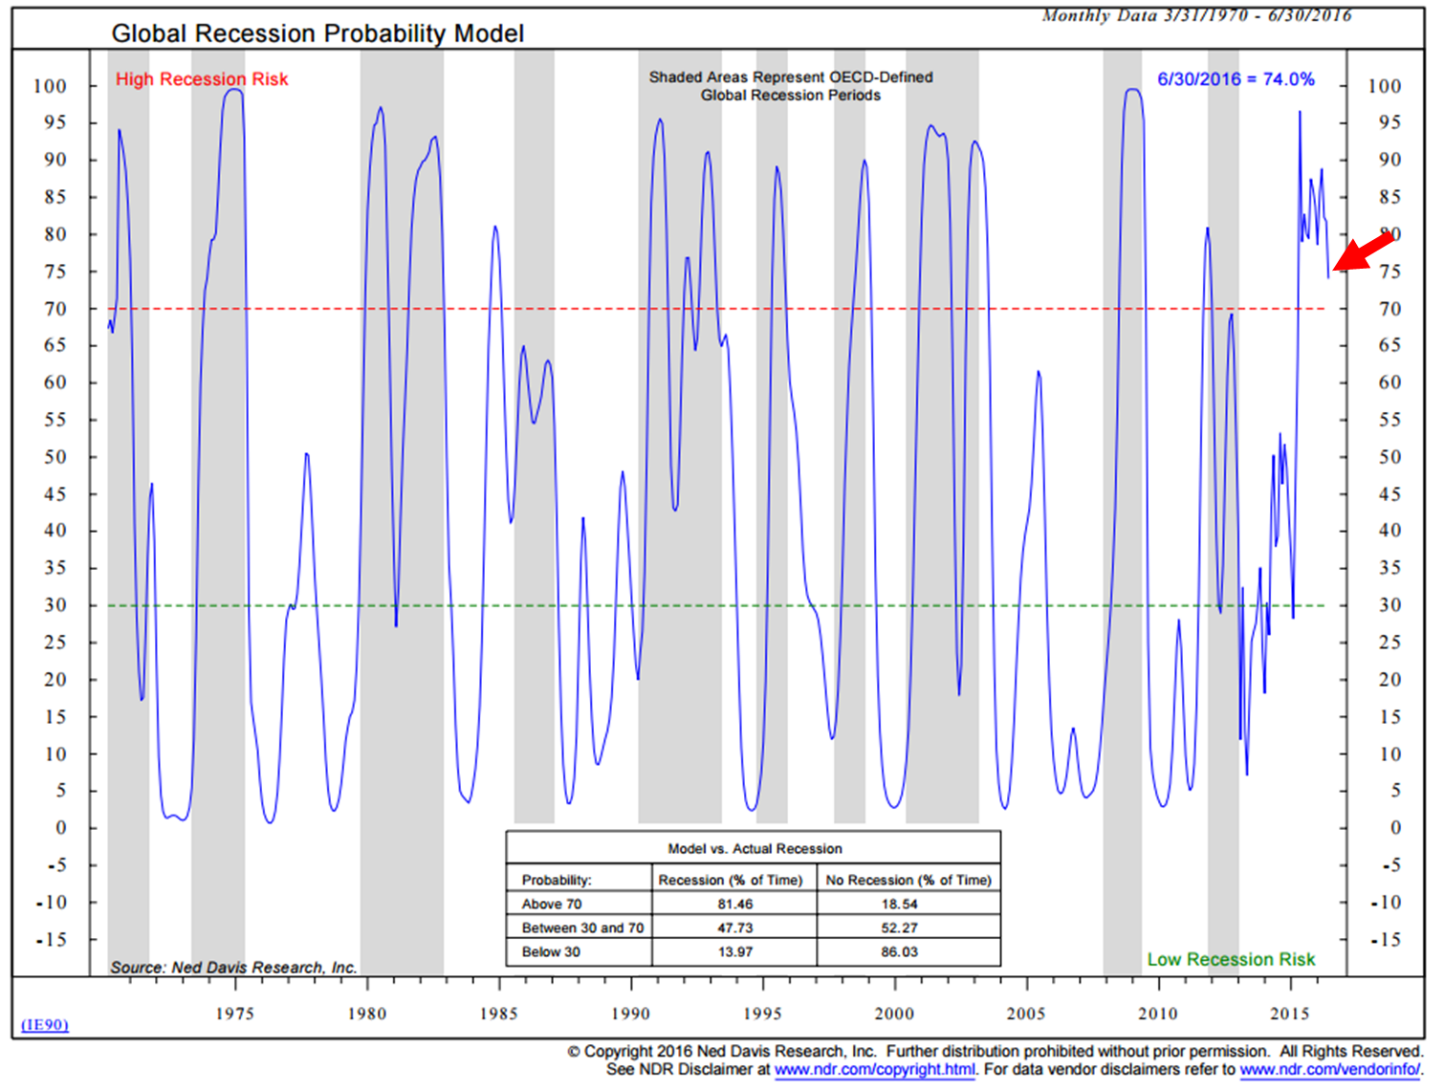
Global Recession Watch
While the trend has been moving in a favorable direction (red arrow upper right side of chart), the collective data still shows a high recession risk globally.
U.S. Recession
When the S&P 500 Index rises above its five-month smoothing by 3.6%, economic expansion is signaled. When it falls by 4.8% below its smoothing, economic contraction is signaled. Notice how well, as indicated by the up and down arrows, periods of expansion and contraction have been signaled. 79% of the signals were correct dating back to the late 1940’s. No guarantees, of course, but keep an eye on this data. I’ll share it with you monthly.
Other data points:
Business Loan Delinquencies & Job Creation
Commercial and Industrial (C&I) loan delinquency rates have a strong historical correlation to net job creation. This makes sense: companies that can’t make their loan payments probably aren’t hiring new workers and may well be shedding them in layoffs.
Based on the historical correlation and the sharp growth in C&I loan delinquencies recently, it is conceivable that employment drops abruptly over the next six months.
Source: RCube Research via 720 Global
“The chart above shows the inverted C&I delinquency rate (orange) plotted against the monthly BLS employment change (blue). It shows how they moved together in the recessions of 1991, 2000 and 2009. Now the C&I delinquency rate is moving again, but jobs haven’t yet followed. If history repeats itself, they will—and probably very soon.”
– Patrick Watson, co-editor of Macro Growth & Income Alert
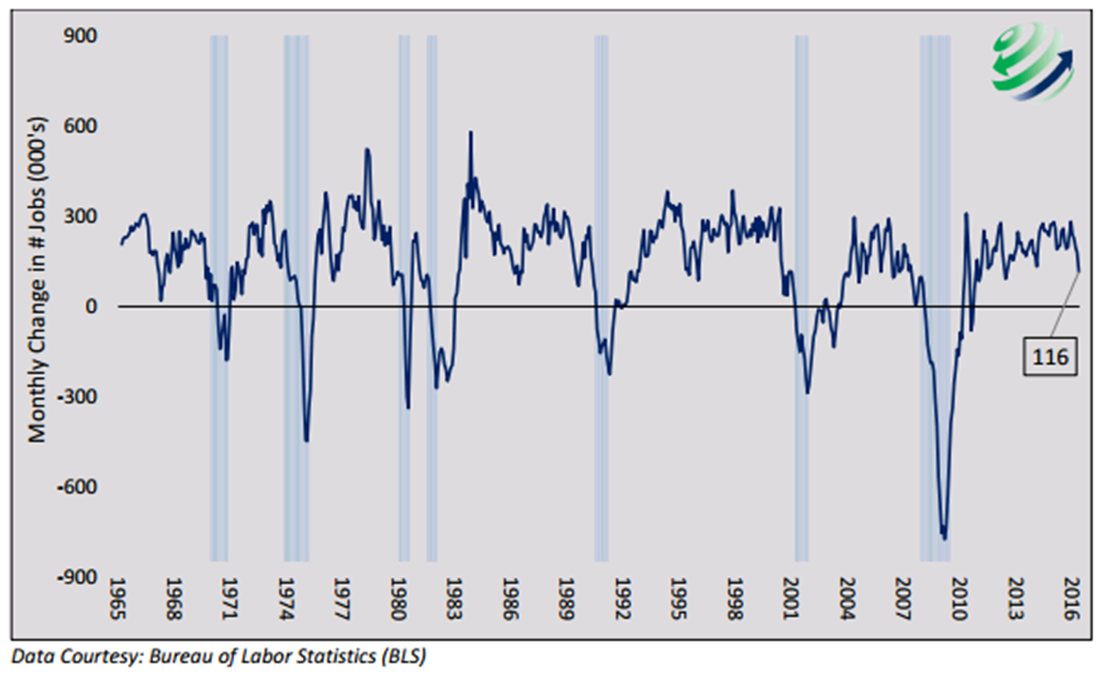
“Over the last 50 years, the U.S. was either in recession or just recovering from one every time three-month job growth went negative (below zero on the graph). In fact, on average a recession began when the three-month average of job growth was still well above zero at 104,000. Currently, the three-month average sits at 116,000. If next month’s report shows fewer than 151,000 jobs created, the three-month average will fall below 104,000.”
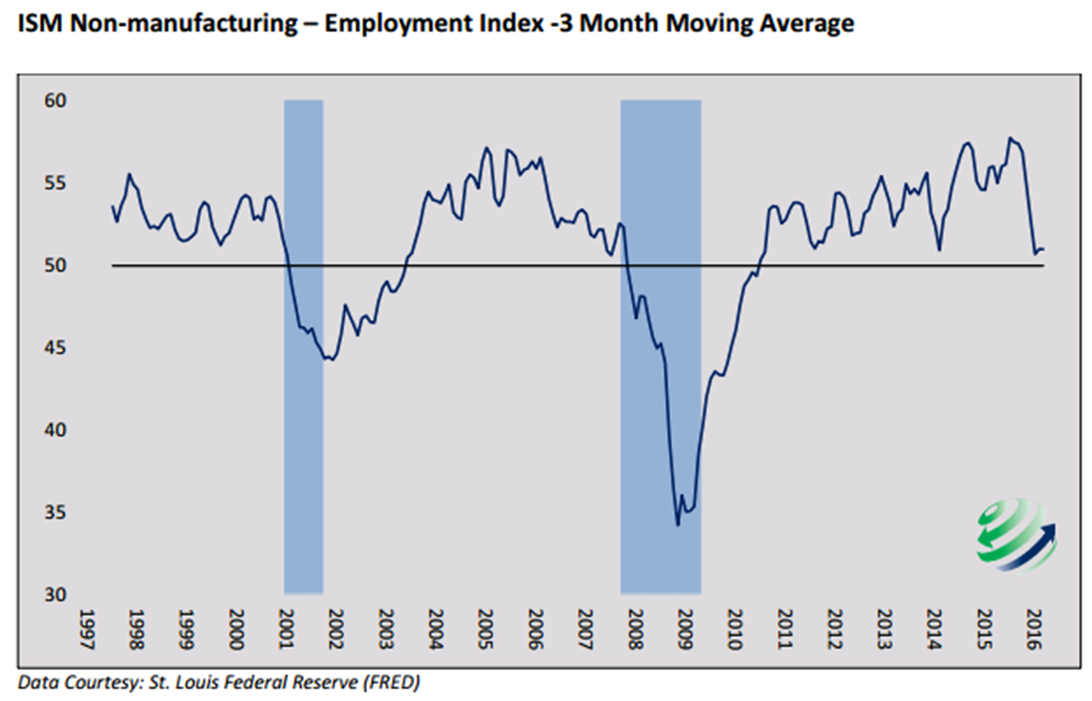
“A monthly reading above 50 signifies that a majority of those surveyed believe employment conditions are improving. A reading below 50 denotes the majority think employment conditions are worsening. The most recent reading was 49.7.
Employment index has yet to break below 50. Historically, each time it has dropped below 50, the U.S. was already in a recession. That said, the three-month average of 51.0 is currently below the three-month average the last two times the U.S. economy entered a recession.” Source: 720Global.
Why my obsession with recessions? It is because the markets decline 30%, 40%, 50% or more during recessions.
Which leads me back to trend following. Use it to help navigate the period ahead. It works.
Trend Following Works!
A January 2016 investment study found that trend following is one of just a few investment factors that works consistently over time. Academics call it “time-series momentum,” but the investment approach is most commonly known as “trend following.”
In “The Enduring Effect of Time-Series Momentum on Stock Returns Over Nearly 100-Years,” by Ian D’Souza, Voraphat Srichanachaichok, George Wang and Chelsea Yaqiong Yao, the authors found trend following to be consistently profitable in different time periods. The research covered the period from 1927 through 2014. The authors concluded that trend following works in all markets, large and small, everywhere. They believe investor behavioral tendencies to be the primary driver.
They analyzed 67 markets across four major asset classes – various commodities, equity indexes, bond markets and currency combinations – from 1903 to 2013 and also documented that time-series momentum or trend following was a consistently profitable viable strategy.
Why does it work? It is believed that price trends exist in part due to behavioral biases exhibited by investors. Such biases include anchoring to most recent past performance and expecting it to continue and herding into or out of an investment. Recall the extreme selling that took place in late 2008 and early 2009 or the tech buying frenzy of the late 1990s.
There are other causes as well, such as corporate hedging activity and central bank and government involvement (e.g., interest rate manipulation, QE asset purchases, etc.). However, investor behavior seems to be the significant driver that creates trends.
Further, there are hundreds of academic papers that study various market factors. Here are a few additional academic studies on trend following:
- In a 2014 paper, “A Century of Evidence on Trend-Following Investing,” the authors, Hurst, Ooi and Pedersen, sought to establish whether the strong performance of trend following is a statistical fluke of the last few decades or a more robust phenomenon that exists over a wide range of economic conditions over many years and differing market cycles.
- “The Profitability of Momentum Strategies,” Chan, Lakonishok and Jegadeesh, Investment Policy and Portfolio Management (1999).
- “Market Cycles and the Performance of Relative Strength Strategies,” Stivers and Sun, Financial Management (Summer 2013).
- Moskowitz, Tobias J. and Ooi, Yao Hua and Pedersen, Lasse Heje, Time Series Momentum (September 1, 2011). Chicago Booth Research Paper No. 12-21; Fama-Miller Working Paper.
- “A Century of Evidence on Trend-Following,” Jurst, Ooi and Pedersen, AQR White Paper (2012).
- “212 Years of Price Momentum,” by Dr. Christopher Geczy and Mikhail Samonov. One of the longest and most extensive studies on price momentum.
- Robert Shiller and Lars Peter Hansen won the 2013 Nobel Prize in Economics for their separate work on what drives asset prices.
- Danial Kahneman and Amos Tversky won the Nobel Prize for their work on Prospect Theory: An Analysis of Decision under Risk. (Econometrica, Vol. 47, No. 2 (March 1979)). They discovered that people react very differently to financial gains and losses. Identifying that investors are more than twice as sensitive to losses as to gains. Kahneman later wrote that the concept of loss aversion was their most useful contribution to the study of decision making.
There is much more on the subject. It is not new. It is well tested. Seek flexible strategies to help you move through the challenges that lie immediately ahead.
Brexit – Italian Banks
Let’s take a quick look at Brexit-related news this week. Think in terms of contagion. We are at the beginning of the Brexit-related issues and not the end. My personal view is that the single largest systemic risk we face is a sovereign debt crisis stemming from Europe. But it could come from China or Japan or the EM. Debt is the common denominator. The globe is facing a long-term debt deleveraging cycle few of us alive have witnessed.
As you saw in the Lacy Hunt research, the debt problems are above the 90% debt-to-GDP level in most of the developed world. We’ll get through this somehow, but as Yoda might say, “think differently we must.”
I read Art Cashin’s piece every morning. I love Art and his humble and direct way. The following is from his post this morning:
“Could The Brexit Implementation Turn European Banks Into Tumbling Dominoes? – That’s a question that some very bright people are beginning to ask.
My eagle-eyed friend, Chris Whalen, and some of his savvy pals at Kroll Bond Rating Agency (KBRA) have put out an eye-opening discussion of the question in a new piece titled: “Italy Slowly Moves Toward Comprehensive Bank Rescue”.
Here’s their summary of the report:
- For the past several years, the European Central Bank (ECB) under Governor Mario Draghi has carried the world of banking in the European Union on its shoulders. Kroll Bond Rating Agency (KBRA) believes that the political shock of the vote in the UK has forced the EU to begin moving towards some type of direct aid for banks, but there remains enormous opposition from some EU member states.
- KBRA believes that the core nations of the EU led by Germany must quickly put aside their reluctance to commit resources to support a comprehensive bailout of Italy’s banking sector. Just as the U.S. learned through bitter experience in the S&L crisis of the 1980s that delaying the clean-up of troubled banks greatly increased the ultimate cost of resolution, the EU’s political leaders seem unwilling to take the painful steps needed to avoid financial contagion.
- One way or another, KBRA believes that the EU must collectively face the problem of bank solvency. By delaying the inevitable process of restructuring, the EU runs the risk of a “surprise” to the financial markets that could quickly metastasize into a larger political crisis. Indeed, precisely that scenario seems to be unfolding in the EU today.
Chris and his friends warn that the EU cannot afford to wait until Brexit is actually set in motion but must begin soon to avoid the domino effect from beginning. Therefore, we should see action very soon, if Europe is going to address the banking problem in time.”
Trade Signals –
Click through to find the most recent trade signals. My favorite weight of evidence indicator, The CMG NDR Large Cap Momentum Index, remains in a sell signal. Trades Signals is posted each Wednesday. Here is a link to the Trade Signals blog page.
Personal Note
A trip to Chicago is up next, July 20-22. Susan and I along with kids are heading to Lake George for a long weekend at the end of the month. We’ll be invading (because there are eight of us) Jim and Maureen’s beautiful house. It sits right on the lake and Uncle Jim is loaded with all of the water toys.
We’ll be hosting a small golf outing for Wells Fargo reps on August 25th at Stonewall in suburban Philadelphia. If you are a Wells Fargo rep, Stonewall is a bucket list course. Shoot me a note if you’d like to attend. I’ll be presenting at the Morningstar ETF Conference on portfolio construction using ETFs September 7-9 and will be attending the S&P Indices Denver Forum September 13-15.
Here is a picture from last week’s Philadelphia Union’s game. It was a 3-0 win followed by a fun fireworks show. The stadium sits along the Delaware River and the fireworks were shot from a barge. A lot of fun for us.

Wishing you and your family a wonderful weekend!
If you find the “On My Radar” weekly research letter helpful, please tell a friend … they can sign up for the letter by clicking the “subscribe here” link that follows:
? If you are not signed up to receive my weekly On My Radar e-newsletter, you can subscribe here. ?
With kind regards,
Steve
Stephen B. Blumenthal
Chairman & CEO
CMG Capital Management Group, Inc.
Stephen Blumenthal founded CMG Capital Management Group in 1992 and serves today as its Chairman and CEO. Steve authors a free weekly e-letter entitled, On My Radar. Steve shares his views on macroeconomic research, valuations, portfolio construction, asset allocation and risk management.
The objective of the letter is to provide our investment advisors clients and professional investment managers with unique and relevant information that can be incorporated into their investment process to enhance performance and client communication.
Click here to receive his free weekly e-letter.


