
April 15, 2016
By Steve Blumenthal
“Seemingly logical, but as I’ve pointed out in recent years – not working very well because zero and negative interest rates break down capitalistic business models related to banking, insurance, pension funds, and ultimately small savers. They can’t earn anything!”
– Bill Gross, Lead Portfolio Manager, Janus
“The unintended increase in the demand for physical cash caused by negative rates can lead to adverse economic effects. When agents want to hold more cash, the velocity of money drops, the money multiplier no longer works: policies designed to create inflation feed deflation.”
-Tim Hayes, CMT, Chief Global Investment Strategist, NDR
My 18-year-old son, Matthew, came to me asking about how the economy works. This summer he will be an intern and task one prior to his start date is to read “How the Economic Machine Works.” There is much we can learn from history and it makes sense to study the research from some of the brightest amongst us. From there, he and I will begin a dialogue.

This past week I watched CNN’s Fareed Zakaria interview former Federal Reserve Chairmen Paul Volker, Alan Greenspan and Ben Bernanke and current Chair Janet Yellen. The interview concentrated on how the Fed makes decisions on interest rates. You can watch the interview here (jump forward 16 minutes for the start). Following are several of their individual comments.
Yellen’s comments:
- The economy is on a solid course
- Not a bubble economy
- Doesn’t see credit imbalances due to low rates
- Relatively weak global growth, yet U.S. is doing well but with a drag from the global economy
- Any measure of the labor market you look at shows broad improvement
Bernanke comments:
- The risk of recession is more or less constant in every year
- We are facing risks like what we’ve seen globally, productivity growth is only modest, which is also a problem but the domestic U.S. economy is moving forward
- From a financial perspective, households are pretty strong
- The housing sector is continuing to expand
- I don’t see any particular reason why a recession is any more likely in 2016 than it was in 2015 or 2014
- That being said, it is true that if recession were to start, the Fed is starting from a lower level of interest rates than would normally be the case, so the extent to which the Fed could cut is less
- His reaction to that is that there other tools, such as forward guidance and QE. We are seeing experiments globally, so there are other tools that we can use. The Fed is not out of ammunition.
- However, we have learned that it is a mistake to put all of the burden on central bank monetary policy. What is needed is a more balanced policy (such as structural reform and fiscal policy from government), which would no doubt work even if the central bank is forced to the limit
Greenspan comments:
- I think the major problem that exists is productivity growth across the spectrum of all countries has been below 1% over the last five years. How do we create a GDP growth rate (output per hour times the expansion in the labor force)
- Unless we come to grips with the issue of productivity then we have no major advance in the future
- He believes it is that capital investment, pretty much everywhere, has slowed down to a significant extent and, as a percentage of GDP, has been dramatically lower than where it has been historically
- Monetary policy should not have the whole load of getting us out of this mess
- Our problem is fundamentally a fiscal problem. Spending money only increases the debt.
- The data importantly show that what we are facing with the demographics we have is an expansion of debt. Unless and until we address this issue, we are going to have problems that are not going to get resolved.
Volker comments:
- There were recessions before there was a Federal Reserve
- There are other factors at work in the economy that tend to produce ups and downs
- And I wouldn’t worry too much about the present situation
- He doesn’t think we are in a bubble economy but sees concerning areas
- There is a lot of reliance on very short-term borrowing to make illiquid investments, a large part of it in the financial sector, without contribution to productivity or real investment is increasing risks in the economy
Fareed asks Bernanke how the Fed will unwind the $4.5 trillion dollars of QE assets it has bought since the Great Recession. Bernanke said:
- “Fortunately, I don’t have to,” as he gestured to Yellen (lots of laughter).
- He adds, “Let me just say that the media has advanced a number of uniformed views on this subject.”
- “In terms of the unwinding, it is a straight-forward process and the Fed has been very clear, at some point the Fed will simply stop reinvesting securities as they mature and let them roll off as they mature and over a period of a number of years it will just go down.”
- In the end, all we have to show for it, besides the fact that they (NIRP, QE, messaging) have helped our economy recover, the Fed has sent profits to the Treasury of $500 billion which has reduced the burden on the taxpayer.
- It has been on the whole a pretty successful policy and I don’t think the roll out (unwinding of the assets on the Fed’s balance sheet) will be problematic.
Reread that bold section. It will be interesting explaining that one to Matthew. You can listen to the entire interview and I believe it is worth your time, but I’d like to add that we are dealing with highly complex systems that involve billions of moving parts. To this end, I liked what Greenspan said towards the end of the interview.
Specifically Greenspan said, “Monetary [policy] is largely economic forecasting and our ability to forecast is significantly limited and we have to keep the context of what we say in the context of what we know and this is a very serious problem that has always existed [for the Fed]. So how do you convey what you know and what is clear without going beyond into the area of forecasting beyond our knowledge?”
What I think I heard him say was, “The curious task of economics is to demonstrate to men how little they really know about what they imagine they can design.” Quoting Friedrich Hayek of Nobel Prize in Economics fame.
These tools may both help and hurt. If the Fed can pull off a soft landing, they can’t do it alone. The fiscal side of the equation involves help from those that can create the structural lift. You know, the guys and gals we are all disgusted with in D.C.
To get to what Ray Dalio calls “the beautiful deleveraging” will require all of the components of the orchestra working together. Right now the brass section won’t work with the string section and the conductor is doing all she can do to make the music sound good. There has been a great deal of experimentation.
Just what is a business cycle (I imagine my Matthew will ask)?
The business cycle is the fluctuation in economic activity that an economy experiences over a period of time. A business cycle is basically defined in terms of periods of expansion or recession.

During expansions, the economy is growing in real terms (excluding inflation), as evidenced by increases in indicators such as employment, industrial production, sales and personal incomes. During recessions, the economy is contracting, as measured by decreases in the above indicators.
Expansion is measured from the trough (or bottom) of the previous business cycle to the peak of the current cycle, while recession is measured from the peak to the trough. In the United States, the National Bureau of Economic Research (NBER) determines the official dates for business cycles.
According to NBER, there have been 11 business cycles from 1945 to 2009, with the average length of a cycle lasting about 69 months, or a little less than six years. The average expansion during this period has lasted 58.4 months, while the average contraction has lasted only 11.1 months.
The last expansion was determined to have commenced in June 2009, the period when the Great Recession of 2007-09 reached its trough (technically, that recession began in December 2007). (Source: Investopedia.)
Since this current cycle is aged and statistically due for recession, in makes sense for us to pay attention. Below you’ll find my favorite recession watch indicators. Jumping to the conclusion: there remains a high probability of a global recession and no signs of a U.S. recession just yet.
But before we do, I’m going to see if I can get permission to share an awesome research piece from Tim Hayes at Ned Davis Research. In the piece, Tim summarizes what boiled in the back of my mind as I watched the CNN Fed interview.
“In the Road to Serfdom, Friedrich Von Hayek ultimately anchors his libertarian philosophy on the realization that our knowledge of complex social systems is extremely limited. For Hayek, every economist should start by reflecting on how little he understands, before building complex models to “predict” economic behavior.
Hayek’s modest admission echoes the Delphic injunction: “scio me nihil scire” (I know that I know nothing). A light-handed approach to policy-making stems from the admission of our limited forecasting abilities.
In medicine, doctors do not treat conditions that they do not understand: observation should precede actions. The “primum non nocere” (first do no harm) principle of the Hippocratic Oath reminds every medicine student that every action comes with unintended consequences.
Modern central banking seems to have turned the Hippocratic Oath on its head: “act first, think later” seems to be the motto du jour. If policies do not have their intended effects, it must be because they have not been pursued vigorously enough, and doses should be doubled.”
Improvable statements can always be used to silence critics: as M. Draghi said on Thursday, “We can demonstrate that the growth of the economy was higher than it would have been if we had not taken those measures” (author’s note: how? By re-creating an alternative universe without NIRP?).
That pretty much sums up the main point I wish to make today. First, do no harm! To that, I wonder.
Ok, grab that coffee and take a quick run through the recession charts. The world isn’t going to fall apart and just as we moved through the last two recessions and the near collapse of the financial system in 2008, we’ll all be ok. The objective is to make sure we do it with our wealth intact.
I share data from Doug Short on the historical performance of the S&P 500 during recessions (note the challenges when valuations are high – and they are high today). If you are a long-time reader, you’ve seen this chart before. Still worth another look, I think.
? If you are not signed up to receive my weekly On My Radar e-newsletter, you can subscribe here. ?
Included in this week’s On My Radar:
- Not Your Father’s or Grandfather’s GDP
- Recession: Global Yes, U.S No
- Recession’s Impact on the S&P 500 Index – A Look at History
- Negative Rates Are Dangerous to Your Wealth
- Trade Signals – Neutral on Trend & Sentiment: Bullish on Bonds & Gold
Not Your Father’s or Grandfather’s GDP
GDP Annual Growth Rate in the United States averaged 3.22 percent from 1948 until 2015, reaching an all-time high of 13.40 percent in the fourth quarter of 1950 and a record low of -4.10 percent in the second quarter of 2009.
We’ve been stuck at 2% for more than a decade.
There is a big difference of compounding an economy at 3.22% than 2%.
Excessive debt is the drag. See Reinhart and Rogoff – This Time is Different: A Panoramic View of Eight Centuries of Financial Crisis and How The Economic Machine Works.
I believe we are in a debt deleveraging cycle that occurs once in a generation. I don’t believe the Fed is factoring this into their models.
If you click on the link embedded in the chart, you can separately look at a number of the countries around the world. In the developed world, the U.S. looks good by comparison. Yet most everywhere, debt remains a drag on GDP.
Recession: Global Yes, U.S No
Within the NFIB monthly economic trends report is the following statement, “A ‘chartist’ looking at the data historically might conclude that the Index has clearly hit a top and is flashing a recession signal. The April survey will decide whether or not the alarm should be rung. This month’s change was not statistically significant, just not in a positive direction.”
Bespoke Investment Group summed it up this way, “The above line from this month’s NFIB monthly economic trends report doesn’t pull any punches regarding the state of sentiment among small businesses in the US. The NFIB’s overall index of small business optimism has declined for three straight months, extending what has been its largest peak-to-trough decline of the current economic expansion, and taking the index down to its lowest level since February 2014. Not only has the headline index declined for three straight months, but it has also missed expectations in each of those months.”
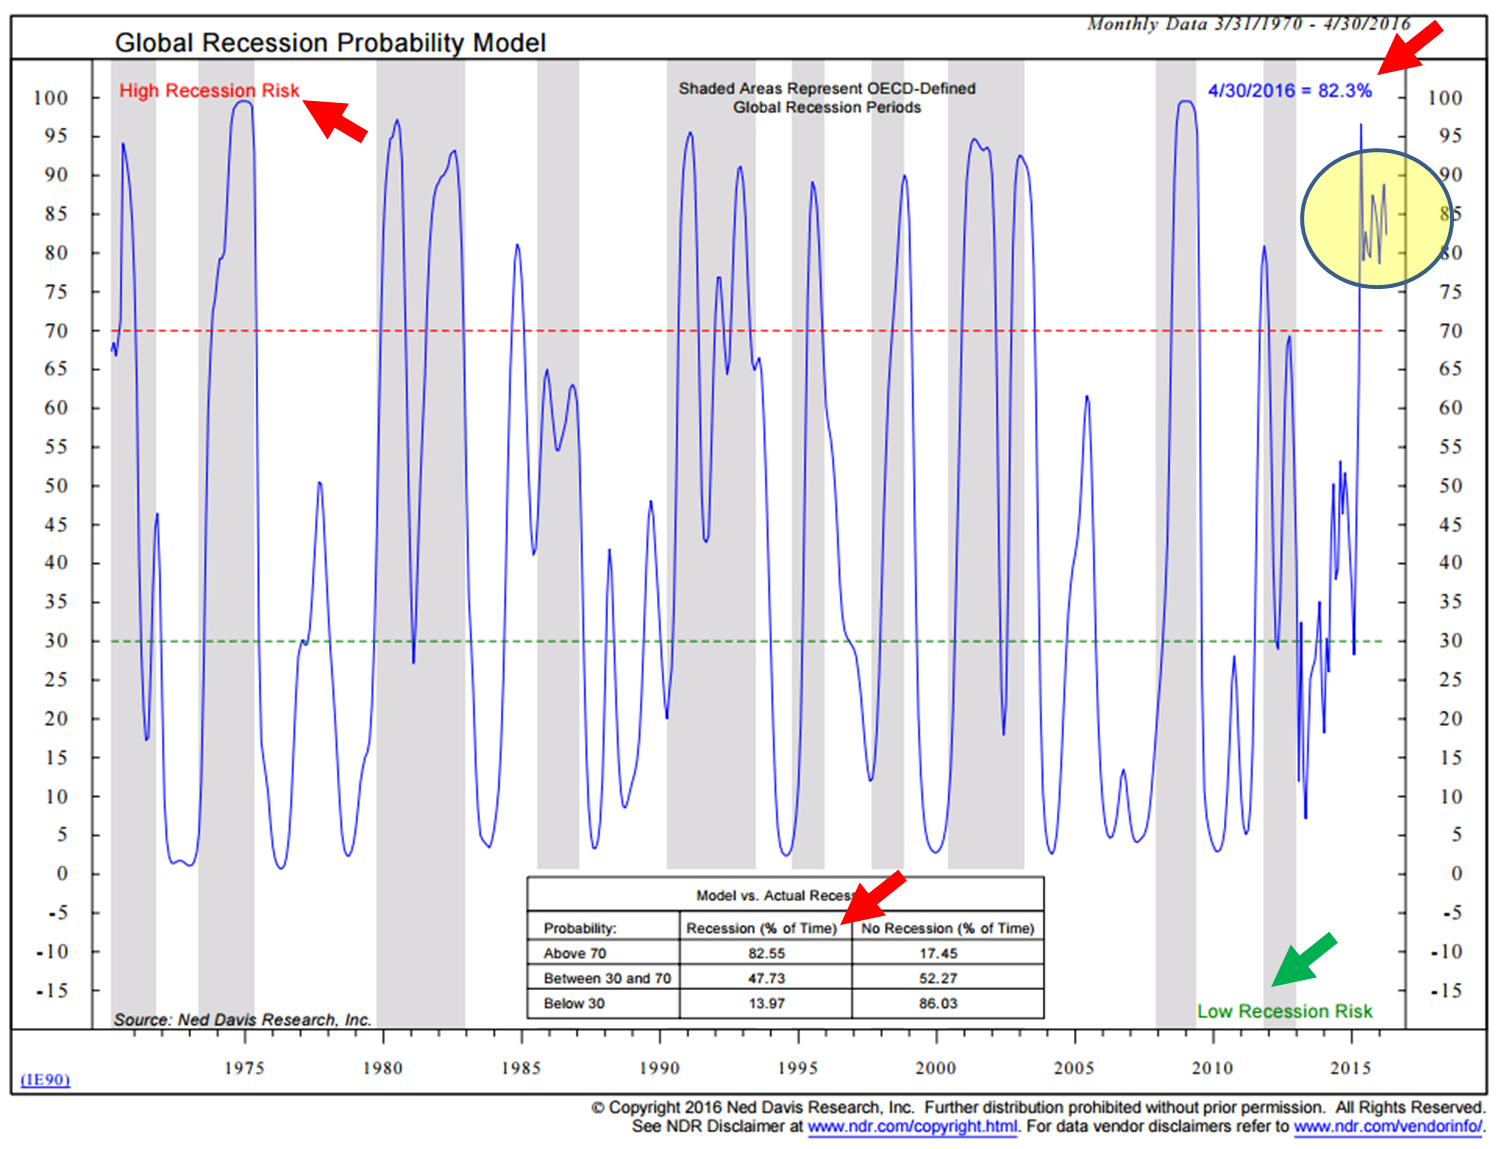
My Favorite Recession Indicator Chart is Signaling No U.S. Recession:
But profits are not looking very good (this next chart is signaling economic contraction due to a fall in profits of greater than 24%):
One of the historically best predictors of recession is an “inverted yield curve” (that is when short-term interest rates are higher than long term interest rates):
Here is a look at the current yield curve (note how long-term rates are high – signaling no recession):
Source: U.S. Department of the Treasury
Next is a look at the real yield curve (adjusted for inflation). Note that long-term real rates are higher than short-term rates, so no recession signal here:
Source: U.S. Department of the Treasury
Conclusion: No U.S. recession at this time.
Recession’s Impact on the S&P 500 Index – A Look at History
This following section is from DShort.com. It looks at valuation and then ranks it compared to historical levels. What I really like is how he shows that risk is highest when valuations are the greatest, especially during periods of recession.
Note: In response to an email, I’ve updated the data in this article through the March month-end numbers and at the launch of the Q1 2016 earnings season.
When I initiated the dshort web page in late 2005, one of my routine topics was equity valuations, initially inspired by Nobel laureate Robert Shiller’s book, Irrational Exuberance, the second edition of which was published earlier that year. I gradually expanded my focus from his cyclically adjusted price-to-earnings ratio (CAPE) to include Ed Easterling’s Crestmont P/E, Nobel laureate James Tobin’s Q Ratio and my own monthly regression analysis of the S&P 500. A few years ago I began posting a monthly update featuring an overlay of the four. Here is a chart that shows the average of the four valuation indicators from a geometric mean regression.
Last year I had a fascinating conversation with Neile Wolfe, of Wells Fargo Advisors, LLC. Based on the underlying data in the chart above, Neile made some cogent observations about the historical relationships between equity valuations, recessions and market prices: High valuations lead to large stock market declines during recessions. During secular bull markets, modest overvaluation does not produce large stock market declines. During secular bear markets, modest overvaluation still produces large stock market declines. Here is a table that highlights some of the key points. The rows are sorted by the valuation column.
Beginning with the market peak before the epic Crash of 1929, there have been fourteen recessions as defined by the National Bureau of Economic Research (NBER). The table above lists the recessions, the recession lengths, the valuation (as documented in the chart illustration above), the peak-to-trough changes in market price and GDP. The market price is based on the S&P Composite, an academic splicing of the S&P 500, which dates from 1957 and the S&P 90 for the earlier years (more on that splice here). I’ve included a row for our current valuation, through the end of March, to assist us in making an assessment of potential risk of a near-term recession. The valuation that preceded the Tech Bubble tops the list and was associated with a 49.1% decline in the S&P 500. The largest decline, of course, was associated with the 43-month recession that began in 1929. Note: Our current market valuation puts us between the two. Here’s an interesting calculation not included in the table: Of the nine market declines associated with recessions that started with valuations above the mean, the average decline was -42.8%. Of the four declines that began with valuations below the mean, the average was -19.9% (and that doesn’t factor in the 1945 outlier recession associated with a market gain). What are the Implications of Overvaluation for Portfolio Management?
Neile and I discussed his thoughts on the data in this table with respect to portfolio management. I came away with some key implications: The S&P 500 is likely to decline severely during the next recession, and future index returns over the next 7 to 10 years are likely to be low. Given this scenario, over the next 7 to 10 years a buy and hold strategy may not meet the return assumptions that many investors have for their portfolio. Asset allocation in general and tactical asset allocation specifically are going to be THE important determinant of portfolio return during this time frame. Just buying and holding the S&P 500 is likely be disappointing. Some market commentators argue that high long-term valuations (e.g., Shiller’s CAPE) no longer matter because accounting standards have changed and the stock market is still going up. However, the impact of elevated valuations — when it really matters — is expressed when the business cycle peaks and the next recession rolls around. Elevated valuations do not take a toll on portfolios so long as the economy is in expansion.
Source: Advisors Perspectives, dshort.com
As I mentioned in last week’s “A Powerful and Reliable Determinant of Long-Term Investment Returns”, Wall Street analysts are estimating a 10% decline in earnings in Q1. Should the market remain elevated, expect even higher valuation levels over the next few months.
Unintended Consequences of Negative Interest Rates
Negative interest rate policy, or NIRP, is the most recently deployed weapon of central bankers in their long campaign of financial repression—a deliberate policy of depressing interest rates in order to transfer wealth from savers (private citizens) to debtors (largely governments). Financial repression is intended to improve near-term growth by encouraging consumption and discouraging savings. Why save today if your money will purchase less tomorrow?
The article discusses how investors may wish to alter their investment plans to take account of the changes in expected returns both within and across capital markets given the new NIRP environment.
Key Points
- Investors are wise to be concerned by zero and negative interest rate policies promulgated by central bankers, because starting yields predict future investment returns. Zero real interest rates predict zero real returns, and negative real interest rates predict negative real returns.
- For long-term investors, risk is more about failing to meet wealth accumulation goals than about short-term changes in the price of their portfolios; thus, the more appropriate measure of risk is the estimated probability of reaching or failing to reach the desired or needed long-term real return level.
- Given the new NIRP environment, investors may wish to look beyond a traditional 60/40 portfolio to a portfolio holding substantial allocations in non-U.S. equities, alternatives, and credit.
Source: Research Affiliates
Trade Signals –
Following are the most recent Trade Signals:
Equity Trade Signals:
- CMG Ned Davis Research (NDR) Large Cap Momentum Index: Sell Signal – Bearish for Equities. (Last signal on June 30, 2015, S&P 500 Index level 2063.11)
- Long-term Trend (13/34-Week EMA) on the S&P 500 Index: Buy Signal – Bullish Cyclical Trend for Equities
- Volume Demand is greater than Volume Supply: Sell Signal – Bearish for Equities
- NDR Big Mo: See note below (active signal: buy signal on March 4, 2016 at 1999.99).
Investor Sentiment Indicators:
- NDR Crowd Sentiment Poll: Neutral reading (short-term Bullish for Equities)
- Daily Trading Sentiment Composite: Neutral reading (short-term Neutral for Equities)
Fixed Income Trade Signals:
- Zweig Bond Model: Buy Signal
- CMG Managed High Yield Bond Program: Buy Signal
Economic Indicators:
- Don’t Fight the Tape or the Fed: Indicator Reading = +1 (Bullish for Equities)
- Global Recession Watch Indicator – High Global Recession Risk
- U.S. Recession Watch Indicator – Low U.S. Recession Risk
Gold:
- 13-week vs. 34-week exponential moving average: Buy Signal – Bullish for Gold
Tactical — CMG Opportunistic All Asset Strategy (update):
- Relative Strength Leadership Trends: The portfolio is approximately 36% fixed income and 64% equities. On the equity front, we see the strongest relative strength price leadership in REITs, materials, utilities, telecommunications, information technology and emerging markets. Fixed income positions include muni bonds, intermediate term corporates, international fixed income and long-term U.S. Treasuries.
- This strategy is a relative strength-driven process that evaluates the price momentum of approximately 100 different ETFs, including large-caps, mid-caps, small-caps, value and growth, sectors, various fixed income, international and emerging markets. Up to 11 positions are held.
Here is a link to the Trade Signals blog page.
Personal Note
ZIRP (zero interest rate policy) and NIRP (negative interest rate policy) has created a hunger for yield and a perceived need to take on more risk. How does the retiree or pre-retiree grow wealth? How will pensions achieve their 7.5% actuarial return targets in a world of 1.75% 10-year Treasuries and equity forward-return probabilities of 2% to 4% (due to current high valuations)? This in a 2% growth world. New normal to new crisis.
What are NIRP’s unintended effects? I’m going to share this with my son Matthew:
“Households save to generate a given level of wealth at retirement: when rates fall, they need more savings to achieve the same targets. In other words, lower rates beget higher savings, which in turn reduces economic demand, which then lead central bankers to cut rates further to “stimulate the economy”. Central bankers have come full circle, and the monetary snake is eating its own tail.” Again from NDR’s Tim Hayes. Well said.
Our high-yield trend model is back in a buy. It’s been a pretty good run. We see risk on in our tactical relative strength models. That emerging market buy last month raised my eye brow but so far that has been a good move. Hedge that equity and include some systematic processes that can help you broadly diversify your exposures.
I’m in NYC again on April 20, 21 and 26. May trips to Chicago followed by John Mauldin’s Dallas Conference May 24-27. Back to Denver in mid-June for meetings. I’ll be speaking at the June Global Indexing and ETF Conference in Dana Point, California.
The Total Portfolio Solution paper will be available next week.
? If you are not signed up to receive my weekly On My Radar e-newsletter, you can subscribe here. ?


