Relationship Between US Manufacturing and Yuan/USD Exchange Rate “Davidson” submits
There are now estimated to be some 350mil Chinese Middle Class. How they got there was due to US & European Middle Class desires for a higher standard of living and the efforts to fulfill this dream. China’s Middle Class has been built by US and European producers establishing manufacturing sites there to take advantage of cheaper labor costs. Today’s volatility is due to China having maintained a fixed exchange rate as global trade has moved against it.
It is important in understanding financial history to have the perspective that governments do not control economies, do not control the desire for a better life of its citizens. Economic activity is at all times based on the desire of individual consumers to improve the standard living for themselves and their families. This is by far the strongest force driving economic activity. It is the basis for democracy and property rights. There is a long history of believing that governments foster living standards, but this is not the case if one looks closely enough. It is the pressure from individuals and groups of individuals which pressure government to act. Free Markets are comprised of millions of free choices by individuals acting in economic self-interest. Individuals at all times when they purchases goods and services with the fruit of their labor maximize the greatest value to themselves. As long as individuals have freedom of choice, i.e. freedom to exercise property rights, individual behavior forces producers to offer the best value for the lowest cost if producers want to stay in business. Free Markets are comprised of billions of these types of transactions.
The power of Free Markets is much greater than governments. Often we do not recognize how Free Markets operate. Governments can overnight decree an action, a tax, an interest rate or agenda and many believe governments control economic activity because government action is highly visible and there is often an economic response to government action. Free Markets act much more slowly. Free Markets are composed of billions of unseen individual economic decisions. Those who look a ‘big data’ attribute outcomes to what they can most easily observe and attribute most actions to government as the prominent economic actor when it is not. Friedrich Hayek (May 8, 1899 – 23 March 23, 1992) wrote about this in “Road to Serfdom”, 1944. The same misperception is occurring today as we watch the devaluation of the Chinese Yuan. In trade the Yuan was already weaker, China is simply catching up to the Free Market.
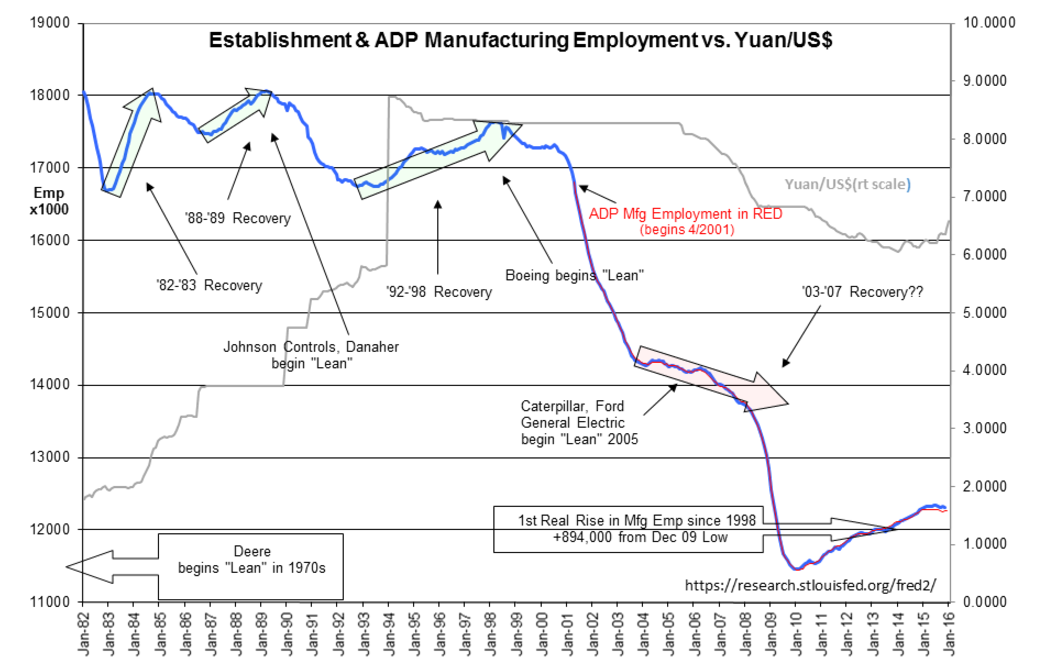
The chart Establishment & ADP Manufacturing Employment vs. Yuan/US$ provides the long term view necessary to understand how the Free Market operates on a much longer time scale. The Free Market is mostly unseen by those we listen to as advisors and those who are our government representatives. I have put US Manufacturing Employment against the Chinese Yuan/US$ because the past 15yrs reflects a major transition in producers shifting manufacturing to China. More recently, some of that manufacturing has shifted back to the US. Notwithstanding that China forced producers who wanted to sell products in China to produce them there, history shows that production shifts to cheaper manufacturing sites has been part of global trade as long as we had someone with which to trade. Trading goods and services has the strongest impact on currency relationships. This can be seen in the Yuan/US$ relationship.
Yuan/USD
The chart is from Jan 1982 till today’s Yuan/USD level of 6.59 when the chart was created. Note a series of choppy looking movements in the Yuan/US$ prior to Dec 1993 followed by a huge devaluation in Dec leading to a much cheaper Yuan at 8.72/US$ in Jan 1994. What occurred was after a period of government fixed currency relationships, China allowed the Yuan to float and it very quickly shifted from 5.8 to 8.72 to the US$ in 1994. China’s exports were weak with government fixed exchange rates at the time. China decided to let the market set the correct rate to improve trade. Trade improved, the strength of the Yuan improved and shortly afterwards China decided to peg the Yuan to the US$ to ~8.3/US$. After keeping this rate stable and setting policies to encourage the establishment of foreign manufacturing, especially from the US, manufacturing in the US began to flow to China. US manufacturing employment begin to fall beginning in 2001.
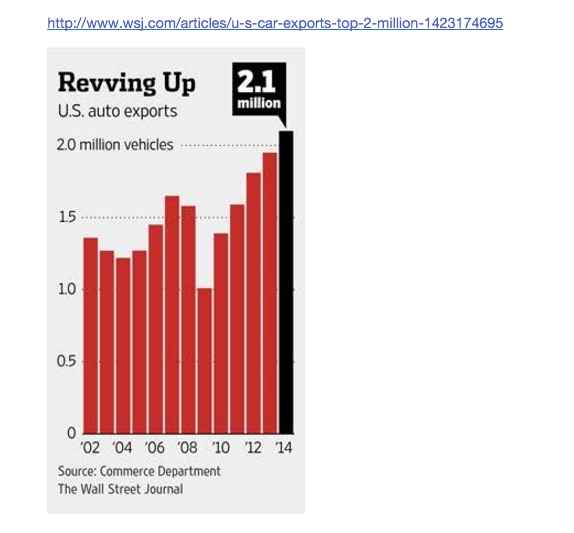
2001 was a recession year from April 2001 to Nov 2001. Many US companies being stung by recession, shifted manufacturing operations to use cheaper foreign sites. US Manufacturing Employment fell continued to fall throughout the recovery labeled 2003-2007. As US trade increased with China so did global trade pressure for a stronger Yuan. This grew to such a degree that China let the Yuan strengthen in controlled steps beginning July 2005. In 2005 several notable US manufacturers began to implement ‘lean’ manufacturing approaches to counter global competition. ‘Lean’ is a broad term to describe the outcome of the process of management/employee engagement which greatly improved corporate efficiencies. It had been developed at Toyota then modified and improved at Danaher to fit American culture. Danaher formulated the ‘Lean’ business approach in beginning in 1985. Danaher trained managers have entered the management ranks of nearly every US industry since then. The ‘lean’ approach has been a quiet but quite effective means of becoming globally competitive. It took till the 2009 recovery that US Manufacturing Employment finally began to show a sustained uptrend. The media reported in 2010 that manufacturing jobs were being ‘re-shored’ to the US in 2010. I called this the ‘Leaning of US Manufacturing Employment’ in a note several years ago. With improved costs at home coupled with language, quality control and transportation issues and especially rising labor costs in China, US has become a preferred manufacturing country. The US now exports over 2million automobiles and trucks annually, see chart/link:http://www.wsj.com/articles/u-s-car-exports-top-2-million-1423174695 .
Yuan/USD
As some US manufacturing shifted back to the US, the Yuan/US$ began to weaken. But, this is not the whole story. We have seen many $Billions of Yuan based conversions as Chinese investors sought property and other investment in the US. The recent Hedge Fund linked currency weaknesses coupled to the strong US$ have made the current Chinese peg to the US$ untenable. Free Market continues to weaken the Yuan further relative to the US$. When a country pegs its currency to another, if trade flow changes, then eventually pressure builds to break the peg. This is happening today with the Yuan/US$. As part of the effect there is selling pressure on Chinese stocks.
Summary:
Fixed currency relationships come undone whennot in agreement with Free Market forces. Patience is necessary to let this work itself out. The US economy and global economy are currently in expansion based on the most recent economic data.
Relationship Between US Manufacturing and Yuan/USD Exchange Rate