
China, Valuation Charts and Recession Watch Charts
January 8, 2016
By Steve Blumenthal
China marked its currency lower once again yesterday. That makes eight days in a row they lowered the yuan. Last August, they devalued the yuan and that sent global equity markets into a dive. As Yogi Berra would say, “It’s déjà vu all over again.”

For many years, the yuan had been pegged to the dollar. The Fed’s move to raise interest rates not only strengthens the dollar versus most every other global currency, it also strengthens the yuan for the yuan is largely pegged to the dollar.
China is trying to escape the Fed effect and they are shocking the markets in Asia, in Europe and here in the U.S. China is just one of the risks. Add European Sovereign debt, emerging market dollar denominated debt and high yield bond market debt to the mix. Nothing new here to report. We are just seeing it begin to play out.
Last week, I shared with you my 2016 Outlook. This week, let’s look at the most recent valuation charts and trends in earnings. We’ll also take a look at the most recent recession charts. Why? Because markets tend to lose 40% to 50% or more in value during recessions. Recessions also present us with the best buying opportunities.
If you are under-weight equities (and hedged), equal-weight fixed income and over-weight liquid alternatives (defined as anything other than traditional buy-and-hold), then continue to bump through the volatility and stay patient, liquid and nimble.
As a quick aside, you may be getting a question from your client(s) who asks, “Why didn’t I beat the market?” Portfolios are built to be diversified for a reason (stocks, bonds, alternatives), yet we somehow as an industry/media have taught investors to compare everything they do against the DJIA (just 30 large stocks) and the S&P 500 Index (500 large cap stocks). We attempt to answer that question and several others in the links I share with you below. Feel free to use them. We hope you find them helpful in your work with your clients.
- When Beating the Market Isn’t the Point
- Correlation, Diversification and Investment Success
- The Merciless Math of Loss (this is about how compound interest works for you)
- Here is a link to our Advisor Blog page
- Here is a link to our Advisor Resource page
Also, I often run across an interesting piece of research or an article that may not make it into OMR. I often use Twitter to share them. If you want to follow some of what I am reading you can follow my posts on Twitter here.
Ok, let’s take a quick look at the most recent valuation charts, several recession probability charts and an interesting chart that looks at the historical performance of the market in election years. Hint: poor first half, better second half.
You’ll find this week’s On My Radar to be a quick read. Thank you for your interest. It is appreciated.
? If you are not signed up to receive my weekly On My Radar e-newsletter, you can subscribe here. ?
Included in this week’s On My Radar:
- Valuation Charts
- Recession Charts
- Market Performance During Election Years
- Trade Signals – Rough Start To The New Year
- Personal Note – Colorado, Florida and Lamb Chops
Market Valuation Charts
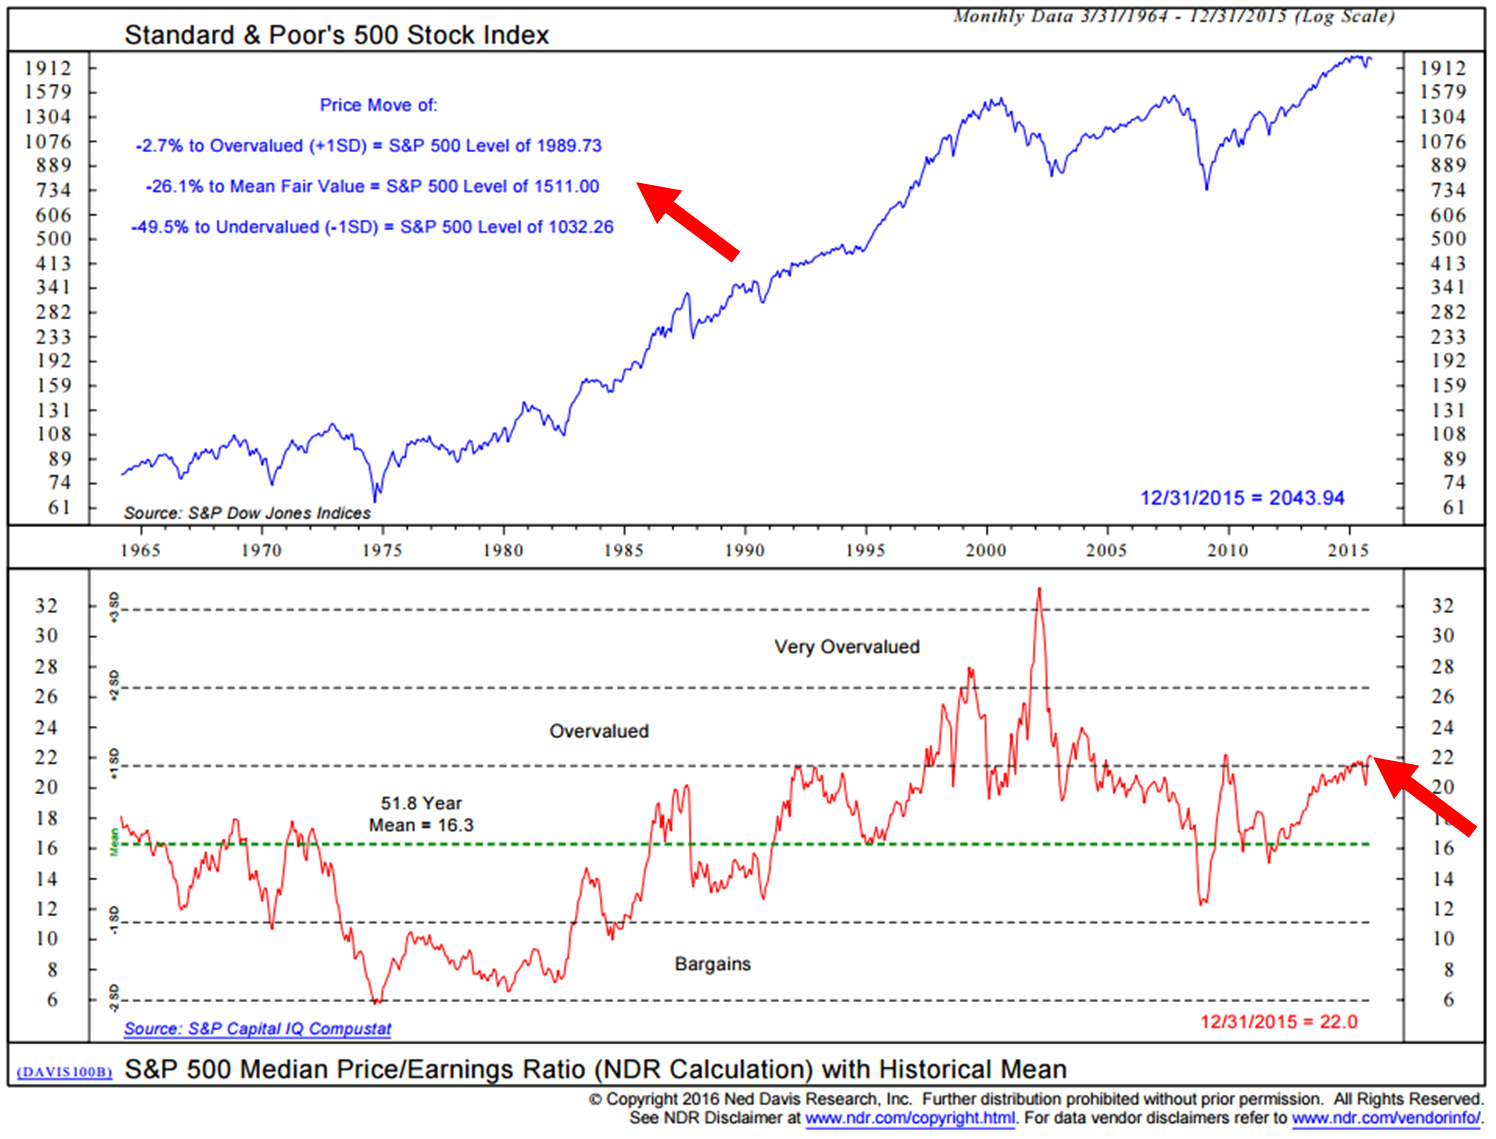
My favorite PE valuation chart is NDR’s Median PE. I like it because it takes removes a lot of accounting gimmicks. By tracking the current month-end median PE (based on the last 12-months actual reported earnings) and comparing the number to all of the historical month end numbers I believe it gives us sound footing for whether valuations are high or low and what probable 10-year forward return may likely be.
You’ll see in the next chart that prices are high relative to earnings. Median PE sits at 22.
A note on earnings growth:
The market has been driven higher by P (price) and less be E (earnings). The energy and commodity sectors are a mess. So what will be needed is expansion in earnings and that is unlikely at this stage in the cycle. Especially give strong employment and increasing wage pressures. P has historically had trouble at the “overvalued” dotted line and E is out of gas. Earnings expansion is a really tall wish.
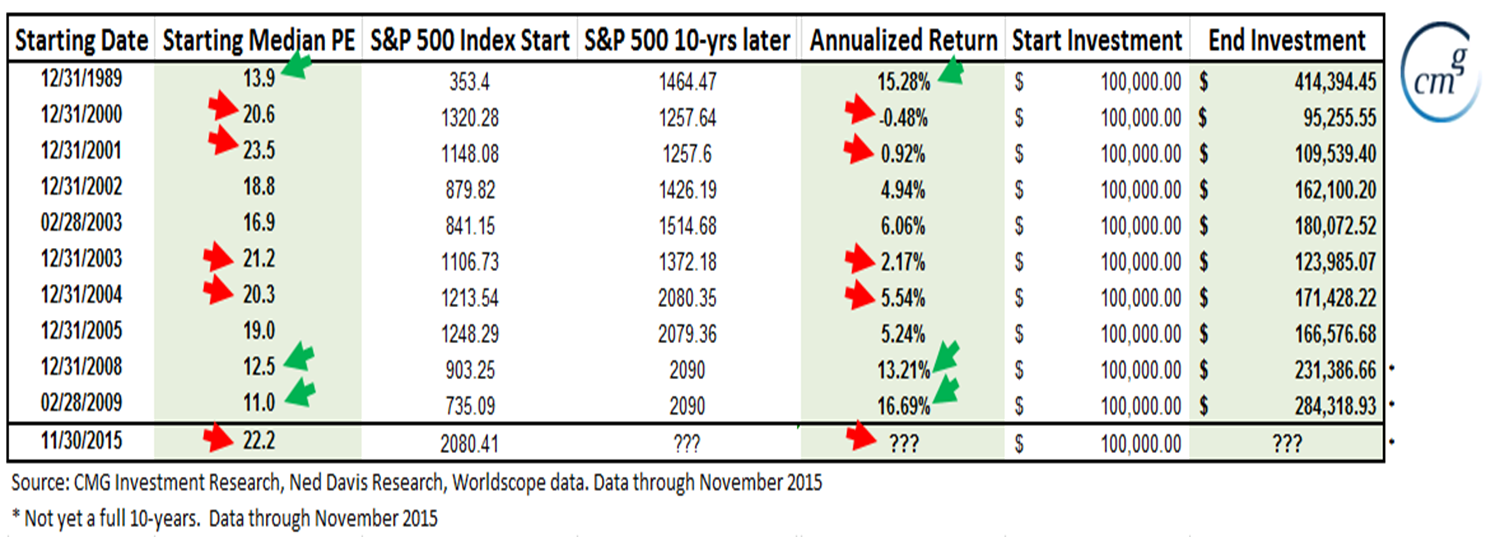
Here is another look at Median PE and probable forward 10-year returns. When PE is high, returns are low. We want to get aggressive into equities when PE is low. I’ll work with NDR to update this chart through 2015. Expect no significant changes.
Next is a look at selected periods in time and subsequent 10-year annualized returns (red arrows point to high PE periods and green arrows to low PE periods).
The best buying opportunities come during periods of economic recession so let’s look there next.
Recession Watch Charts
Chart 1 Global Recession (high probability a global recession has started)
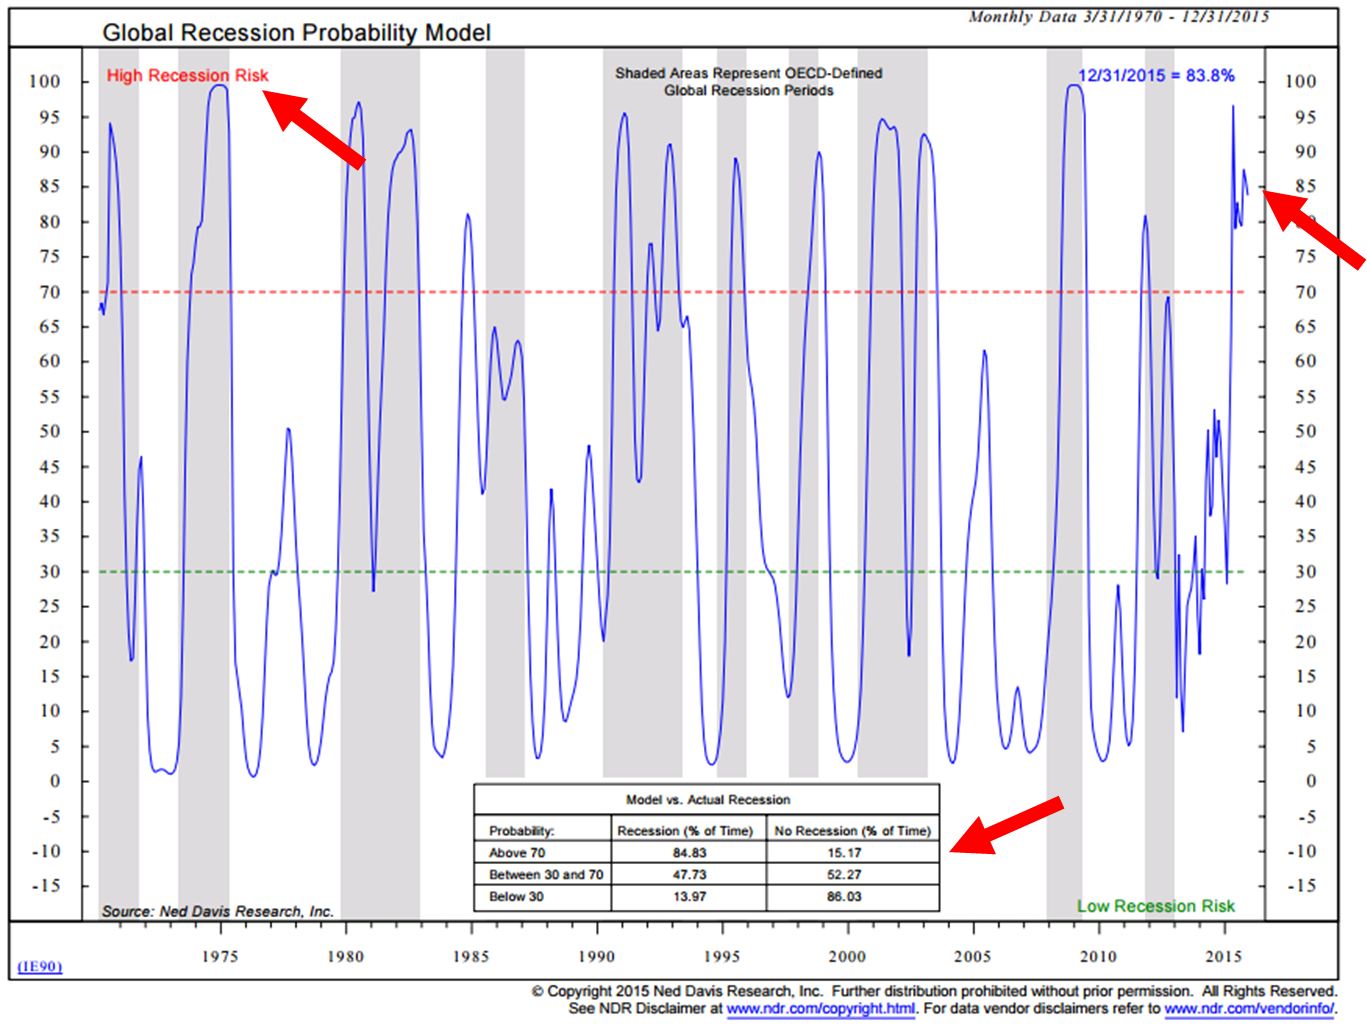
Chart 2 – U.S. Recession Watch (no sign of recession)
The gray shaded areas show all of the recession since 1948. The down arrows show when the data signaled coming recession. The up arrows show coming expansion.
79% of the historical signals were correct. There idea here is that the stock market is a very good leading economic indicator. At the end of December, this recession prediction process continues to favor U.S. economic expansion.
However, the trigger for contraction is a drop in the S&P 500 index, on a month end basis, 3.6% below its Five-Month smoothed moving average. Today, the S&P 500 is approximately 5% below its Five-Month Smoothing. We’ll see how the balance of January unfolds.
I have a few quick additional economic observations to share:
- There remains extreme weakness in commodities even when the impact of strong dollar is eliminated. My longer-term negative view on commodities remains.
- Oil – still not near a bottom. At every major bottom, bullish speculators have given up their bullish posture and go net short. Sentiment remains bullish; therefore, I see more decline in oil. Need to remove the extreme bullish sentiment before I feel good about oil.
- HY vs Investment grade. If we separate out commodities and energy we see that it is not just energy and commodities showing spreads widening (corporate bond yields rising faster than safer Treasury yields). HY will tell us a lot about the economy (recession). It appears to be signaling growing concern.
Election Year Charts
I simply thought you’d find this next chart interesting. Note the historical first half of the year market challenges during election years and the second half strength. Generally, when the market is confident it has identified the winner it typically begins to rally at that point. We’ll see.
Trade Signals – Rough Start to the New Year
Equity Trade Signals:
- CMG NDR Large Cap Momentum Index: Sell Signal – Bearish for Equities
- Long-term Trend (13/34-Week EMA) on the S&P 500 Index: Sell Signal — Bearish for Equities
- Volume Demand is greater than Volume Supply: Sell Signal – Bearish for Equities
Investor Sentiment Indicators:
- NDR Crowd Sentiment Poll: Extreme Pessimism (short-term Bullish for Equities)
- Daily Trading Sentiment Composite: Extreme Pessimism (short-term Bullish for Equities)
Fixed Income Trade Signals:
- The Zweig Bond Model: Sell Signal
- High-Yield Model: Buy Signal (Now a HOLD and nearing a SELL)
Click here for the link to the full Trade Signals (updated charts and commentary).
Personal note – Colorado, Florida and Lamb Chops
The travel schedule is full in January. NYC is ahead on January 21. I’m attending and speaking at the Inside ETFs conference in Florida on January 24-27. Here is a link to the speaker line up and agenda. It is the largest ETF conference in the industry. Attendance is expected to exceed 2,000. Please reach out to me by email if you are going to be there. I’d love to grab a coffee.
As I was sitting on a chair lift in Park City, Utah with my kids a week ago, a call came in from one of our trade execution partners. “Join us in Vail for a few days,” they said. Talk about a good day. The plan is to meet in Vail this coming Sunday, Monday and Tuesday. Attending will be other ETF strategists and trade execution experts. So much is gained in these types of meetings.
Following the Inside ETFs conference, on January 28, I’ll be in Venus, Florida (just south of Sarasota) meeting with the research team at Ned Davis Research. Really looking forward to that. Fortunately, Susan’s mother and father live in Venus so Susan is flying down for a few days. I see one or two of Patricia’s famous lamb chops and some nice red wine in my near future.
Hope this note finds your year off to a great start. Have a great weekend!
With kind regards,
Steve
Stephen B. Blumenthal
Chairman & CEO
CMG Capital Management Group, Inc.
Stephen Blumenthal founded CMG Capital Management Group in 1992 and serves today as its Chairman, CEO and CIO. Steve authors a free weekly e-letter entitled, On My Radar. The letter is designed to bring clarity on the economy, interest rates, valuations and market trend and what that all means in regards to investment opportunities and portfolio positioning. Click here to receive his free weekly e-letter.
Social Media Links:
CMG is committed to setting a high standard for ETF strategists. And we’re passionate about educating advisors and investors about tactical investing. We launched CMG AdvisorCentral a year ago to share our knowledge of tactical investing and managing a successful advisory practice.
You can sign up for weekly updates to AdvisorCentral here. If you’re looking for the CMG White Paper Understanding Tactical Investment Strategies, you can find that here.
AdvisorCentral is being updated with new educational resources we look forward to sharing with you. You can always connect with CMG on Twitter at @askcmg and follow our LinkedIn Showcase page devoted to tactical investing.
A Note on Investment Process:
From an investment management perspective, I’ve followed, managed and written about trend following and investor sentiment for many years. I find that reviewing various sentiment, trend and other historically valuable rules based indicators each week helps me to stay balanced and disciplined in allocating to the various risk sets that are included within a broadly diversified total portfolio solution.
My objective is to position in line with the equity and fixed income market’s primary trends. I believe risk management is paramount in a long-term investment process. When to hedge, when to become more aggressive, etc.
Trade Signals History: Trade Signals started after a colleague asked me if I could share my thoughts (Trade Signals) with him. A number of years ago, I found that putting pen to paper has really helped me in my investment management process and I hope that this research is of value to you in your investment process.
Provided are several links to learn more about the use of options:
For hedging, I favor a collared option approach (writing out-of-the-money covered calls and buying out-of-the-money put options) as a relatively inexpensive way to risk protect your long-term focused equity portfolio exposure. Also, consider buying deep out-of-the-money put options for risk protection.
Please note the comments at the bottom of this Trade Signals discussing a collared option strategy to hedge equity exposure using investor sentiment extremes is a guide to entry and exit. Go to www.CBOE.com to learn more. Hire an experienced advisor to help you. Never write naked option positions. We do not offer options strategies at CMG.
Several other links:
http://www.theoptionsguide.com/the-collar-strategy.aspx
https://www.trademonster.com/marketing/upcomingWebinarEvents.action?src=TRADA2&PC=TRADA2&gclid=CKna3Puu6rwCFTRo7AodRiQAlw


