
The 4wk average for US oil production ($USO) ($OIL) has now fallen 8 straight weeks (from 9.6M to 9.325M). That matches production cuts in Dec 2011 and we have to go back to the “Great Recession” to see deepers cuts. Given recent even sharper production declines over the last couple weeks (last week was 9.2M), that will easily hit 9 weeks when the EIA reports next week and it would take a significant production increase the following week to avoid 10 straight weeks of declines.
It is interesting that while the production cuts were deeper in the fall of 2008 than current (as the world entered into a true financial crisis), the duration of the cuts was far shorter than what we are seeing now. That says to me that those cuts were in response to temporary extreme factors (think back to the fall of 2008) and today’s are more fundamental in nature. What I mean by fundamental is that as hedges are being run off current production rigs are being shuttered if not economical at $40-$50 oil. Because of that I expect to see production continue to fall until oil prices rise back to $60-$70.
“Davidson” submits:
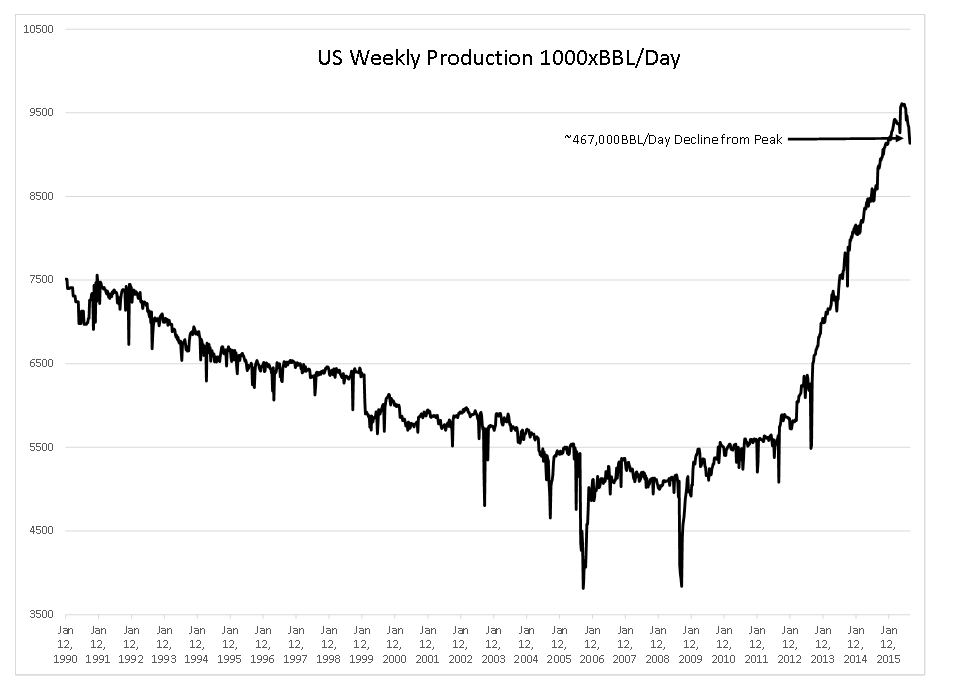
The EIA released the weekly average for US daily oil production with a decline now 467,000 BBL/Day below the July 3 peak of 9,604,000-see chart. The chart below shows the sharpness of the decline. One can estimate a fall in US daily production of ~2mil BBL/Day is possible at the current rate of decline. With declines likely coming elsewhere due to non-economic pricing, we could see market psychology concerning oil reverse before year end. With many using oil pricing as a proxy for the direction of economic trends, we could see a more general shift towards the more optimistic end of the spectrum. Time will tell on this. Market psychology is at all times nearly impossible to predict short-term.
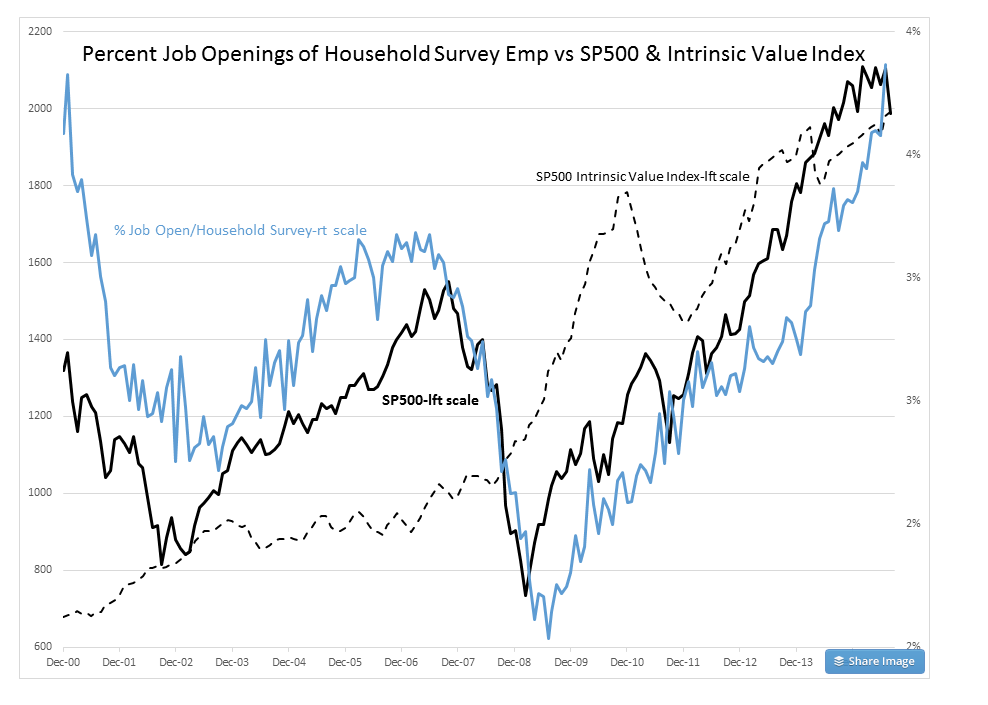
I created a new indicator plotting the percent of Job Openings relative to Household Survey Employment. The reason underlying this is due to the fact that Job Openings tend to lead the trend in Household Survey Employment. At economic peaks Job Openings tend to slow while employment is still rising and at economic lows Job Openings tends to rise even with still falling employment. Creating a ratio, Percentage of Job Openings of Household Survey Employment, enhances the differences in these two very related data series and creates earlier signals when the overall employment situation is changing. Key points are:
The % Job Openings to Household Survey Emp is plotted against SP500 and SP500 Intrinsic Value Index. Intrinsic Value Index is based on Knut Wicksell’s concept of the ‘Natural Rate’.
1) Data comparison is limited to Dec 2000-Present which is the extent of Job Opening data as a relatively new index
2) Chart shows connection between economic activity and investor psychology-SP500 set by investor valuation psychology
3) Intrinsic Value Index shows the Value Investor buying level, i.e. market finds support at this level as Value Investors ramp up their buying just as today
4) SP500 pricing above Intrinsic Value Index is due to Momentum Investors chasing economic activity and what they perceive as market trends
5) Economic activity drives equity pricing with Value Investors pricing lows and Momentum Investors pricing peaks
6) The SP500 2009 low fell well below Intrinsic Value Index due to FAS157 coupled to elimination of ‘Up Tick Rule’ and Hedge Fund trading.
7) SP500 has risen from 2009 in face of extraordinary pessimism which continues today.
8) Expectations are for a multi-year period of excess optimism and excess pricing before the economy peaks, a reversal of current pessimism.
No single indicator has ever captured major turns in markets with precision. Market psychology which drives prices is never repeated. While we always have knowledge of the past, we never know what future events will cause investors to flinch or run head-long into markets. Markets rhyme, but never, ever are they able to repeat!
I have not named this indicator, but am open to suggestions. Nonetheless, it is highly tuned to employment which appears to be in a serious uptrend.
I remain boringly very positive.
The post US Oil Production Continues to Fall appeared first on ValuePlays.


