Copper prices have long held the position in some investor’s minds as a viable economic indicator. So strong is this belief that many call it ‘Dr. Copper’ (as in PhD in Economics) ($HG_F) . But, for some time copper has reflected the vagaries of market psychology. While very early in 1900s copper prices rose and fell on demand/supply of WWI and the Great Depression, WWII saw prices rise on lowered production and a clear definable relationship has not existed since. Yet, the myth of ‘Dr. Copper’ persists. In the Copper chart below its World Production is shown by the DARK RED LINE while its Price in US$ per metric ton is shown by the LIGHT BLUE LINE. The DASHED BLACK LINE is my hand drawn long term price trend estimate. Use the link above the chart to access the source data at the US Geological Survey site.
Copper
One can see two major price peaks after 2004 with 2012 peaking at $4.44bl which differ substantially from the long term trend. My reason for not adjusting the long term trend for this period of high prices is that they come from the mania of Chinese raw material demand which began in 2004. That China was going to gobble up all global supplies of raw materials was quite prevalent and even caused oil to spike over $140bbl ($USO). Media reports often reported that copper saw increased demand as collateral for debt issuance.
[drizzle]
The news of late is that China has used too much debt internally and this has resulted in excess capacity in many industries, excess air/water pollution and even empty cities. Much of this overbuilding occurred according to government planning. This debt was not incurred in the pursuit of economic return and therefore this debt does not have the cash flow return to repay it. Recent Chinese stock market gyrations reflect a multifold increased use of borrowed funds. As the ‘promise of easy riches’ unravels in the slowing of the Chinese growth story, loans are beginning to default. Chinese copper demand has slowed and perhaps may even reverse. This should cause global copper prices to fall further.
We have seen some copper price decrease since 2012. But, the high prices of earlier years stimulated efforts to increase production which take years to get on stream. The last values we have from the USGS are from 2013 and increased production appears to be occurring just as prices are falling. Currently copper prices for July 2015 are $2.52lb. If copper falls to my hand drawn trend line, it will be priced less than $2lb. This is occurring even with accelerating global economic activity.
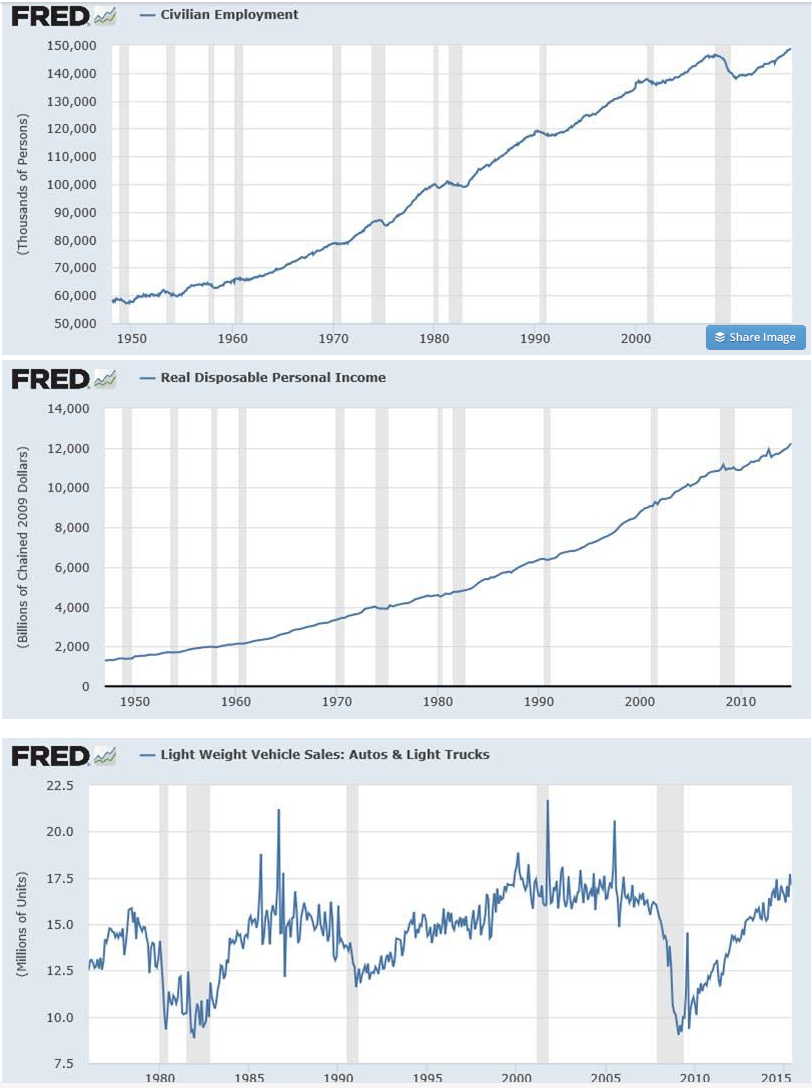
Falling copper prices (as did falling oil prices last year) do not reflect bonafide economic activity but a change in speculation and the use of copper as a financial asset. Global economic activity is clearly rising with Europe and US reporting record Light Weight Vehicle Sales. Dr. Copper long ago lost its shine as a pure economic indicator just like many other commodities. I think it is better to look at the actual economic indicators themselves. The St Louis FRED sitehttps://research.stlouisfed.org/fred2/ provides 267,000 separate economic EXCEL databases. We currently have record Civilian Employment, record Real Disposable Personal Income, record Light Weight Vehicle Sales and records elsewhere which indicate reasonably good economic activity. See the FRED charts below.
The next time you hear someone say that oil, copper or some other commodity is ‘predicting something’, just ignore it.