The data keeps supporting a rate hike sooner rather than later. Like the end of QE, this will be viewed as “bad for the markets” when the reality will be it is only ending because higher rates are in fact needed at this point. Higher rates will expand lending, by both increasing the earnings of financials and increasing the risk level of borrowers they will lend to as they are increasingly rewarded for doing so (to see how truly tight mortgage lending is simply go here) . I’ve been of the opinion low rates are hampering the recovery for some time and think that higher rates will usher in the next leg of growth and another surge higher in markets as they follow the economy.
“Davidson” submits:
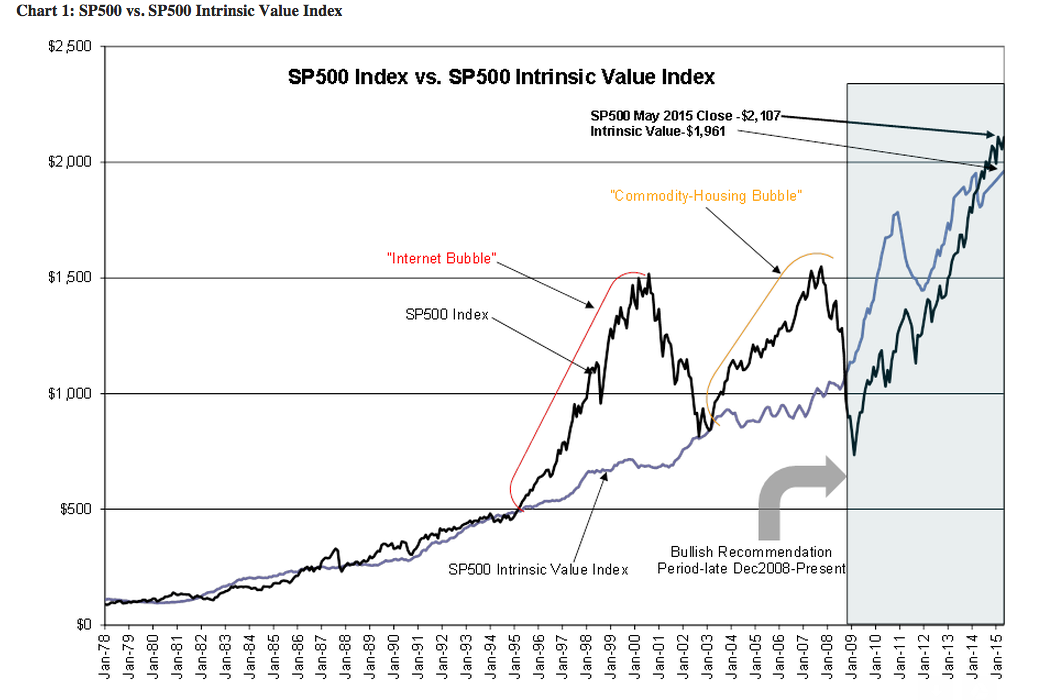
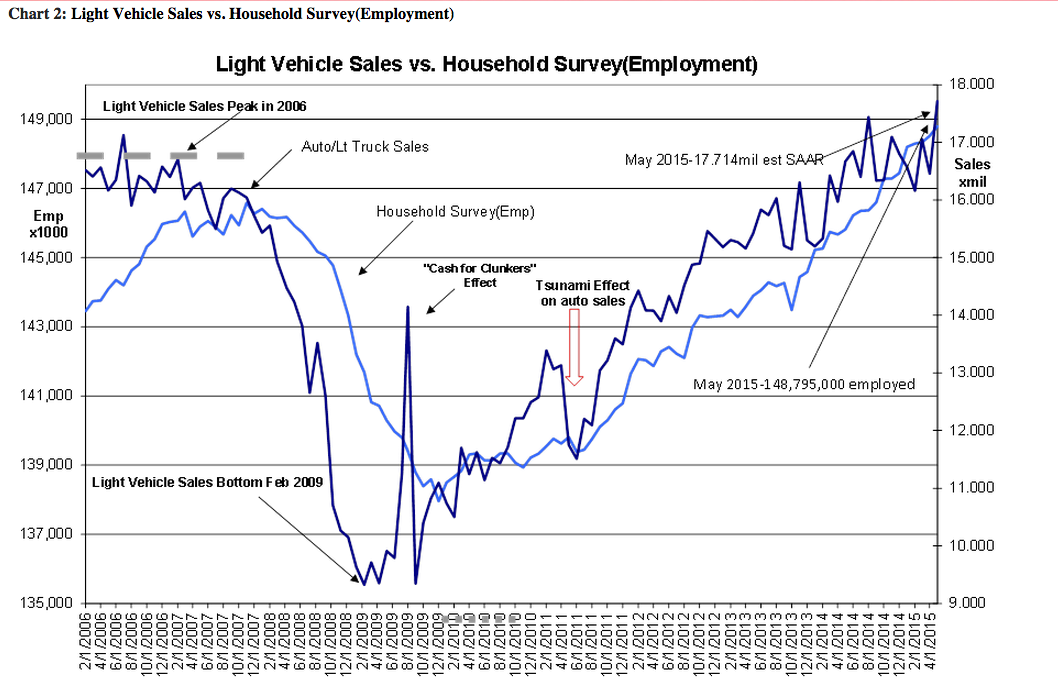
Dallas Fed 12mo PCE Inflation remains 1.6% and has averaged ~1.6% since Jan 2014-see the 12-month PCE inflation table below. This inflation value is added to the long term trend of US RGDP of ~3% which is the capitalization rate for SP500 Long Term Earnings Trend ($90.46shr-May 2015) to yield the value for the SP500 Intrinsic Value Index of $1,961-see Chart 1:S&P 500 vs. S&P 500 Intrinsic Value Index chart below. The S&P 500 is ~7% above the SP500 Intrinsic Value Index. There is little risk of a significant lasting correction considering the trends in Vehicle Sales and Employment shown in Chart 2: Light Vehicle Sales vs. Household Survey(Employment).
S&P 500
Light Vehicle sales were reported Tuesday at 17.714mil SAAR(Seasonally Adj. Annual Rate) while the Household Survey employment level, was reported this morning, at 148,795,000 or 272,000 higher than April 2015. Rates are beginning to rise as investors shift out of fixed income for higher expected returns from equities. The past 10dys has seen significant volatility in bonds. I expect this to continue and expect that we will eventually see 4%-5% 10yr Treasury rates before the equity markets peak. I estimate that we may have another 5yrs+ of higher equity prices.
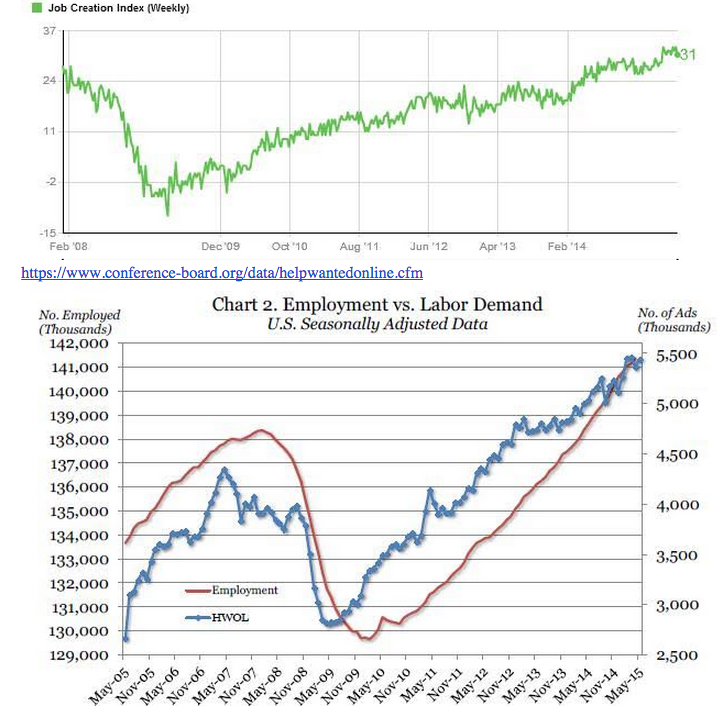
The estimate for higher equity prices finds support in The Gallup Job Creation Index and The Conference Board’s Help Wanted Online Index shown at the bottom. Both of these indices show that demand for labor is in a strong uptrend. These indicators forecast greater employment the next 12mos-18mos. Higher employment equates to broader economic expansion and higher equity prices typically have followed. Inflation has never proven a factor in holding back stock prices. Market psychology turns generally towards the belief that equities are the better vehicle when inflation is rising. Such is the impact from market psychology that the past 2 cycles saw significant market appreciation and excess valuation in the second half of the business cycle.