Spring has sprung, yet many market pundits are worried about the softening economic reports, causing me to remember the book “Being There” by author Jerzy Kosinski. The story revolves around a simple-minded man named Chance “the gardener,” who knows only gardening and what he sees on television. For his whole adult life Chance has not ventured outside the grounds of his employer’s Washington D.C. manor. Eventually, however, the employer dies and Chance is cast out onto the streets, where through an auto mishap he encounters the wife of a D.C. powerbroker. Thinking her car was the reason for the accident, she insists that Chance “the gardener,” who she interprets to be Chauncey Gardiner, come with her to her husband’s estate. Benjamin Rand (the husband) is completely taken with Chauncey’s simple, direct approach, and mistakenly attaches profundities to Chauncey’s ramblings about gardening. Viewing him somewhat as a savant, Rand introduces Chauncey to Washington’s elite, including the President. In one verbal exchange regarding current economic conditions Chauncey remarks, “As long as the roots are not severed there will be growth in the spring.”
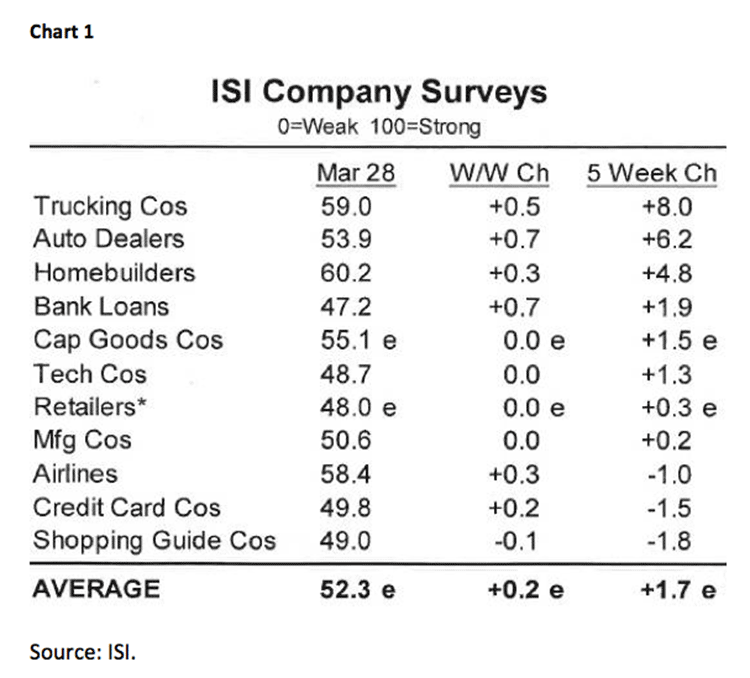
Well, here we are. It’s spring again, yet this year instead of the typical cries of “As long as the roots are not severed there will be growth,” many Wall Street pundits are worried. However, I am feeling rather confident that as the weather warms “there will be growth.” Indeed, it appears there is huge pent up demand as the folks above the 40? N longitude, and given the extent of the wicked winter maybe as low as above the 30? N Longitude, are going to go on a spending spree as the weather warms. Case in point, recently I spoke to an auto dealer who told me last March his dealership sold a total of 62 cars. This year his run rate, as of a week ago, was for 169 car sales in the month of March. Such metrics are being confirmed by the venerable ISI organization that writes, “ISI’s company surveys are on track to bounce a significant +1.7 over the past five weeks, led by truckers, auto dealers, and homebuilders. This strongly suggests the economy is bouncing back from bad weather, as do unemployment claims (see chart 1). And, if Barron’s is right (the cover story this week is “Bad News For Putin: Cheap natural gas, plentiful new oil finds, and efficient production methods will drive oil prices to $75 a barrel), oil at $75 per barrel will cause gasoline prices to decline, providing a huge tail wind for consumers. Remember, each penny decline in gasoline puts roughly $1 billion of additional purchasing power into the hands of the consumer. Certainly the “commercial traders” think crude oil is going to decline, having built their largest net short position of all-time!
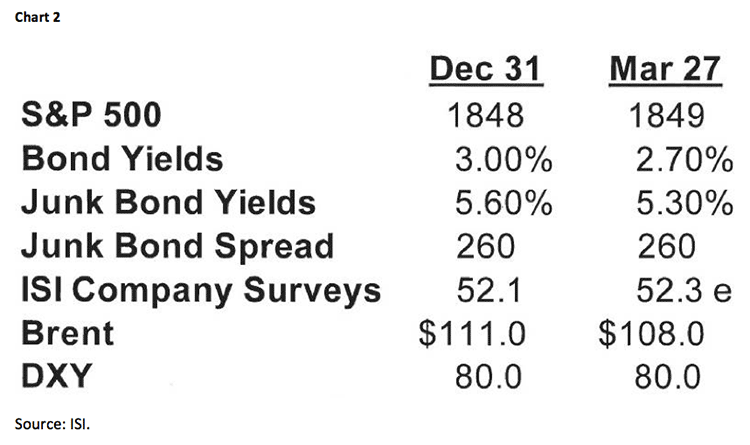
The astute ISI folks go on to note, “Equities are under pressure, but the economic backdrop is remarkably stable” (see chart 2). And, stable seems to be the action du jour for the equity markets given that the S&P 500 (SPX/1857.62) has been trapped in roughly a 50-point trading range since mid-February. It is also pretty amazing, given all the “shucking and jiving” the SPX has done, that it is only up 0.5% year-to-date. But while the major indices have hugged the flat line YTD, many stocks have experienced 20% declines. Last week the biotech complex was particularly punished, leaving most of the biotech indexes off ~20% from their late-February highs. Despite such slides, the macro selling has not been all that intense, with only March 13th registering an 80%+ Down Volume session. Typically it takes a 90% Downside Day, or a series of 90% Downside Days, to end a correction. So, we are likely either not in a correction or into a stealth correction that has further to run on the downside. At this point in time I am leaning toward the later (more on the downside) because of the aforementioned reasons and because something just does not feel right. As The SentimenTrader’s always insightful Jason Goepfert writes:
The “Smart Money Index” that subtracts the S&P 500’s performance during the first half-hour of trading and adds the last hour has plummeted by over 20% during the past two weeks. This shows a repeated pattern of buying during the early morning and selling in the afternoon. Since at least 1998, the index has never suffered a decline like this over a two-week period. The only time that volatility neared this kind of level was late 2007 / early 2008. We’re not reading that much into it, but generally a rapidly declining SMI when stocks are near a high leads to sub-par returns going forward.
Then there was this from my friends at Bespoke Investment Group: “If you trade intraday, you’ve probably noticed the strange pattern equity markets have been locked in for the past several weeks. Strong opens build momentum, then start giving up gains between noon and 1 p.m. The weakness continues into the afternoon, gearing up again around 3 p.m. before an occasional bounce into the close.”
There it is again, “The strange pattern the equity markets have been locked in for the past several weeks.” The fact of the matter is there are indeed times when the stock market is strange and trendless. I have learned the hard way when that happens you can lose a lot of money trying to force a trade or for that matter an investment. Currently, the equity markets are in one of those strange and trendless periods, which is why Andy Adams so eloquently wrote in last Thursday’s Morning Tack, “I don’t know, and that’s ok.”
That said, by my work there are no signs the secular bull market is coming to an end. One of the few negatives I see on a short/intermediate term basis is that the number of new 52-week highs is shrinking. Also suggesting there may be some more downside to come is the Russell 2000 (RUT/1151.81), which has traveled below its 50-day moving average (DMA) of 1162.67. Historically small capitalization stocks, as represented by the RUT, are the first to display weakness. That weakness is also apparent in the various NASDAQ indices that have likewise violated their 50-DMAs. So far, however, the D-J Industrials (INDU/16323.06), D-J Transports (TRAN/7451.36), Value Line Arithmetic Index (VLA/4413.33), the SPX, etc. have not traveled below their 50-DMAs. For the record those moving averages are 16120.53, 7372.75, 4380.27, and 1834.05, respectively. Eventually the stock market will resolve its current range-bound indifference, but until it does I remain cautious on a trading basis.
The call for this week: The SPX is still locked in a trendless 50-point trading range while some of the “tell” indices have broken below their 50-DMAs, as well as near-term support levels. Important support for the SPX is at its March 14th reaction of 1839.57, which is in the 1835 – 1840 support zone often mentioned in these reports. A break below that level, on a closing basis, would suggest the 1780 – 1800 level should come into play. The quid pro quo is that a close above 1860 would indicate another attempt at the all-time highs. The recent retest of those all-time highs failed and occurred on light volume, raising the probability that a breakout to new all-time highs was pretty low. In fact, a traders’ “sell signal” was triggered last week when the 14-day Stochastic crossed below its moving average. Of interest is that the NASDAQ Financial 100 Index broke below its rising trendline last week. As readers of these missives know, I avoided the Financials, for the most part, from 1999 until 2012. Since 2012 I have over-weighted them, and I continue to like them, because they are cheap! Last week’s breakdown was mainly caused by Citigroup’s (C/$47.25/Strong Buy) swoon on its Fed’s “stress test” failure. Our fundamental banking analyst, Anthony Polini, had this to say about that in his company comment published March 27:
We reiterate our Strong Buy rating on Citigroup (C). Our investment thesis is still intact despite its qualitative CCAR failure. We view any near-term stock price weakness as a buying opportunity. While the good news on capital return is clearly delayed, our investment thesis remains intact. Furthermore, an accelerated disposition of Citi Holdings assets should pave the way for even more capital returns in subsequent years and help to re-establish positive stock price momentum. We still expect the company to return more than $10 billion annually in each of the next three years. The stock was up 7% last week and will probably give that gain back this week, but upside potential remains well above average given EPS power of $7.00 by 2017. We forecast tangible book value per share to hit $59.00 by year-end 2014 and believe the company will likely exceed all of its capital requirements. Regarding Citigroup’s shortfall, the Fed cited deficiencies in capital planning practices, including areas the Fed previously identified as requiring attention and not having shown sufficient improvement. These included its ability to project revenue and losses in the stress scenario for parts of the global operations and its internal stress testing developments to address its full range of business activities and exposures. According to the regulators, “taken in isolation, each of the deficiencies would not have been deemed critical enough to warrant an objection, but, when viewed together, they raise sufficient concerns regarding the overall reliability of Citigroup’s capital planning process to warrant an objection to the capital plan and require a resubmission.” The company is in the process of evaluating the issues identified, and we should have more details on the 1Q14 conference call (Monday, April 14). Given the Fed comments, a conditional approval may have been more appropriate. You can’t help but wonder if the recent problems in Mexico tipped the scale to failure. Three U.S. subsidiaries of foreign bank holding companies (HSBC, Santander, and RBS Citizens) also failed for qualitative reasons, which appeared to be much more grievous.
Recommendation: Our 12-month target price of $62.00 is based on 10.5x 2015E EPS of $5.88 and about 105% of tangible book. This compares to our recent industry averages (for the nation’s 40-largest banks) of about 13.3x 2015E EPS and 183% of TBV. We believe the discount to peers is warranted given risk factors related to the global economy and regulatory environment.