If you have been following my blog postings, you are probably aware that I have an obsession with equity risk premiums (ERP), and have done an annual survey paper on the topic every year since 2008 (with the 2013 update here). I also post a monthly update for the ERP for the S&P 500 at the start of the month on my website. As a consequence, my attention was drawn to a post by Fernando Duarte and Carlo Rosa, economists at the Fed in New York, on the topic. They argue that equity risk premiums are at historic highs, primarily because the US treasury rates are low, and note that these high equity risk premiums are a precursor to good stock returns in the future. I don’t disagree with their authors that equity risk premiums are high, relative to history and that the low risk free rate is in large part responsible these large premiums, but I am less sanguine about using the ERP as a market timing device, especially at this time in history.
Measurement approaches
There are three ways of estimating an equity risk premium. One is to look at the difference between the average historical return you would have earned investing in stocks and the return on a risk free investment. Thishistorical premium for the 1928-2013 time period would have stood at about 4.20%, if computed as the difference in compounded returns on US stocks and on the 10-year US treasury bond. (I know. I know. We can have a debate about whether the US treasury is truly risk free, but that is a discussion for a different forum.) The second is to survey portfolio managers, CFOs or investors about what they think stocks will generate as returns in future periods and back out the equity risk premium from these survey numbers. In early 2013, that survey premium would have yielded between 3.8% (from the CFO survey) to 4.8% (portfolio managers) to 5% (analysts). Finally, you can back out a forward looking premium, based upon current stock prices and expected cash flows, akin to estimating the yield to maturity on a bond. That is the process that I use at the start of every month to compute the ERP for US stocks, and that number stood at 5.45% On May 18, 2013.
What is the ERP?
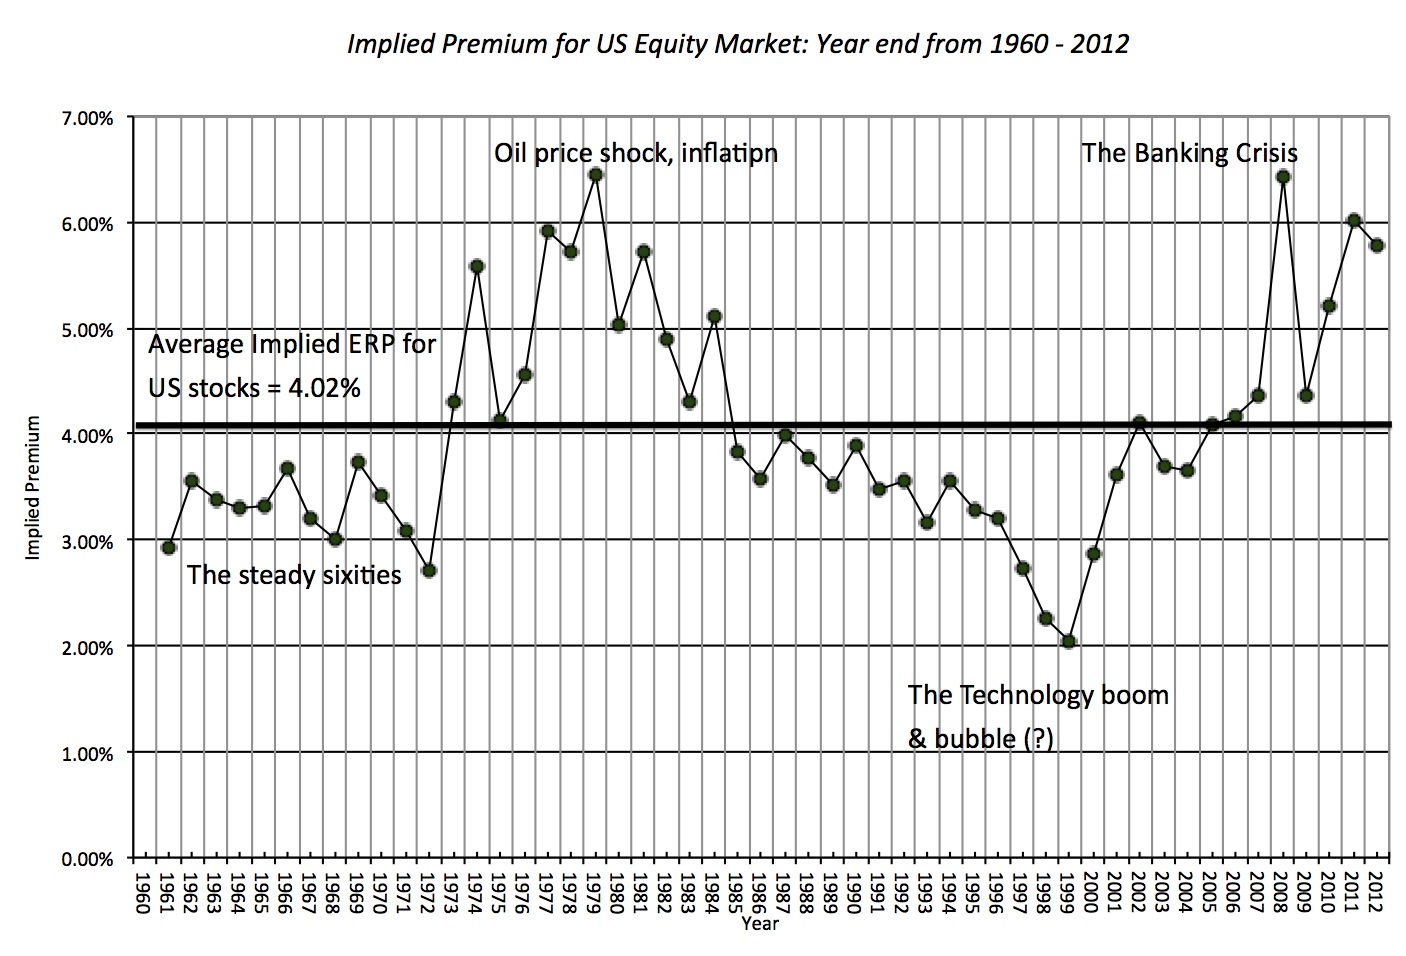
The equity risk premium is the extra return that investors demand over and above a risk free rate to invest in equities as a class. Thus, it is a receptacle for investor hopes and fears, with the number rising when the fear quotient dominates the hope quotient. In buoyant times, when investors are not fazed by risk and hope is the dominant force, equity risk premiums can fall. In the graph below, you can see my estimates of the implied equity risk premium for US stocks from 1961 to 2012 (year ends) with annotations providing my rationale for the shifts over time periods.
The average implied equity risk premium over the entire period is 4.02% and that number is the basis for the bullishness that some investors/analysts bring to the market. If the equity risk premium, currently at 5.45%, does drop to 4.02% , the S&P 500 would trade at 2270, an increase of 26.5% on current levels. And history, as Duarte and Rosa note, is on your side, albeit with significant noise, in making this assumption that equity risk premiums revert back to norms over time. As I will argue in the next section, the high ERP in 2013 is very different from high ERPs in previous time periods and extrapolating from past history can be dangerous.
A Fed-engineered ERP?
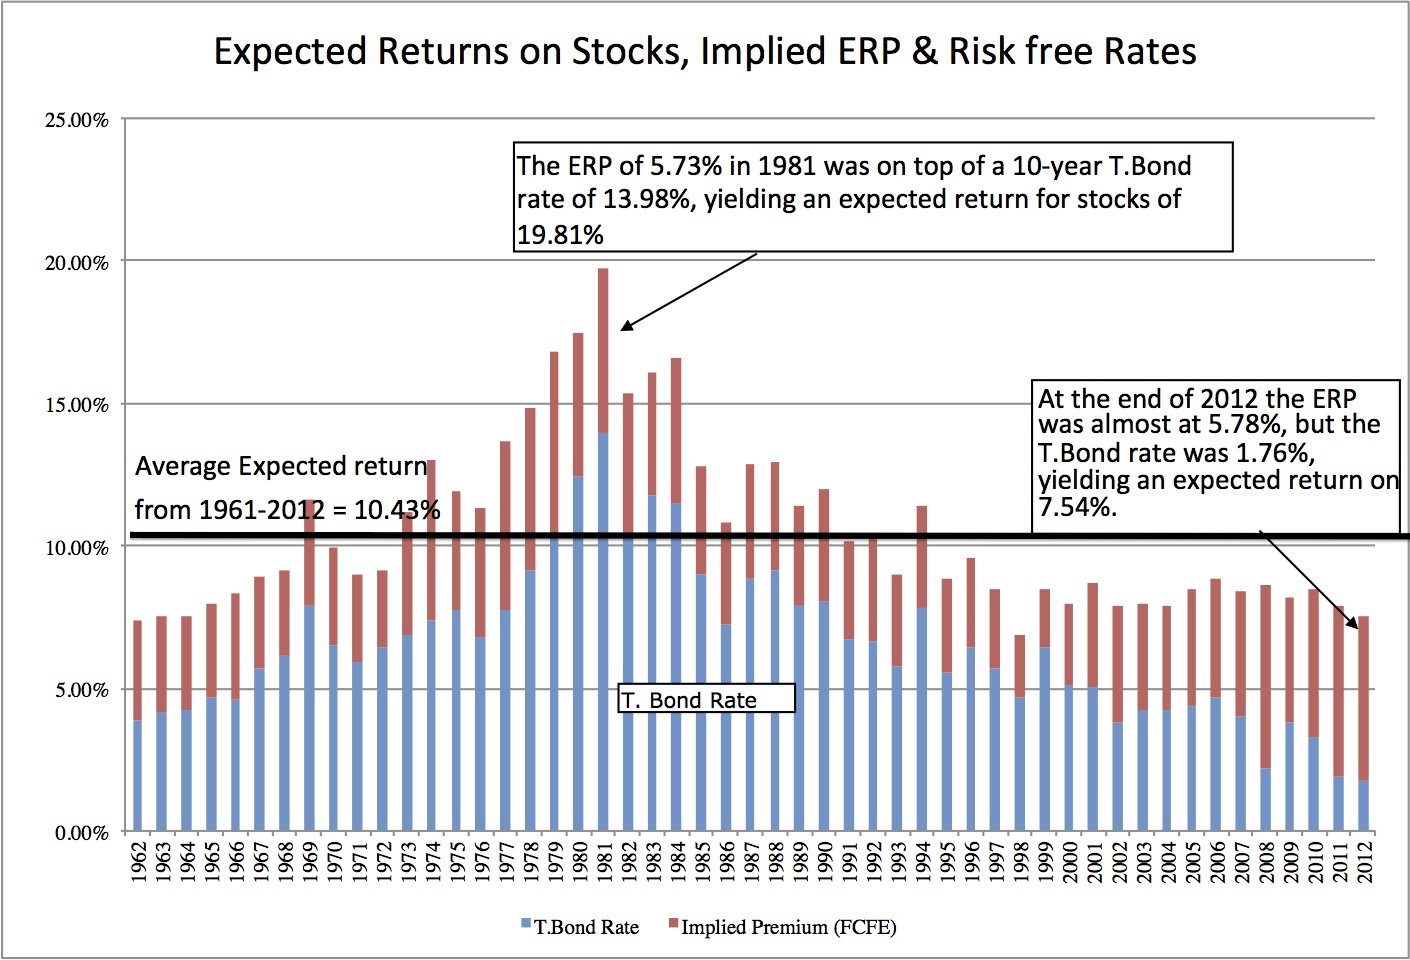
This equity risk premium, though, is over and above the risk free rate. To provide a sense of the interplay between the risk free rate and the equity risk premium, I plot the expected return on stocks (based upon future cash flows and current stock prices), decomposed into the equity risk premium and the and the risk free rate each year from 1962 to 2012.