No doubt a big storyline during 2011 was the massive move lower in Treasury yields – particularly at the long end. Take comfort Bill Gross – there were no shortage of market experts that missed this move. Consider in late May/early June the most bullish forecast among major Wall Street economists was for the 10yr (which was trading at ~3%) was to finish 2011 at a 3.25% yield. The most bullish person expected “only” a 25bp rise in yield. Among my many misses during the year, I correctly posited in June that the 10yr would hit 2%.
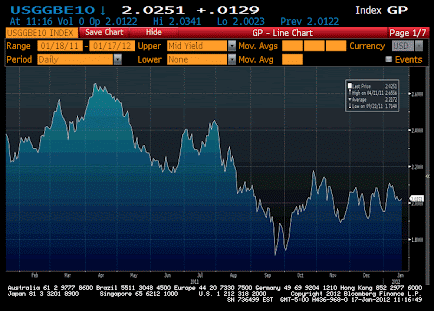
More interesting though, in my opinion, are the component pieces of the 10yr returns. Contrary to many people’s initial thoughts, inflation expectations on the long end haven’t fallen that much. To be precise, year over year 10yr inflation expectations (as measured by the 10yr breakeven) have fallen ~35bps. We know during this same period the 10yr treasury has fallen by ~150bps. Consider the following charts below:
10yr Breakeven (down about 35bps YoY)
10yr Yield vs 10yr Breakeven – essentially 10yr Real Yields
As you can see from the chart above, Real Yields on the 10yr have gone from over 100bps to negative ~16bps today. The vast majority of change in 10yr yields have come from a reduction in real yields – not inflation expectations. Now clearly, the drop in longer term inflation expectations is nothing to dismiss, but the point remains. In a time where real yields are significantly negative on the front end, it is understandable that many players are seeing “relative value” in longer term USTs.


