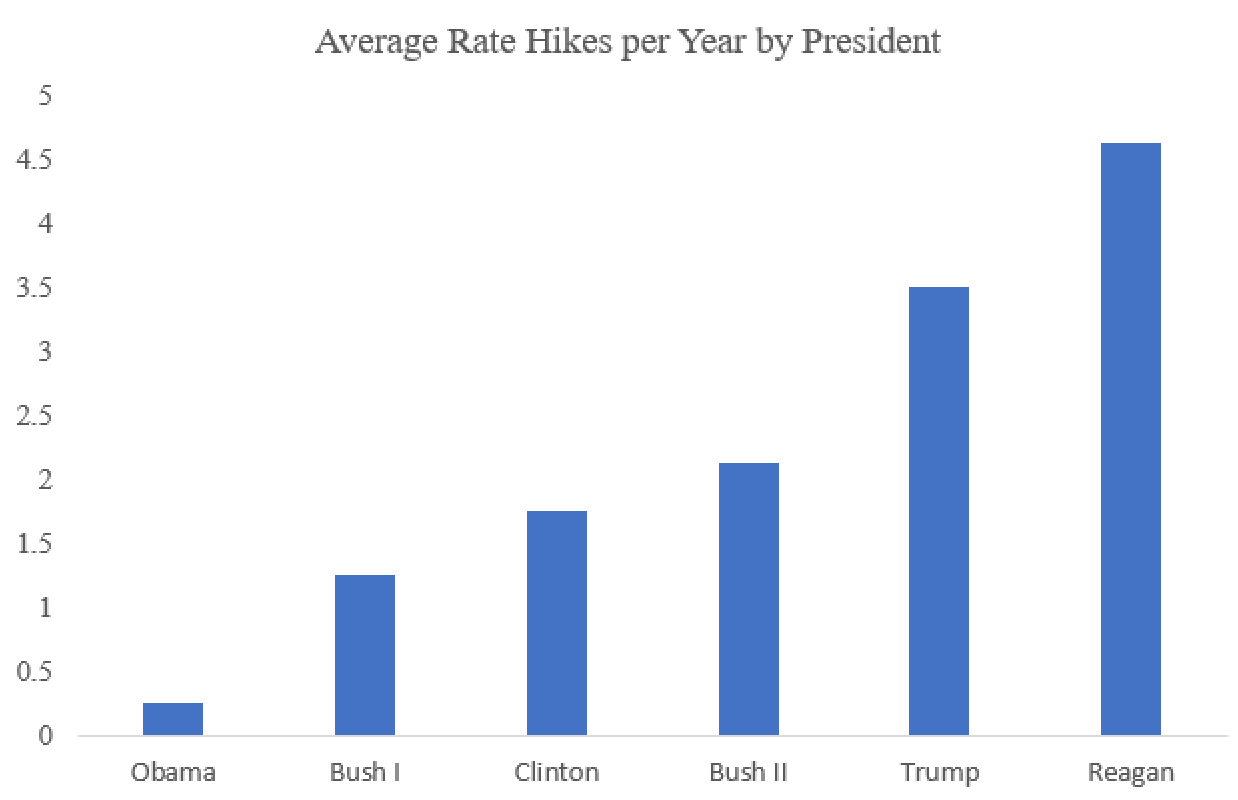
The Fed Has A Party Bias, But Question Is How Well They Hide It?
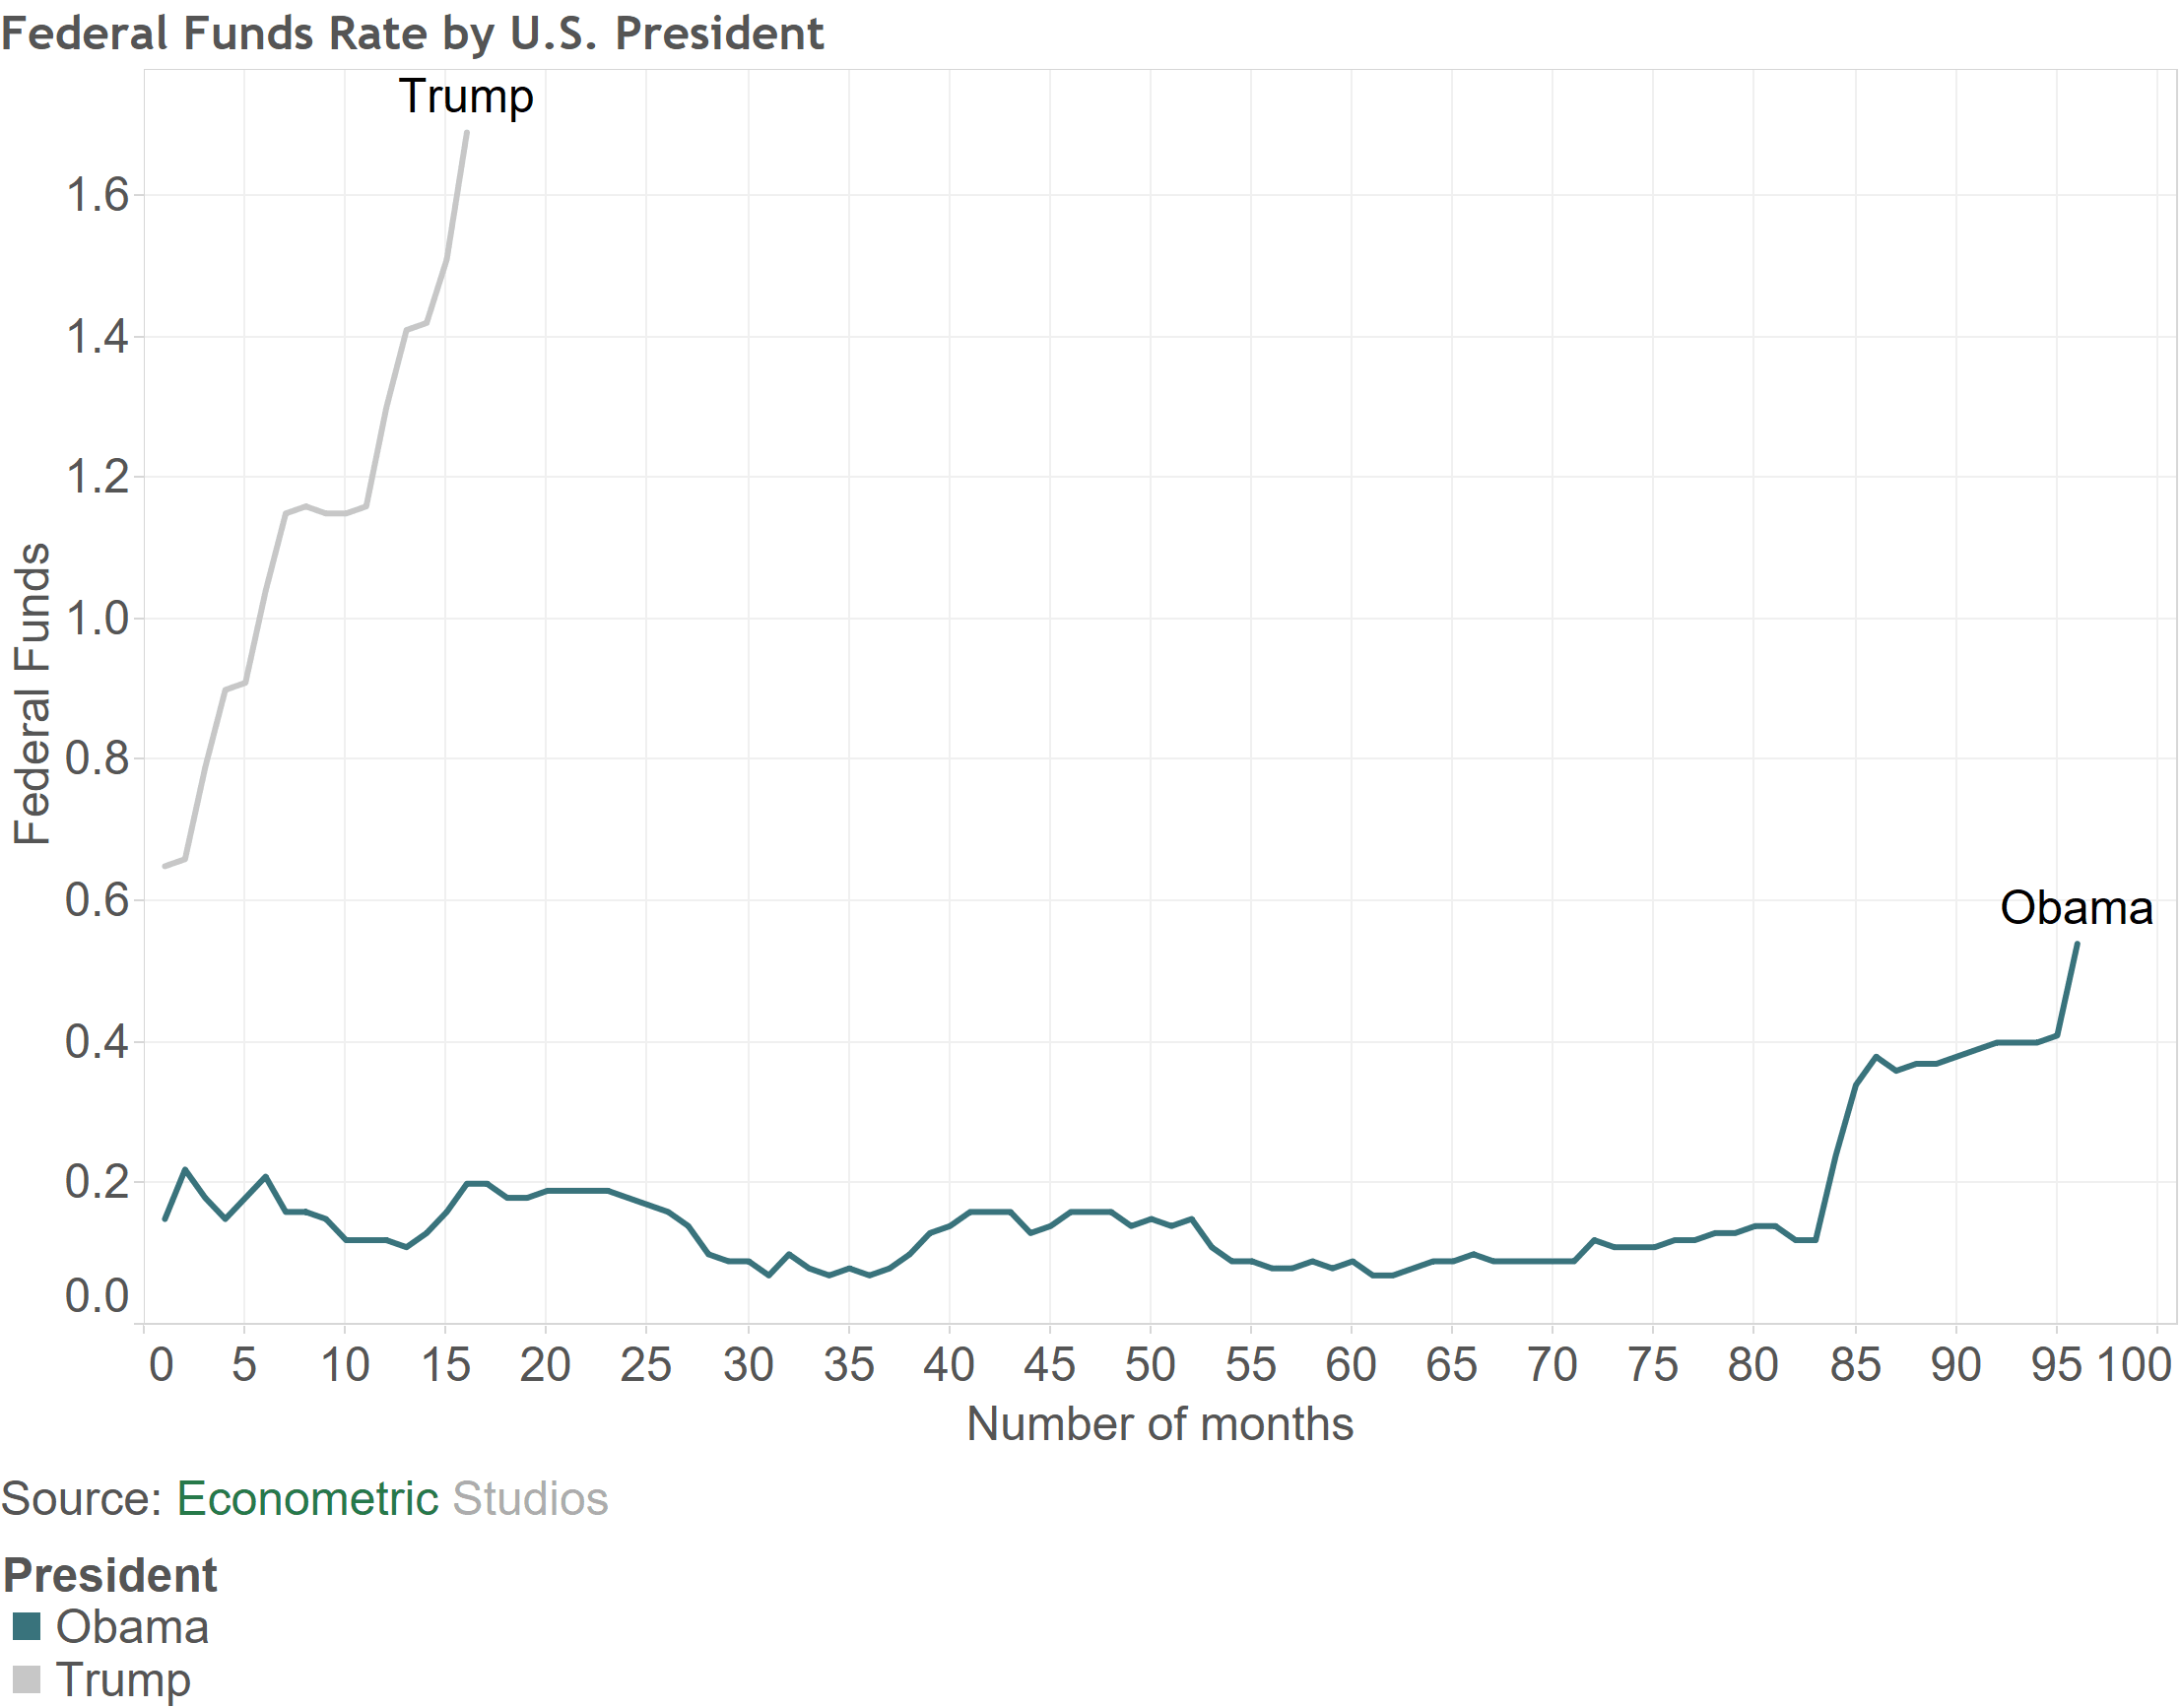
Unless a rock has subsumed you, you’re aware of the battle between President Trump and the Federal Reserve. Does President … Read more
Unless a rock has subsumed you, you’re aware of the battle between President Trump and the Federal Reserve. Does President … Read more
Hotly debated among demographers today is the happiness of the younger generation. Some analysts point to lower income. Others point … Read more
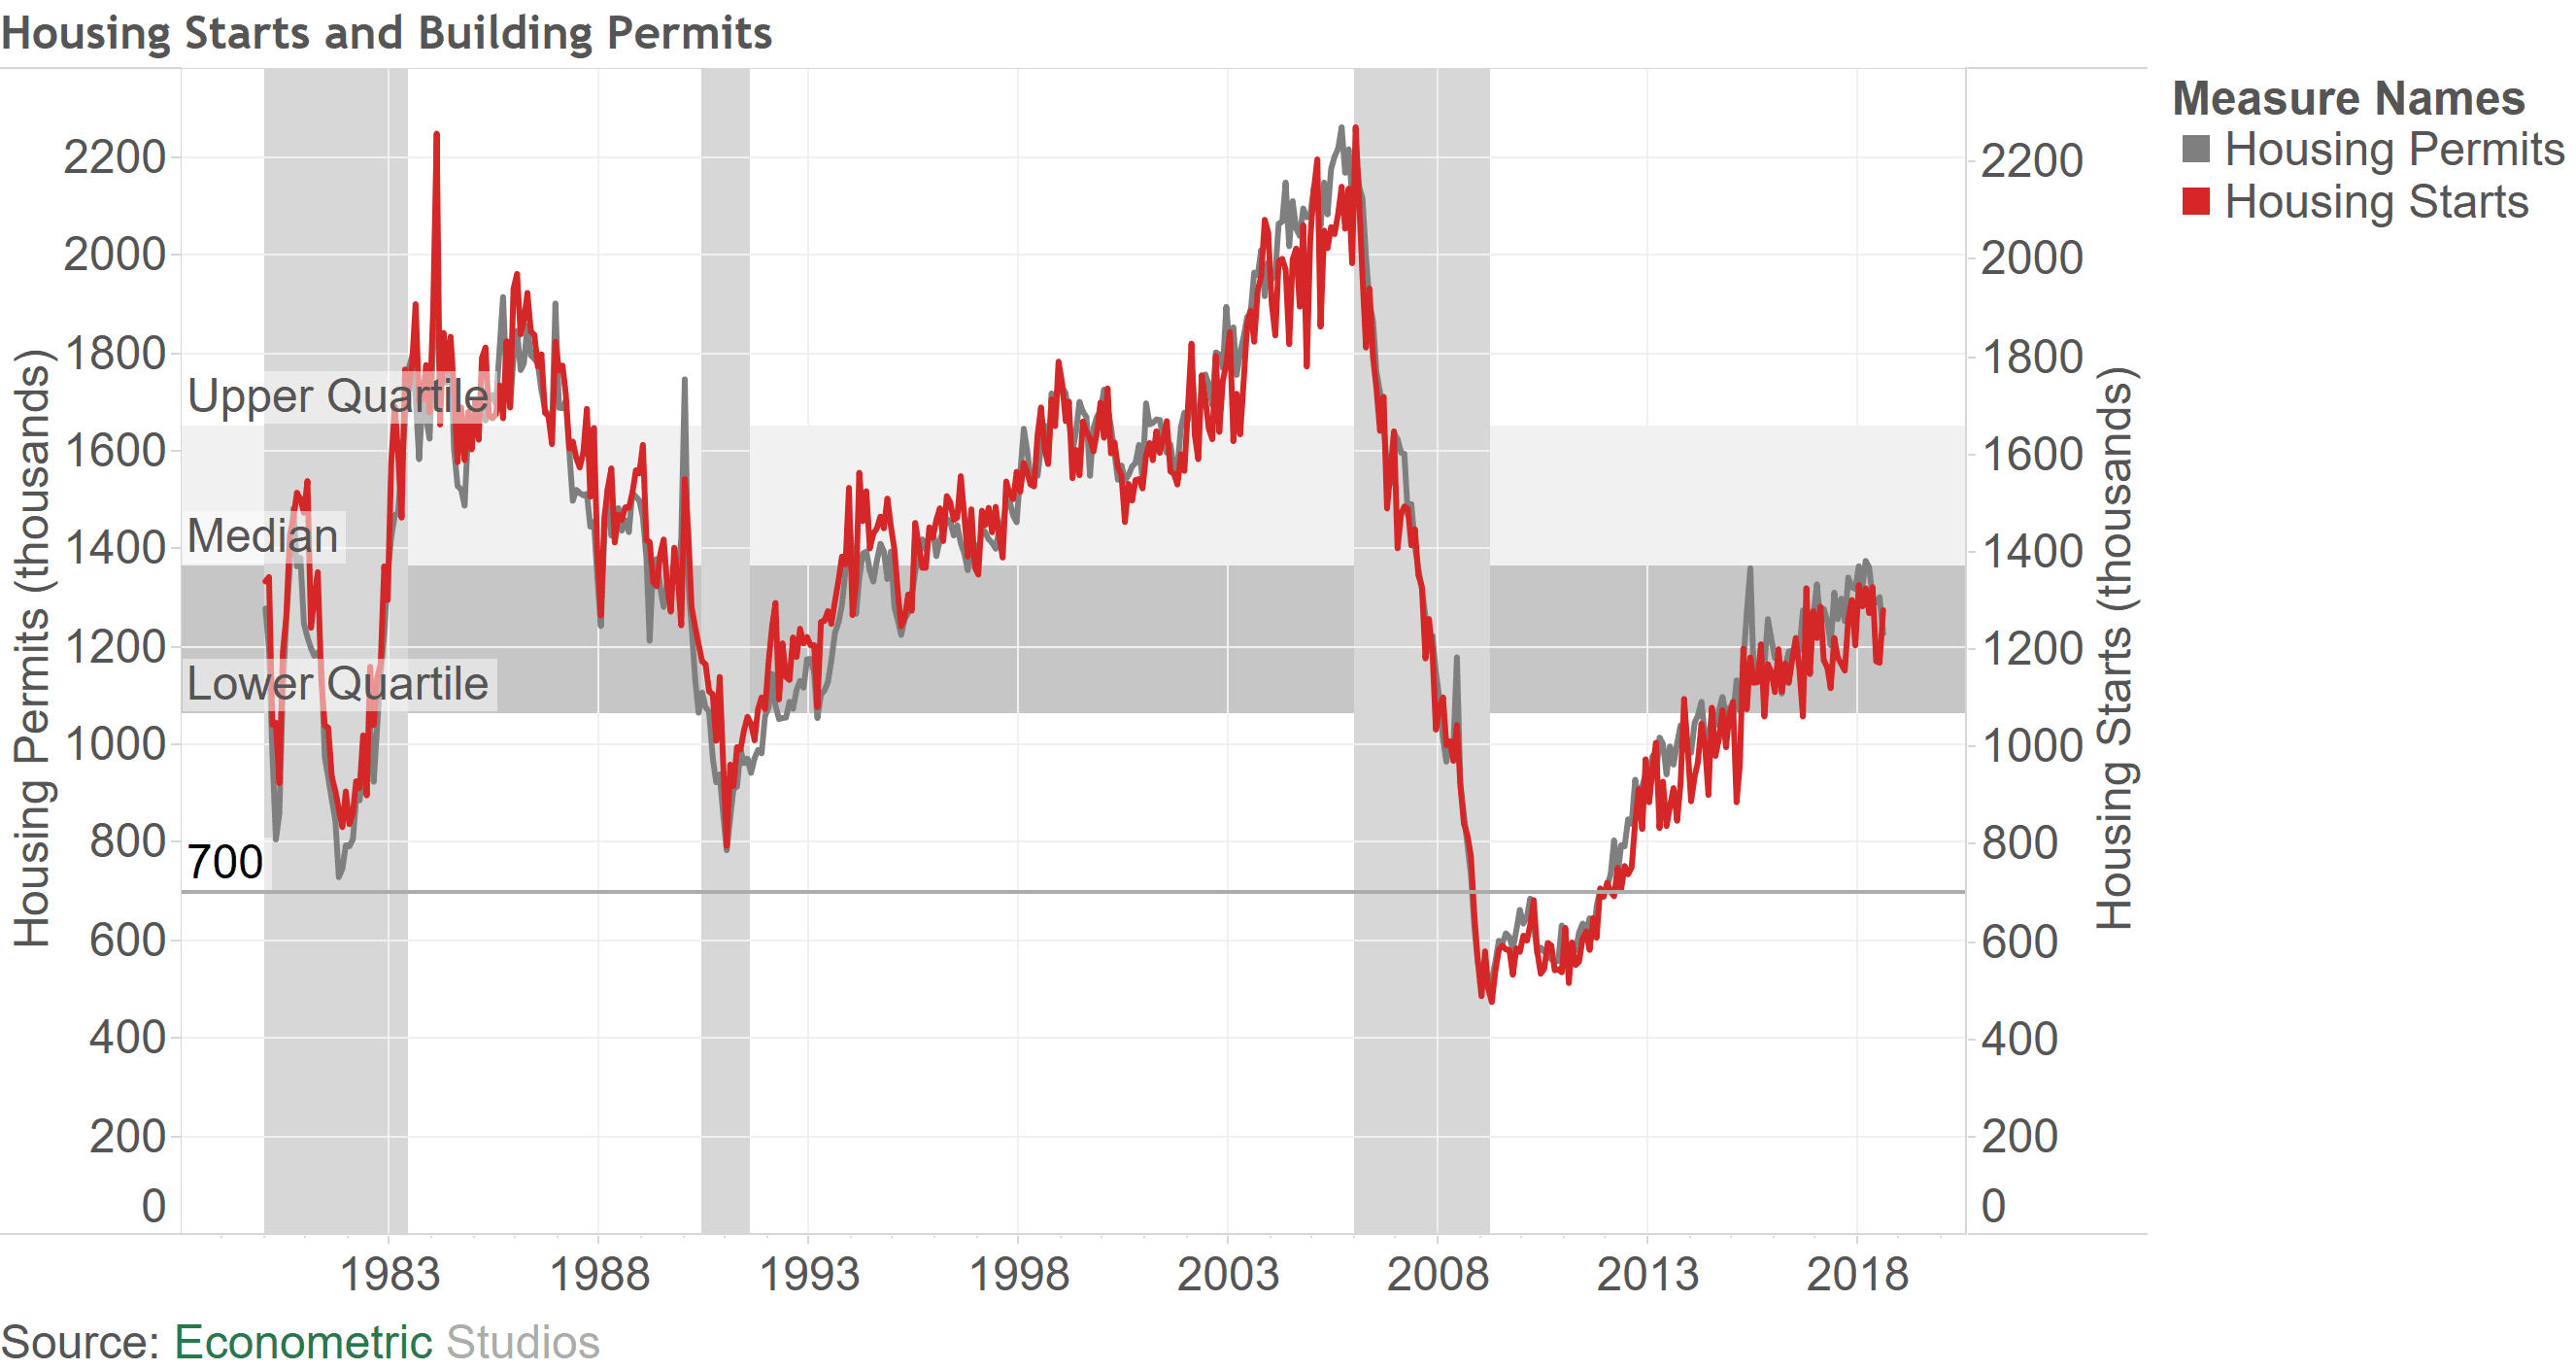
Housing took center stage this past week. Housing starts, new and existing home sales, and Case-Shiller home prices gave us … Read more
The question is a bit of a misnomer. Economic growth was much stronger during, for example, the wild, wild west … Read more
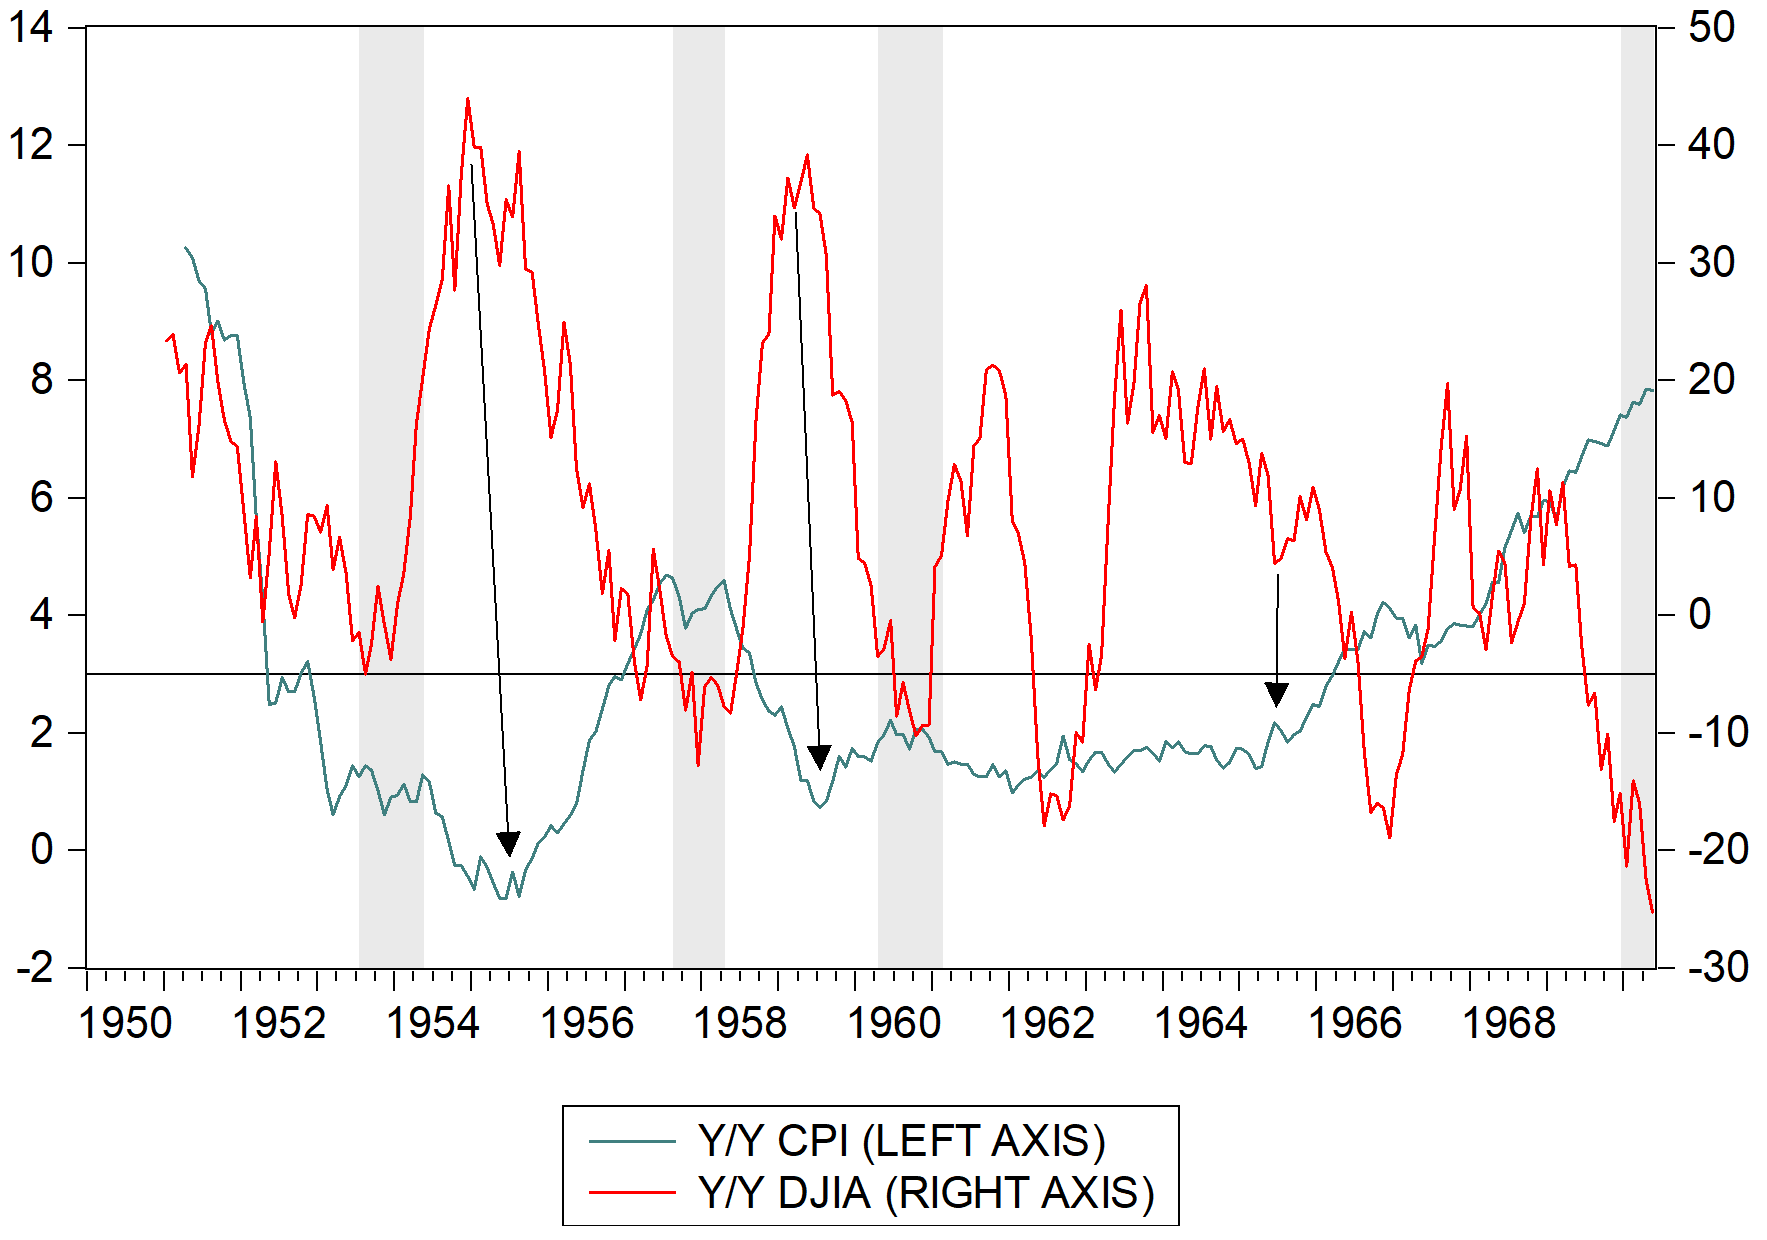
The longer inflation remains subdued, the longer this expansion lasts. The question here is simple – Are equities over- or … Read more
This article was written on July 4th 2018 and has not been edited since then? How do you think the … Read more

The NBA finals are upon us, a repeat of the 2017 finals in which the Warriors dominated the overwhelmed Cavaliers. … Read more
This week we gained two pieces of inflation information – the Consumer Price Index (CPI) and the Producer Price Index … Read more
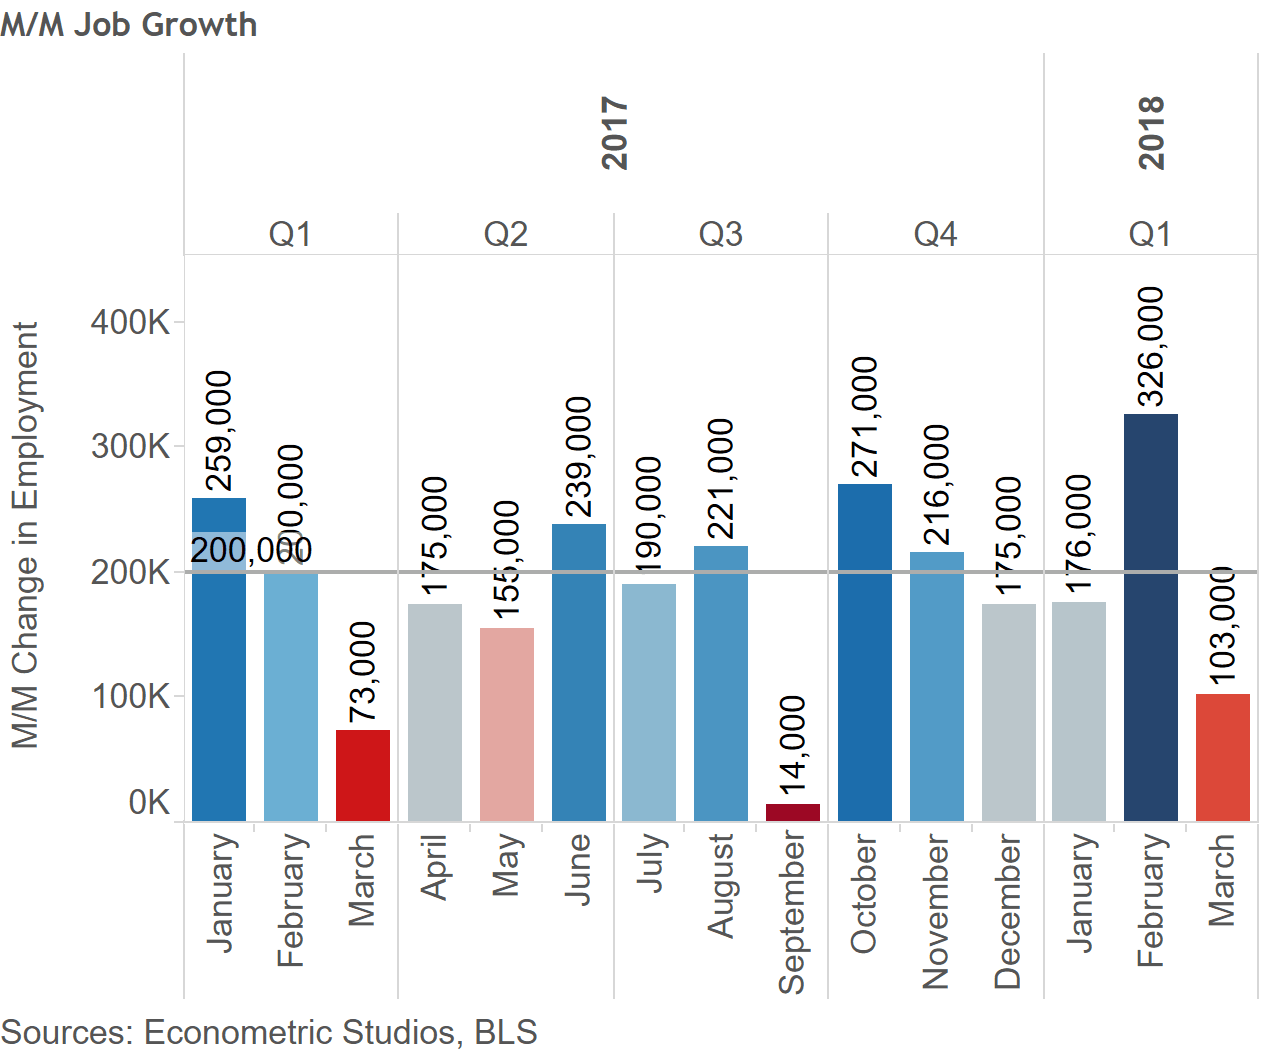
It’s jobs week. And this week’s jobs figure and unemployment rate stat could move the markets more than most. The … Read more
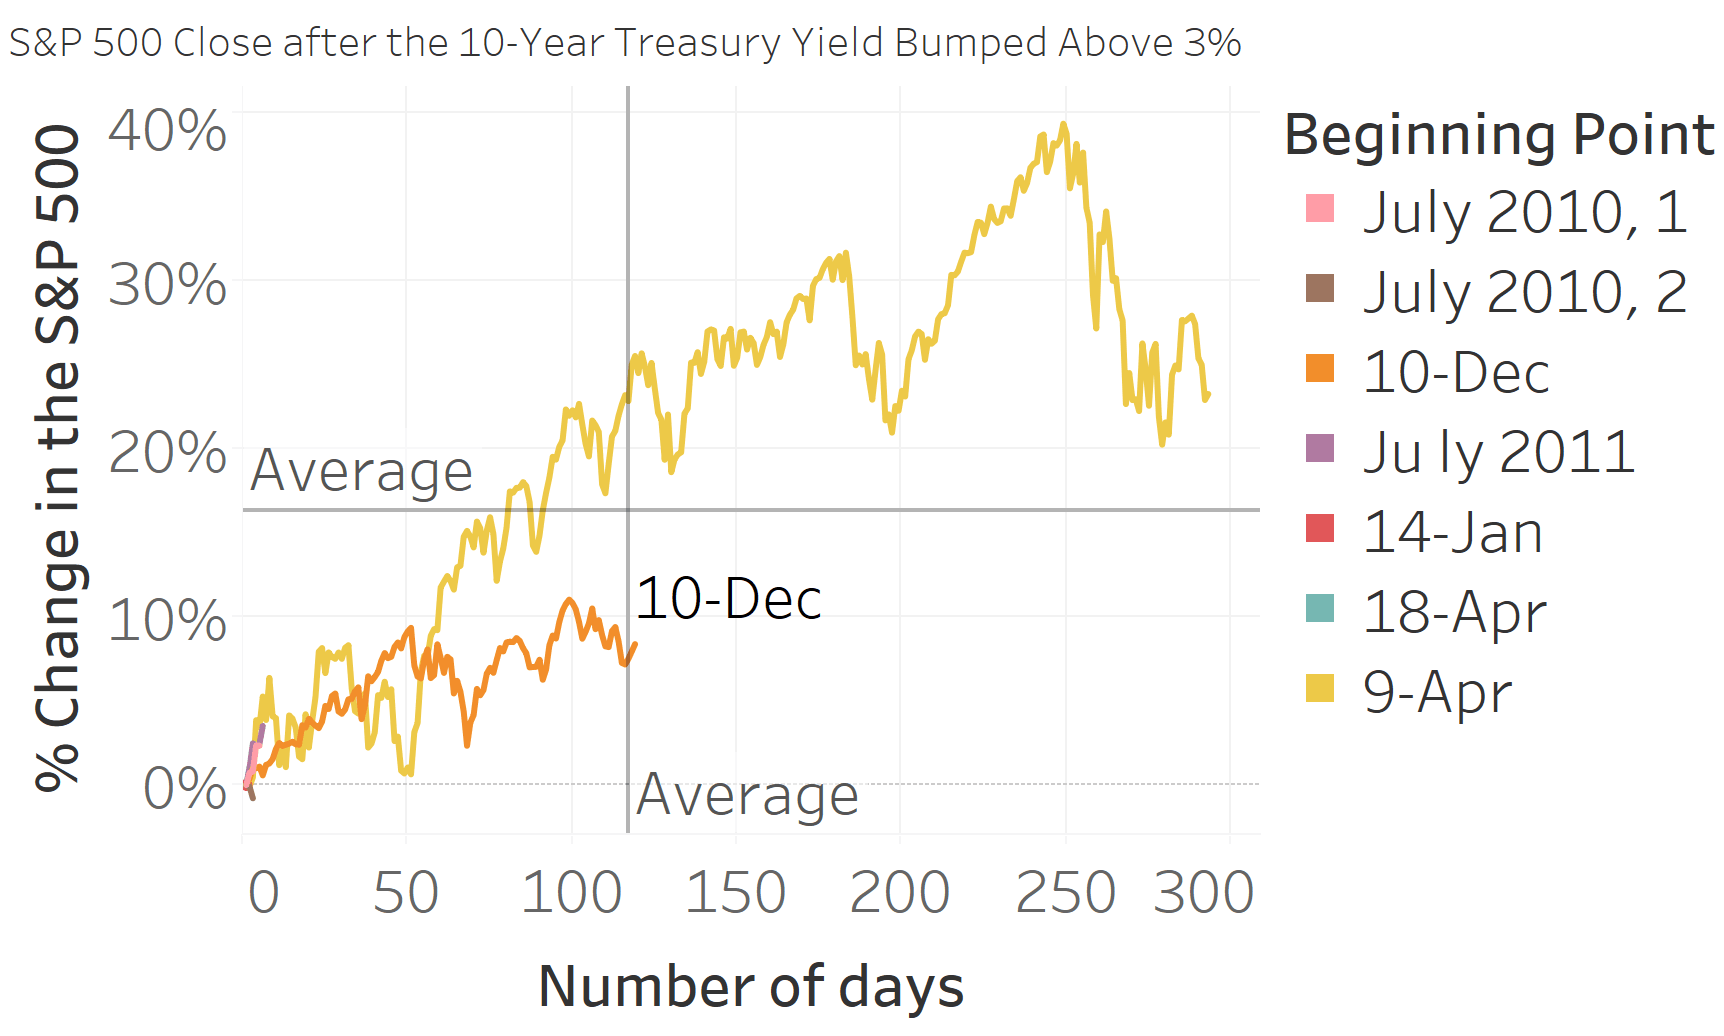
Unbeknownst to no one, the yield curve bumped above 3 percent this past week. The “psychologically” important threshold hasn’t spooked … Read more

If you’re a follower of geopolitics, you know that Americans get blamed for the 2008 global financial crisis. In postulating … Read more
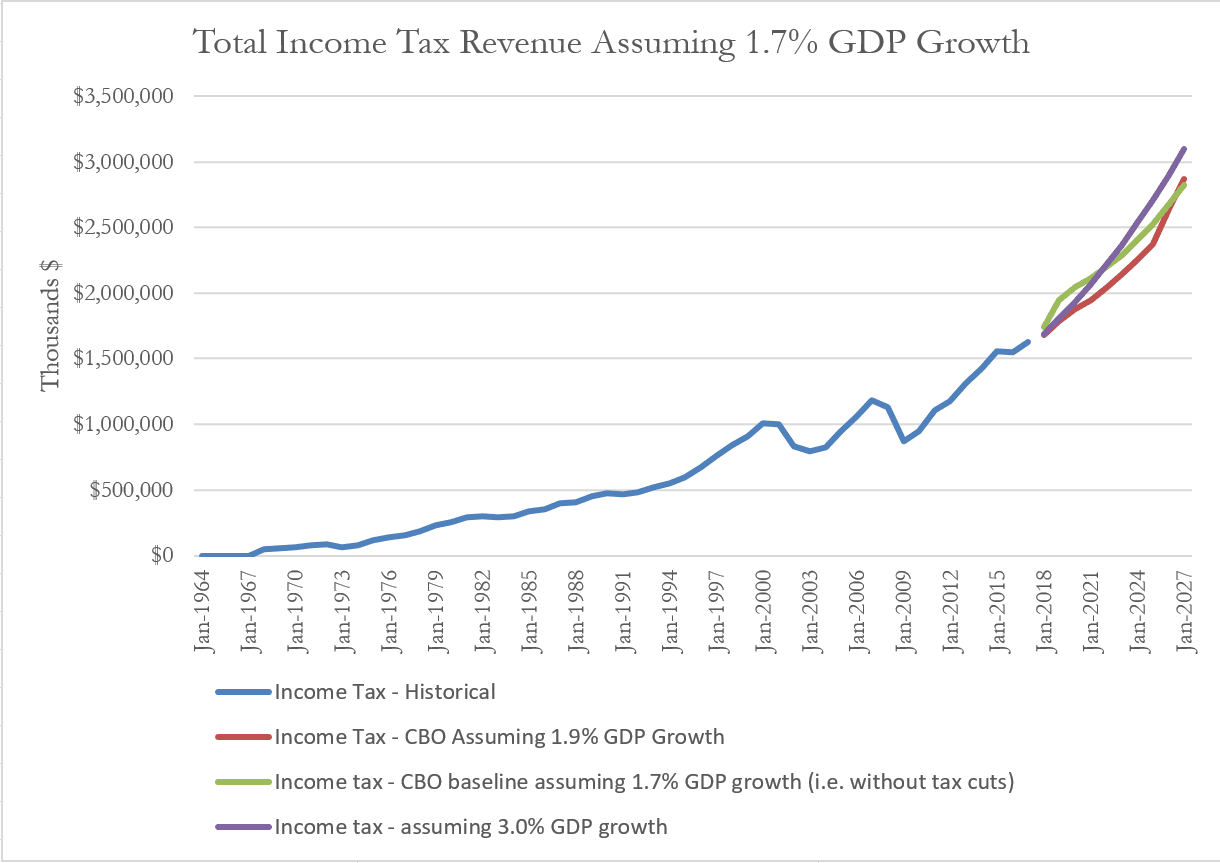
This past week the Congressional Budget Office (CBO) released their budget projections for FY 2018 through FY 2028. The budget … Read more
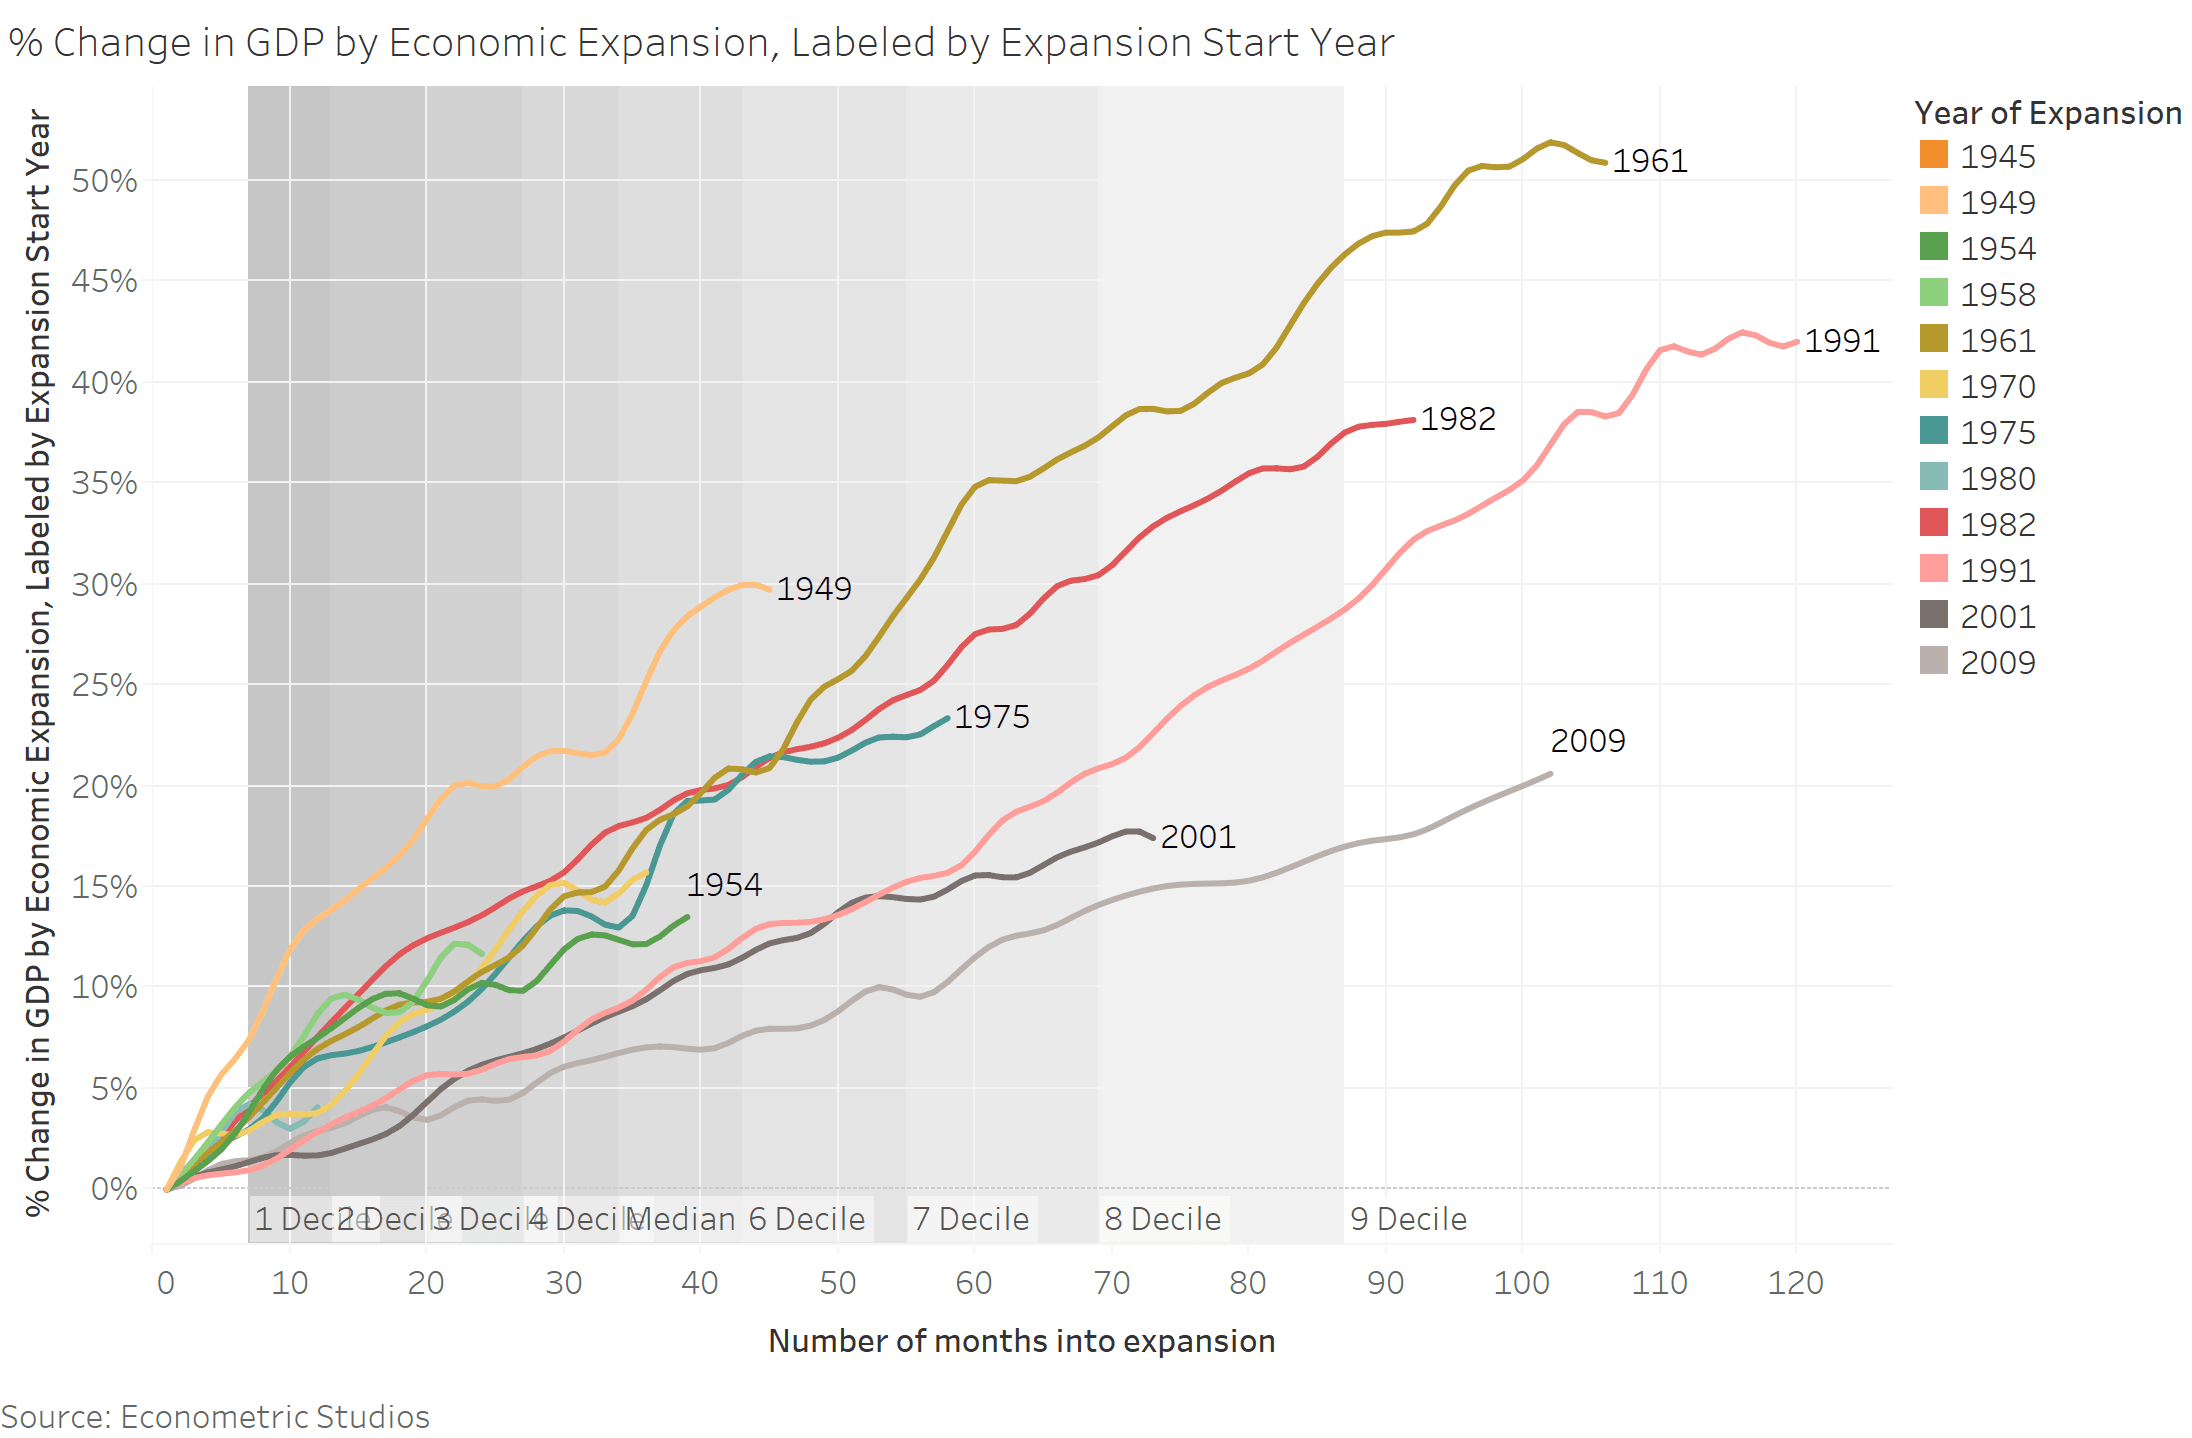
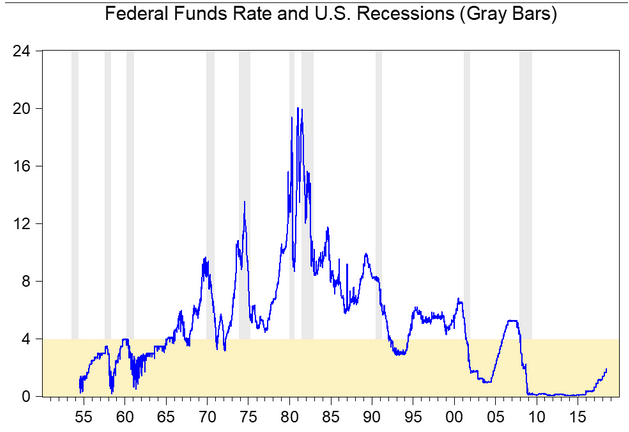
If you’re in any way interested in the business cycle, you know that markets have received an inordinate amount of … Read more
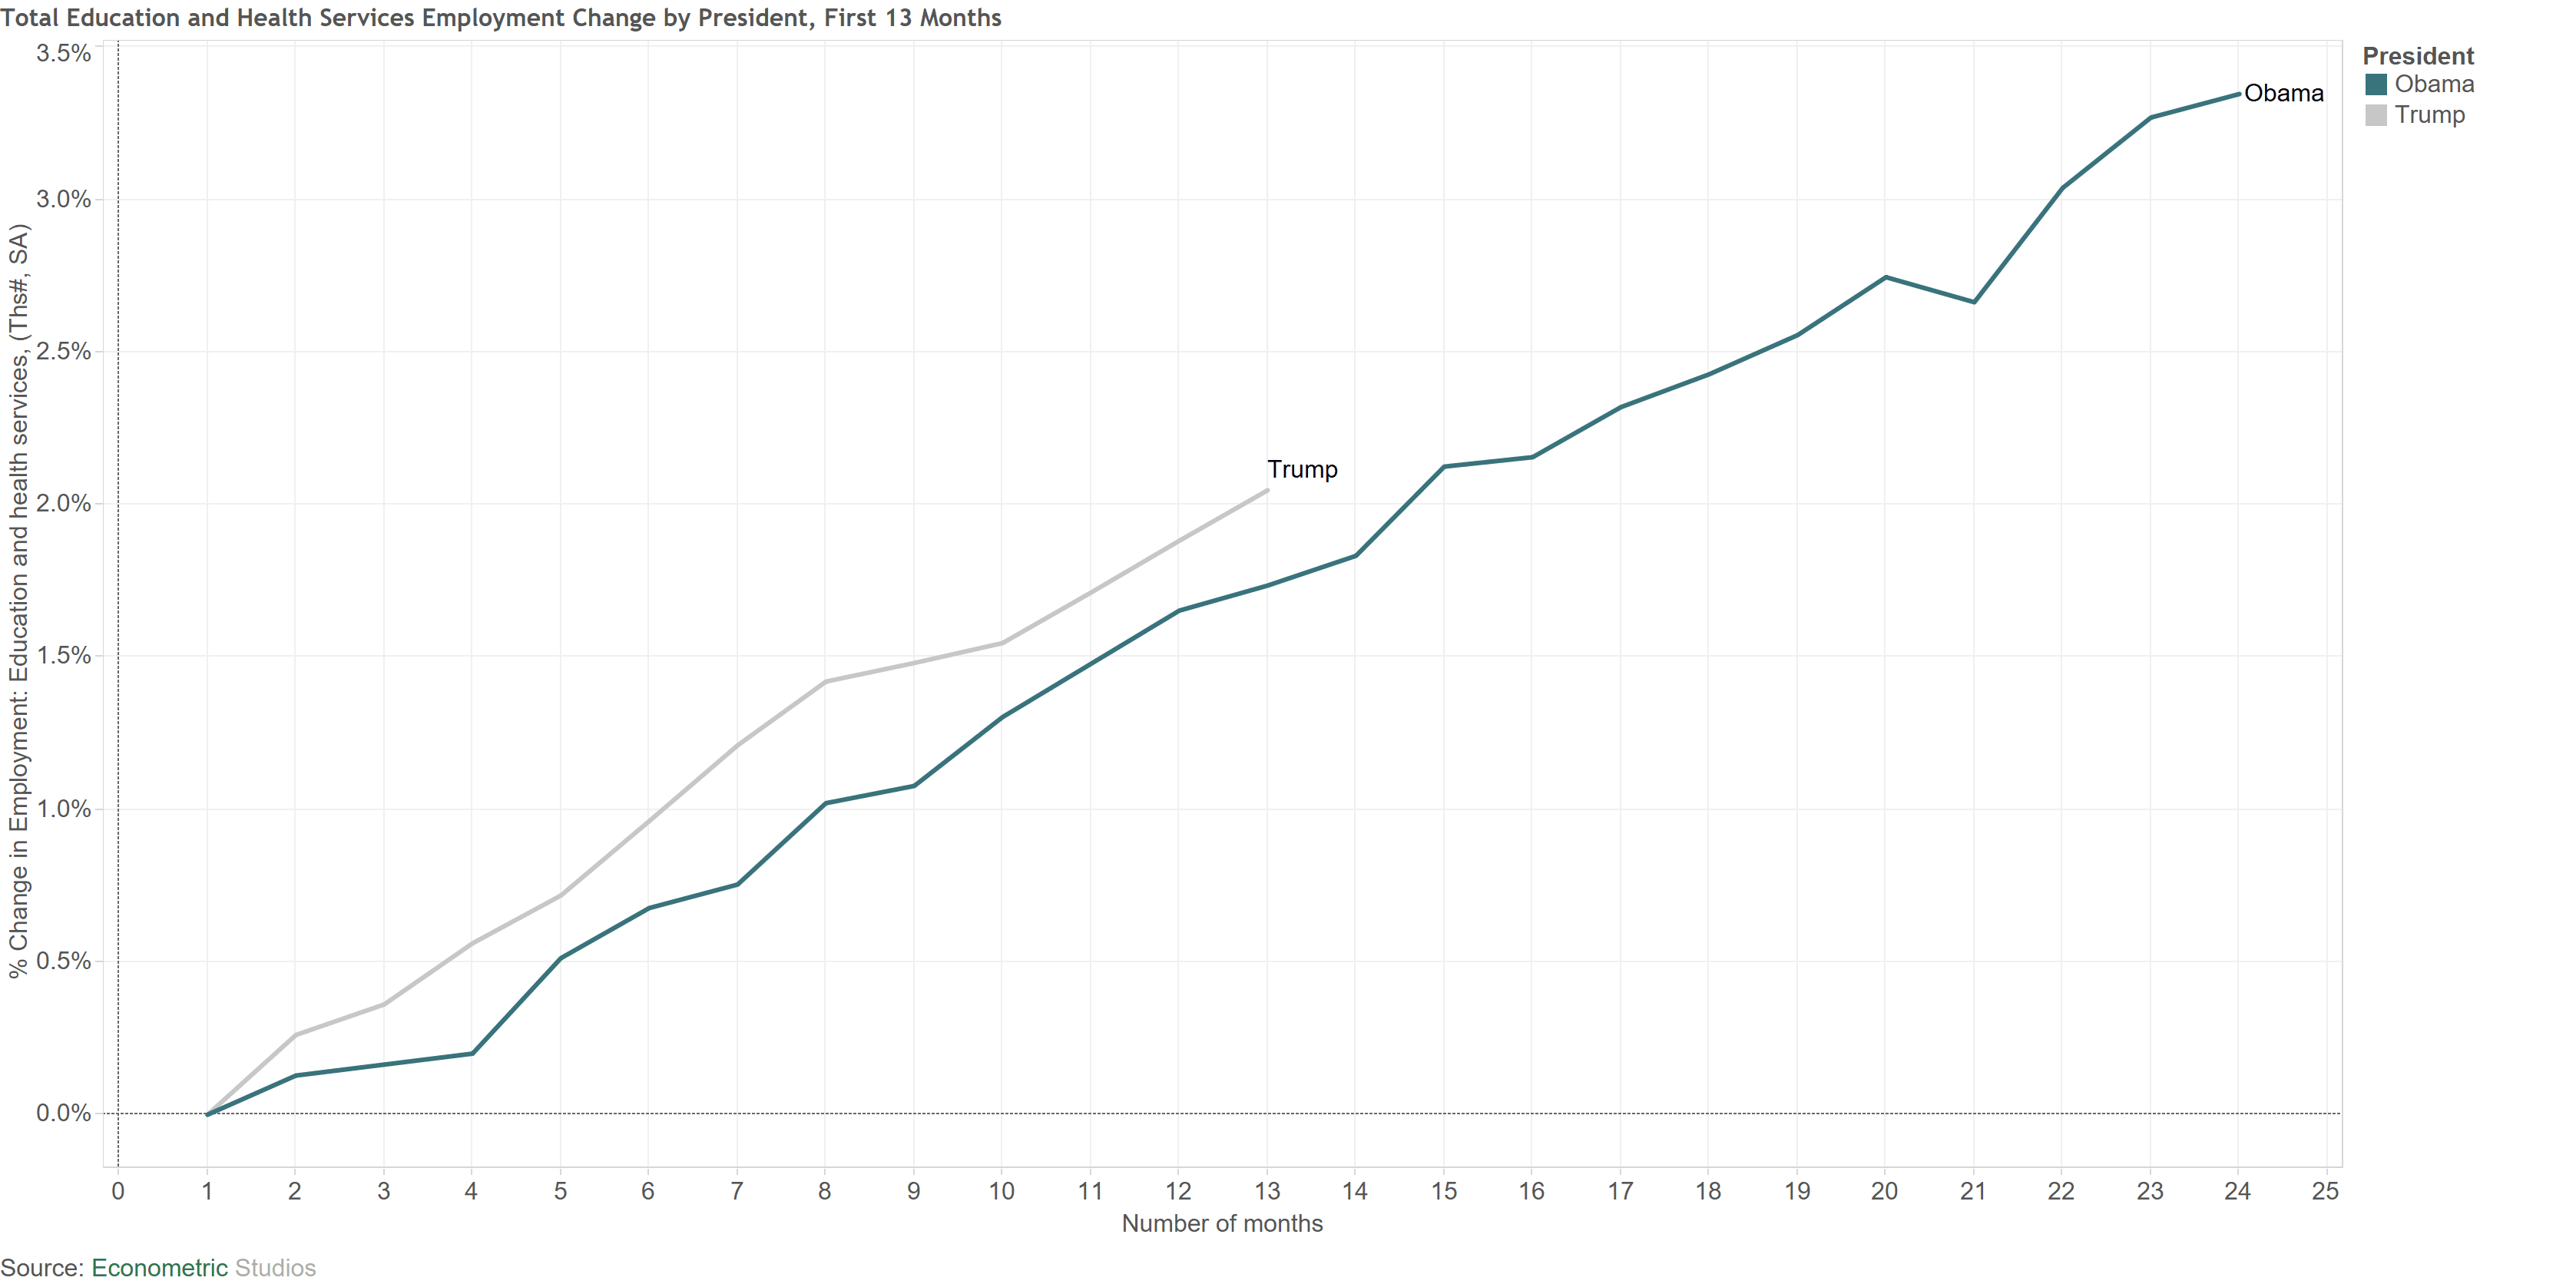
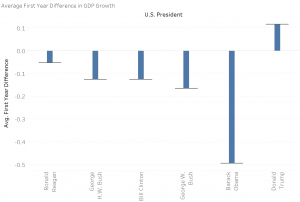
We’re now a little over one year into Trump’s presidency, giving us some initial indication of how well things are … Read more

The Housing Starts and Building Permits figures came in relatively decent. Building Permits exhibited the largest jump, going from -2% … Read more