“Worldwide M&A plummeted last week, two weeks after effects were seen on global equity issuance, as the world comes to terms with the seriousness of the coronavirus pandemic and its impact on both the human health and the global economy,” comments, Matt Toole, Director of Deals Intelligence, Refinitiv. The attached report explores Q1 2020 M&A trends and analyzes the impact coronavirus has had.

Q4 2019 hedge fund letters, conferences and more
Quarterly Highlights
Worldwide Deal Making Falls 28% as Monthly M&A Totals Plummet; Slowest Opening Period since 2016
Worldwide M&A activity totals US$697.6 billion during year-to-date 2020, down 28% compared to the same period last year. The year-to-date tally marks the lowest YTD period for deal making since 2016 (US$664.0 billion). By number of deals, worldwide deal making has fallen 14% so far this year, a six-year low. Global M&A for deals greater than US$10.0 billion decreased 57% compared to the same period last year, falling below US$400 billion in deals for the first time since year-to-date 2017. Through the 28thof March, first quarter 2020 M&A is down 32% compared to the same point during the fourth of last year.
U.S. M&A Decreases 51% to Six-Year Low; Europe Deal Making Doubles; Asia Pacific M&A Down 17%
M&A in United States has hit US$252.9 billion so far this year, a decrease of 51% compared to the same period last year and is at a six-year low. Bolstered by five of the largest worldwide deals announced during the quarter, European M&A activity hit US$232.2 billion so far this year, more than double levels seena year ago and the strongest opening period for European deal-making since 2018 (US$357.2 billion). Asia Pacific M&A activity totals US$142.8 billion, down 17% from year-to-date 2019 and the slowest year-to-date period for M&A in the region in six years. Deal making in Japan totals US$23.3 billion, an increase of 66% compared to a year ago levels and a two-year high.
Financials, Industrials, Technology, and Real Estate Lead 2020 Deals
Deal making targeting the financials sector hit US$172.9 billion so far in 2020, down 10% compared to year-to-date 2019. M&A in the industrials sector totaled a record US$148.2 billion so far during 2020, more than double levels seen last year at this time. Deal making in the technology sector accounts for 11% of global M&A so far this year with US$76.9 billion of deals announced, down 2% compared to 2019 levels. Real Estate deal making accounts for 11% of year-to-date activity and is down 9% compared to a year ago.
Private Equity-backed Buyouts Up 5%, Accounting for 16% of WW M&A, Highest Percentage since 2013
Global private equity-backed M&A activity totaled US$107.0 billion during year-to-date 2019, a 5% increase compared to last year and the strongest year-to-date period for global buyouts since 2018. Private equity deals account for 16% of overall M&A, up from 12% during year-to-date 2019 levels and a seven-year high. Private equity-backed M&A targeting the United States reached US$38.5 billion so far during 2020, a decrease of 15% compared to 2019 levels. European PE-backed M&A has doubled compared to 2019 levels, while Asia Pacific buyouts have declined 55%, compared to a year ago.
Cross-Border Deal Making Down 17%; Emerging Markets M&A Down 34%
Cross-border M&A totaled US$204.2 billion during year-to-date 2020, a 17% decrease compared to last year and the slowest period for cross-border deals since YTD 2013 (US$129.2 billion). Cross-border activity accounts for 29% of total M&A activity this year, up from 26% a year ago. The United States initiated 38% of all acquisitions abroad so far in 2020 with US$76.7 billion in deals, while China outbound acquisitions account for 1% of cross-border activity. M&A involving emerging markets totaled US$191.5 billion so far during year-to-date 2020, a 34% decrease compared to a year ago.
Goldman Sachs Maintains Top Spot for WW, US, Europe M&A; JP Morgan Leads Asia Pacific; Nomura Leads Japan
Goldman Sachs maintained the top position for worldwide announced M&A advisory work during year-to-date 2020 boosted by the top ranking in the United States and Europe while JP Morgan took the top spot in Asia Pacific and Nomura took first place in Japan. Led by Evercore Partners, Lazard and Rothschild, eleven independent advisory firms placed among the top 25 global financial advisors during year-to-date 2020.
Worldwide M&A Volumes
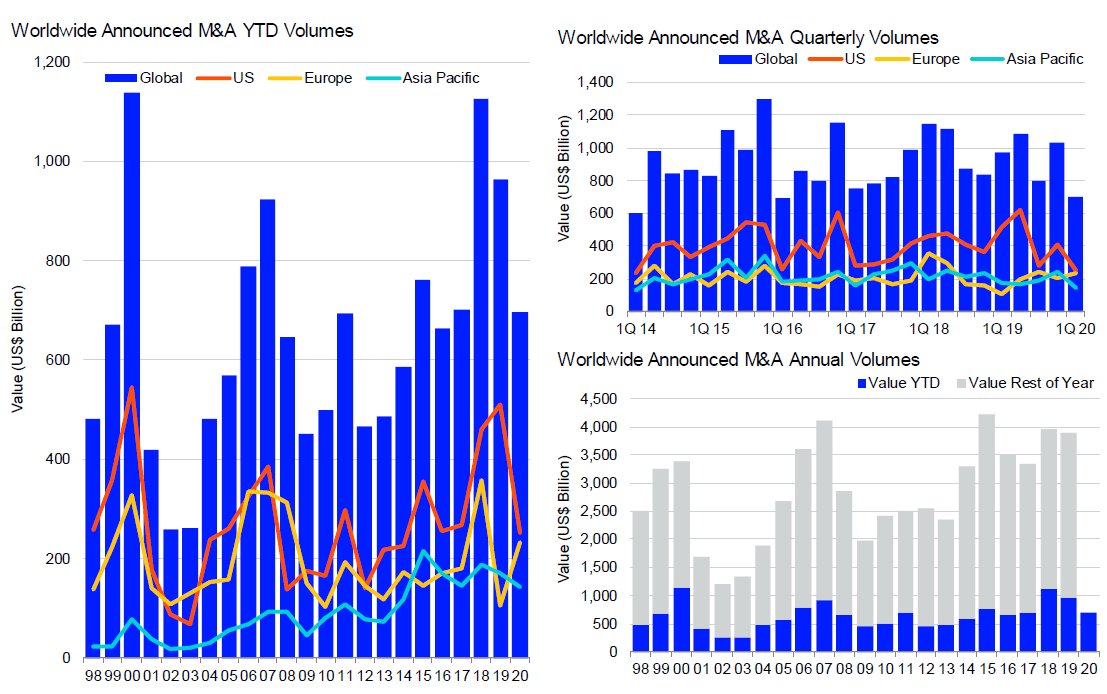
Worldwide M&A Declines 28%
Worldwide M&A activity totals US$697.6 billion during year-to-date 2020, down 28% compared to the same period last year. The year-to-date tally marks the lowest YTD period for deal making since 2016 (US$664.0 billion). By number of deals, worldwide deal making has fallen 14% so far this year, a six-year low. Global M&A for deals greater than US$10.0 billion decreased 57% compared to the same period last year, falling below US$400 billion in deals for the first time since year-to-date 2017. Through the 28thof March, first quarter 2020 M&A is down 32% compared to the same point during the fourth of last year.
U.S. M&A Down 51% to Six-Year Low
United States year-to-date M&A activity hit US$252.9 billion, down 51% compared to last year and is the country’s slowest opening period for deal making since year-to-date 2014 (US$226.5 billion). In terms of quantity of deals, YTD 2020 has produced 2,528 deals; representing an 8% decrease compared to year-to-date 2016 (2,518) and a four-year low.
Europe M&A Doubles
Bolstered by five of the largest worldwide deals announced during the quarter, M&A in Europe has reached US$232.2 billion so far this year, more than double levels seen a year ago and the strongest opening period for European deal-making since 2018 (US$357.2 billion). There have been just over 2,900 European deals announced year-to-date, a 20% decline compared to last year and the lowest YTD number of deals in 15 years. The value of European M&A during the quarter-to-date is up 14% compared to the same quarter-to-date period during the fourth quarter of 2019.
Asia Pacific Down 17%
Asia Pacific M&A activity for YTD 2020 totals US$142.8 billion, down 17% from year-to-date 2019 and the slowest period for M&A in the region in six years. Asia Pacific accounts for 21% of worldwide merger activity, up from 18% during the year ago period.
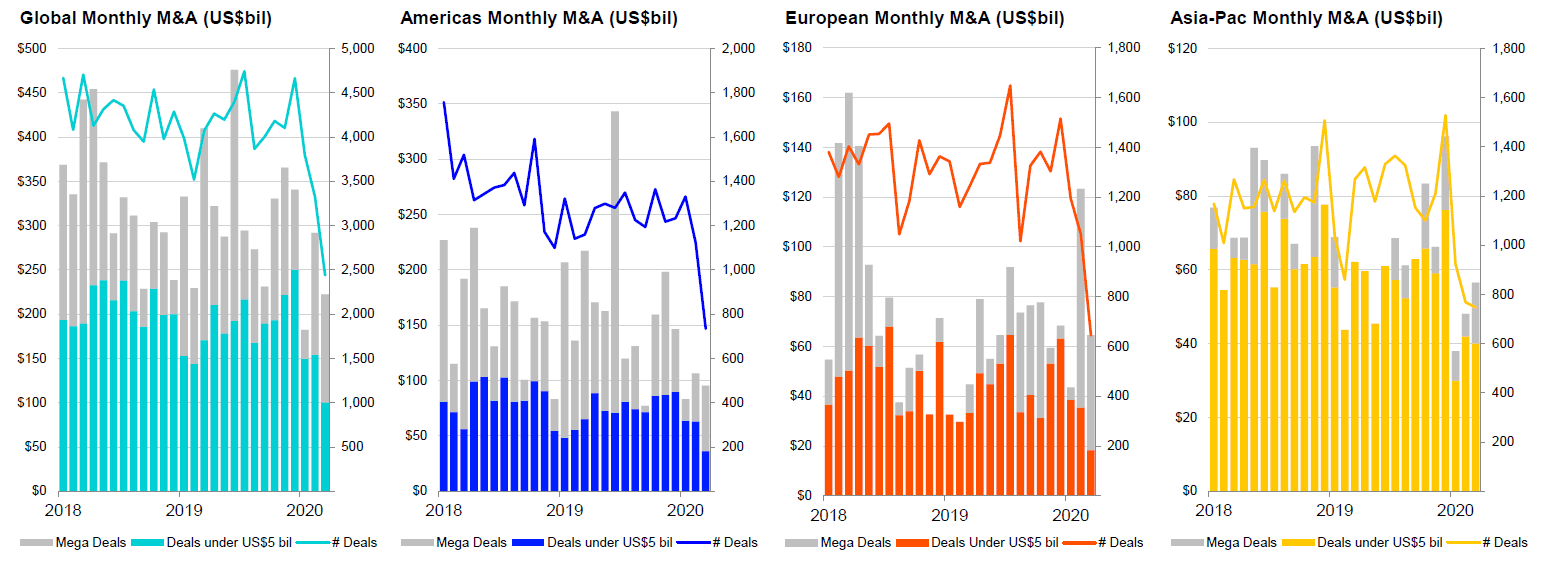
Monthly M&A Activity
Global M&A announced during March 2020 totals US$222.4 billion, down 24% from last month and down 46% from March 2019. Mega deals mask a broader decline in M&A in both the Americas and in Europe, with the combined value of deals under US$5 billion falling the lowest monthly levels since August 2009 in the Americas, and since January 2016 in Europe. The number of deals announced during March has dropped dramatically in all regions since the end of last year.

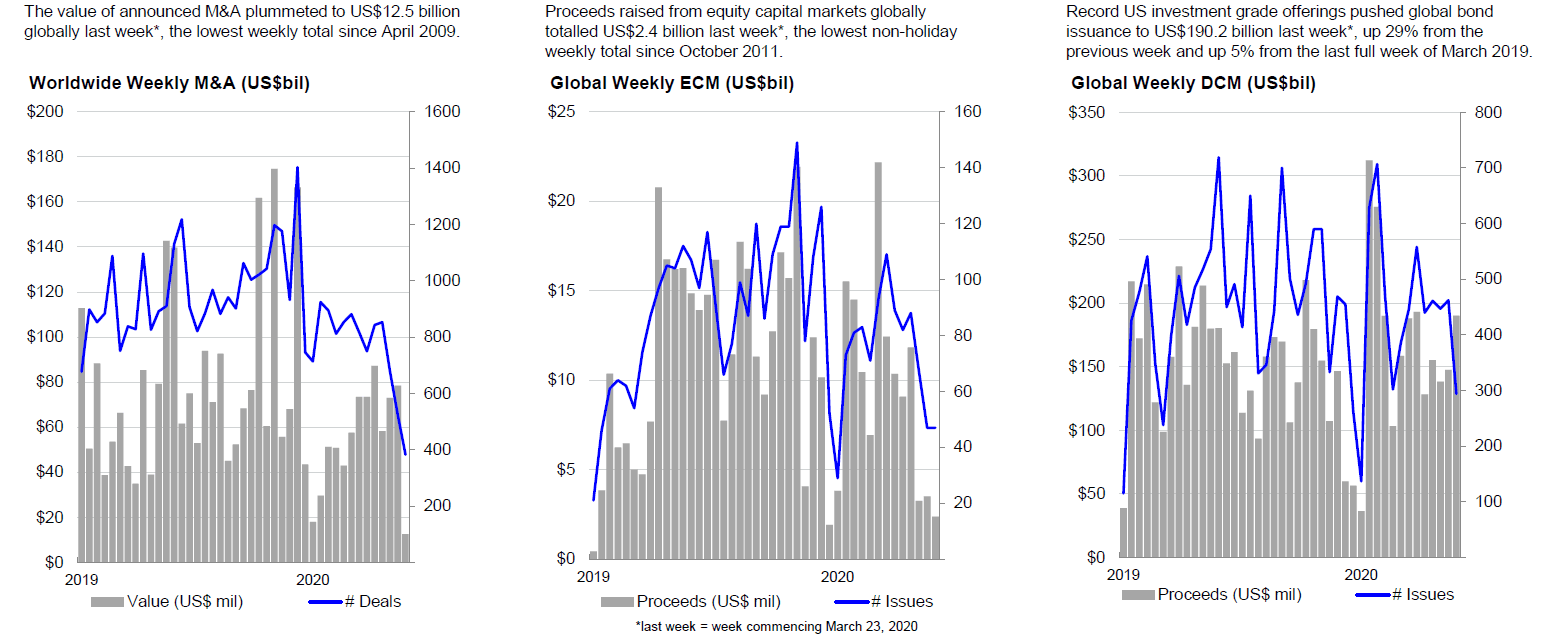
Weekly M&A and Capital Markets Activity
Global M&A plummeted last week, two weeks after effects were seen on global equity issuance, as the world comes to terms withthe seriousness of the coronavirus pandemic and its impact on both human health and the global economy. Meanwhile, record US investment-grade corporate bond sales push global bond issuance up 29% from last week, up 5% from the same week in 2019.
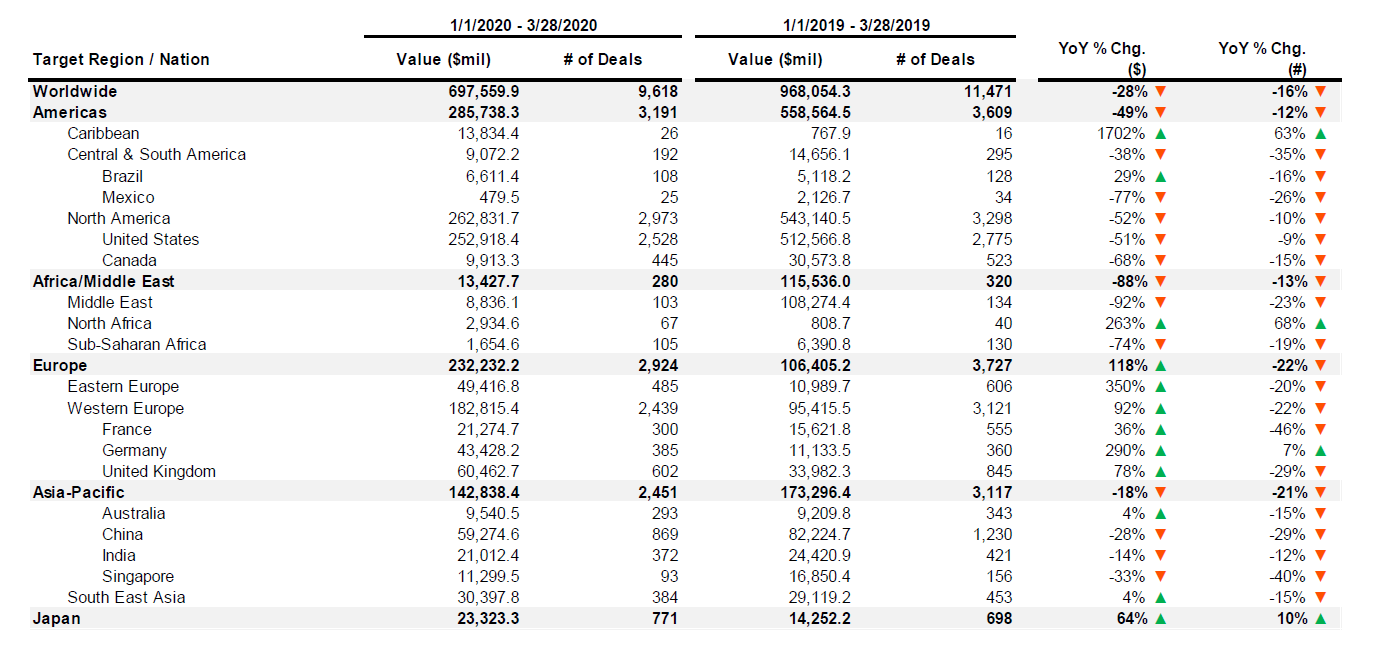
Regional M&A Scorecard
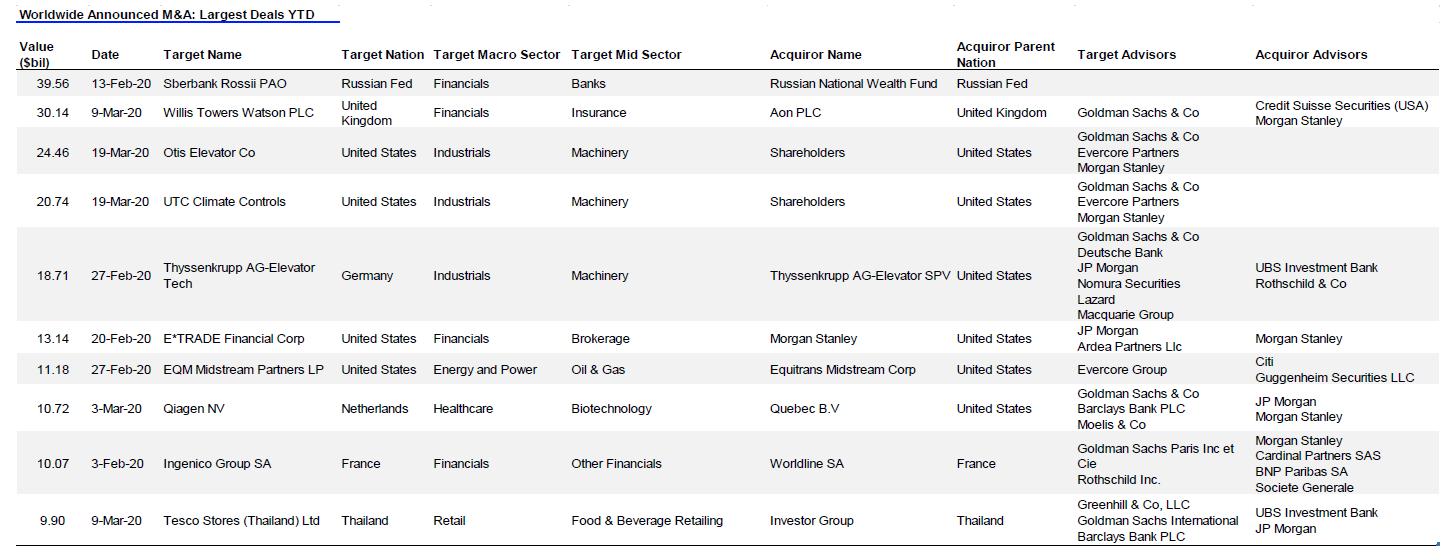
Top Deals
Read the full article here by Refinitiv


