In a previous article, I presented a rough approximation to help illuminate how the Covid-19 outbreak might affect the value of American stocks as represented by the S&P 500 Index. Here I take a deeper drive and provide a full spreadsheet model. In the model, the virus has two fundamental effects. First, it depresses earnings next year and second it prevents earnings from ever meeting pre-virus expectations. The best way to see how this works is with reference to the graph below.

Q4 2019 hedge fund letters, conferences and more

Value of the S&P 500 explained
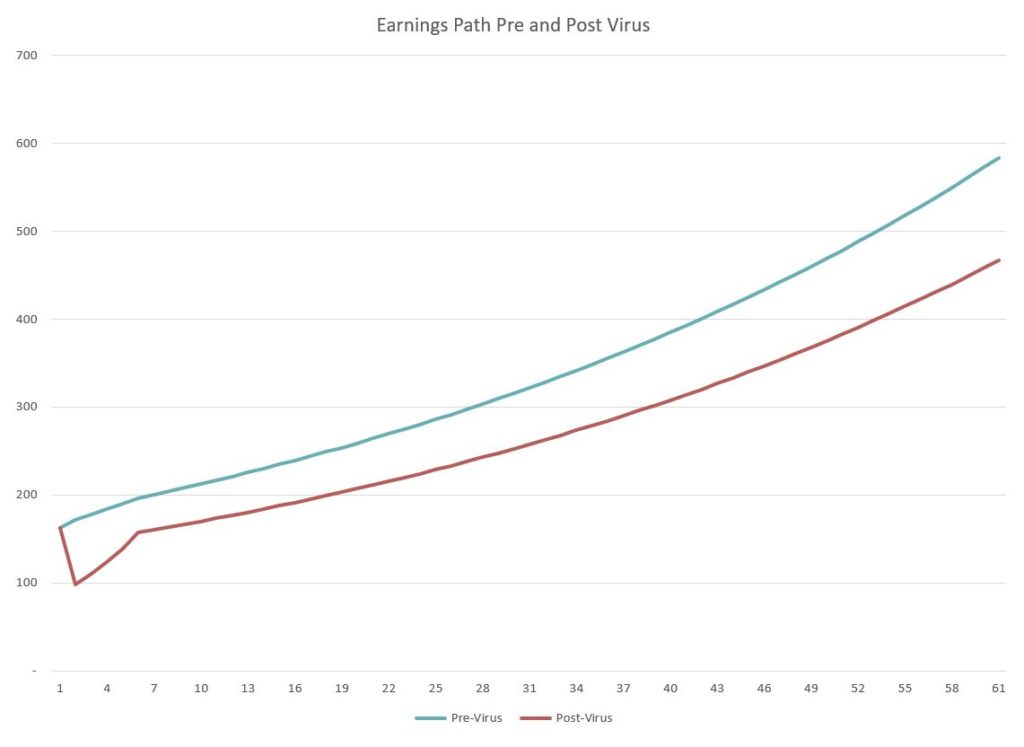
The green line shows the expected path of earnings for the S&P 500 stocks as of early February 2020 when stock prices were near their peak. The line starts at $163; the effective earnings per share of the S&P 500 during the previous twelve months. It then grows 5.52% the next year and 3.36% the following four years. These growth rates are derived from analyst forecasts available in early February 2020. Finally, from year six forward the growth rate falls to a level of 2.00% which is maintained into perpetuity. I note that this is a relatively low long-run growth rate, approximately equal to the long-run expected rate of inflation.
The red line differs from the green line in two respects, both of which the reader can vary using a slider in the spreadsheet (download below). The first difference is that rather than rising in the first year, earnings are expected to fall. In the graph, the assumed drop is 40%, equal to the decline in annual earnings observed at the height of the great 2008 recession. The second variable is the fraction of year five pre-virus earnings are that earned in year five in the post-virus world.
In the graph, this is assumed to be 80% of the pre-virus year five earnings. In year six and beyond, earnings are assumed to grow at 2.00% just as they do in the pre-virus case. However, because of the 20% earnings gap in year five, the assumption of the same long-run growth rate means that the differential between the pre-virus and post-virus lines widens in dollar terms going forward.
What will stocks do next
To convert the graph into an estimate of the intrinsic value of the S&P 500 index using discounted cash flow analysis requires two added inputs. The first is the fraction of earnings that are paid out to shareholders as dividends or buybacks. The second is a discount rate for calculating present value. With regard to the fraction of earnings paid out, I use estimates posted by Professor Aswath Damodaran on his website.
I use the same payout fractions for both pre- and post-virus calculations. One might argue that the payout rates will be depressed, even as a fraction of the lower earnings, post-virus. The reader is free to make that alteration in the spreadsheet. Finally, I use a discount rate of 6.70% in both the pre- and post-virus case. The low discount rate reflects the current low level of interest rates. Once again, the reader should feel free to replace my estimate with his or her choice in the spreadsheet.
Given the pre-virus earnings path shown by the green line, the cash payout rates, and the discount rate described above, the intrinsic value of the S&P 500 comes to 3,220.54. This is only slightly less than the average level of the actual index in the month before the virus collapse began which is approximately 3,300. This suggests that overall, the model inputs are consistent with what the market was thinking at the time.
Value of the S&P 500 assumptions
Using my assumptions that earnings would drop 40% in the first year and only recover to 80% of their expected pre-virus level by year five, the intrinsic value of the S&P 500 index drops to 2,491.69. In comparison, the index closed at 2,541.47 on Friday, March 27. Once again, the numbers are reasonably close to market values. If one used more optimistic assumptions, for example, a 15% drop in earnings growth the first year and recovering by 95% in year five, then the intrinsic value jumps up to 3,007.67, for a decline of only 6.6%.
The analysis using my assumptions implies that virus has caused the intrinsic value of the stocks in the S&P 500 index to fall by 22.6%. Applying this percentage to the approximate value of all stocks listed in the United States translates into a dollar loss of about $9.5 trillion dollars. In a famous TED presentation that Bill Gates made in 2015, he suggested that the world was unprepared for a pandemic and, therefore, global costs could be $3 trillion. Apparently, he significantly underestimated the cost. However, that conclusion is sensitive to the assumptions used in the discounted cash flow model. I urge the reader to download the spreadsheet and play with the inputs so as to reach his or her own conclusion as to the intrinsic value of the S&P 500 index.
Click here to download interactive excel spreadsheet.


