
GDS Investment’s Glenn Surowiec shares his thoughts and data on the coronavirus contagion and fatality numbers, and previous corrections.

Q4 2019 hedge fund letters, conferences and more
The most rational way to address and position around recent market turmoil is to lean on data (not emotion) to guide future decision-making. On that note, here is some perspective that should help you navigate today’s volatility...
First, here are some brief thoughts on the Coronavirus and why the market may have already discounted the likely impact:
- 12 countries account for 97% of all of the coronavirus cases, all of these countries are in the Northern Hemisphere.
- Warmer weather kills almost all respiratory viruses and the 12 major countries currently impacted will see rising temperatures over the next few months. I’m encourage that there are almost no reported cases in Africa, South America and Australia.
- The number of coronaviruses peaked in China over a month ago, which could serve as a model for how the spread curve might look in those regions impacted today.
- How does the coronavirus compare to previous public health outbreaks? The NY Times recently published a chart that compares its rate of contagion and fatality rate with other outbreaks. Bottom line is that the coronavirus is slightly more contagious than Ebola, SARS, bird flu, and MERS BUT with much lower fatality rates. Obviously, the coronavirus contagion and fatality numbers may be overstated b/c of how poorly the Chinese government handled the initial outbreak. Normalized numbers are probably much lower.
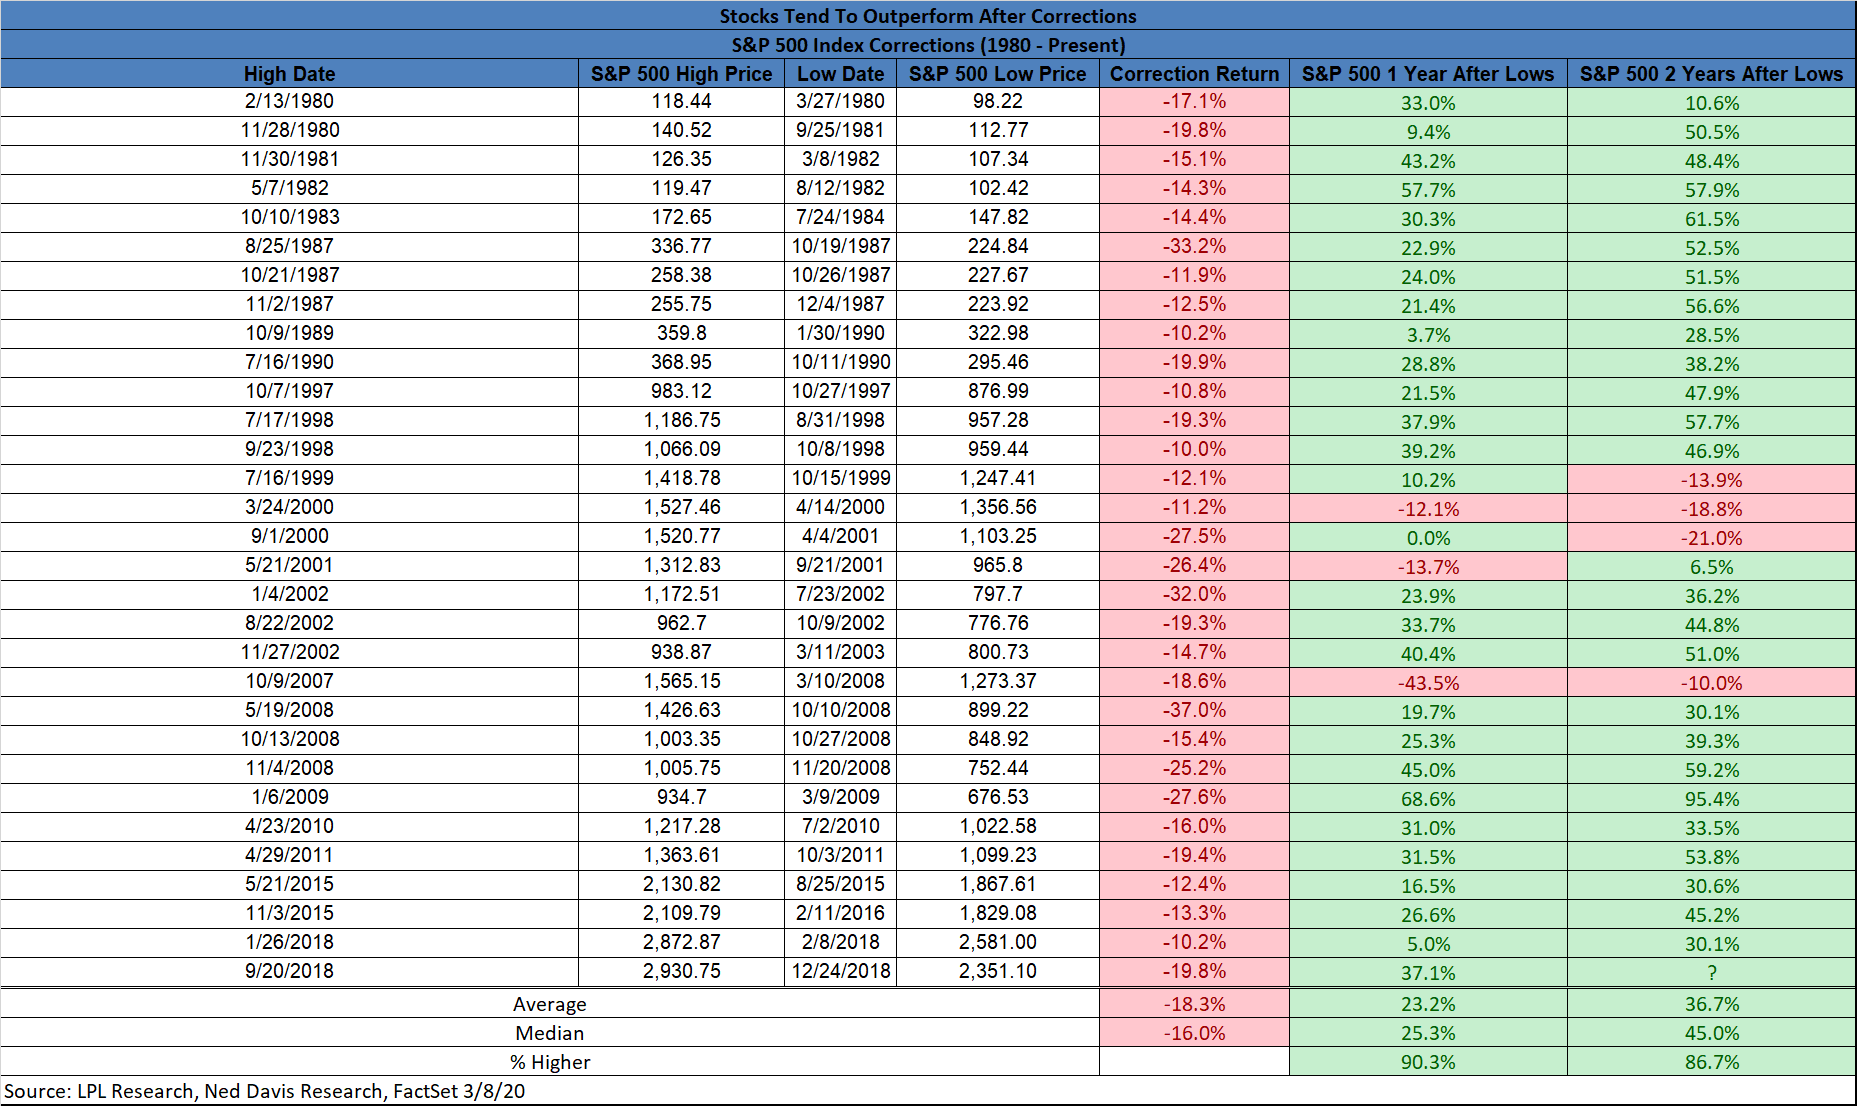
The Previous Market Corrections
Secondly, the chart below comes from one of my favorite market research firms, Ned Davis Research. All 31 corrections since 1980 are listed below, with performance data during the correction as well as one and two years after the correction. Bottom line is that the median market performance two years after a correction is 45%. The severity of the current downturn is steeper than average so it wouldn’t surprise me if the next two years turned out to return materially higher than the historical average. With that said, as the world increasingly becomes stock “renters” please have a long-term perspective, be patient and develop a stock “owner” mentality. This will dramatically increase your likelihood of success.
Best Regards,
Glenn Surowiec


