Uber Technologies valuation look
- Uber Technologies Inc (NYSE:UBER)’s 4Q19 results highlight an accelerated path to EBITDA profitability.
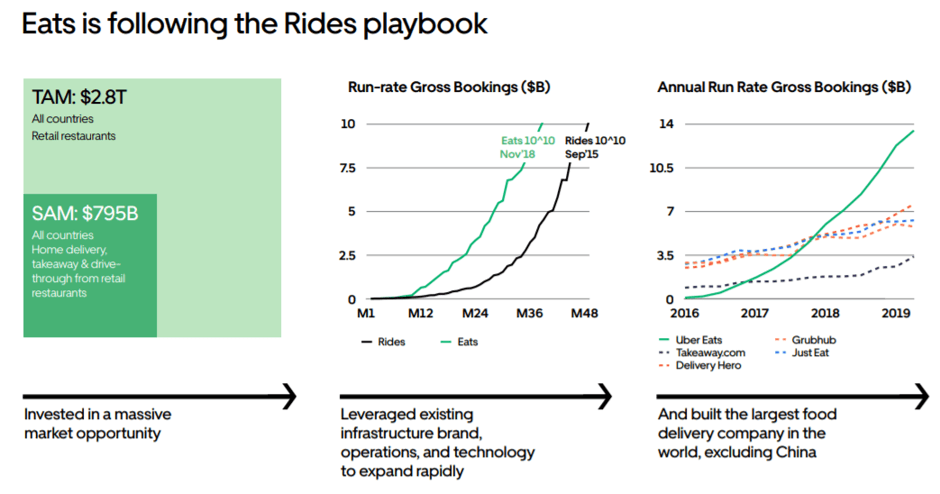
- Eats is also showing encouraging progress amid a competitive food delivery landscape.
- The market is giving Uber little to no credit for its ability to hit post-FY21 profitability targets.
- Uber’s ride-sharing business appears significantly undervalued on a sum-of-parts basis.

Q4 2019 hedge fund letters, conferences and more
While consensus continues to focus on Uber Technologies as a premier ride-sharing company, I’d argue that Uber has evolved into a mix of high-quality businesses that remain in investment mode, as well as poor quality businesses that should be divested. The recent Eats India exit confirms the relative ease Uber has in exiting businesses with sub-par unit economics; the fact that management has shown a willingness to divest should further accelerate the path to profitability.
I believe Uber stock now offers a highly favorable long-term risk/reward, with significant optionality should the ancillary businesses within its portfolio prove to be successful. This adds significantly to the core business’ growth runway – at current growth rates, Uber should have difficulty growing multifold over the coming years. At current levels, I believe the market is attributing little to no value to Uber's non-Core businesses, while significantly underestimating the ridesharing business’ potential to achieve its longer-term EBITDA profitability targets.
Uber Steps on the Gas, Now Targeting EBITDA Profitability by 4Q20
Building on the strong progress this year and with multiple efficiency initiatives in the pipeline for 2020, Uber Technologies has accelerated its EBITDA profitability target from full-year 2021 to 4Q20. While the 1Q EBITDA losses are anticipated to continue at ~$615M, as Eats remains in investment mode, strong incremental margins of 80% at Rides adds to management’s confidence that it can drive ~55% flow-through in 2020 while still leaving room to invest.

Source: 4Q19 Supplemental Materials
Meanwhile, the Eats story seems to have taken a positive turn – with signs of rationalization emerging in the food delivery space, management now sees Eats about a year behind Rides on the path to EBITDA profitability. This bodes well for Eats heading into FY20 as end-FY19/early-FY20 represents the peak investment period, after which it should reap the benefits of greater leverage through 2020. Per management, the overall long-term EBITDA margin target stands at 25% based on Rides margin of 45% and a 25% take rate, along with an Eats margin of 30% and a 15% take rate.


Source: Investor Presentation
UBER also guided FY20 gross bookings to $75-80bn, with Rides expected to grow >20%. While the guide was admittedly on the weak side, It is important to stress the many moving pieces behind the Rides bookings growth – for instance, a renewed focus on high-value, cash-generative rides, pooling changes that have been a headwind in 2019. The slightly lower guide will likely be key to near-term investor sentiment, and the multiple investors will pay for UBER.
Uber Technologies: Encouraging Progress at Eats
Q4 Eats gross bookings of $4.37B (up 73% YoY; ex-FX 20% QoQ), and Adjusted Net Revenue ((ANR)) of $415M (up 154% YoY ex-FX) was a significant positive in the face of continued heavy competition.

Source: 4Q19 Supplemental Materials
Ex-India, gross bookings increased 75% ex FX to $4.28B, and ANR increased 104% to $434M; excluding India, Eats take rates increased +60bps YoY. In addition, the company has made significant traction, adding restaurant supply, with 400k active restaurants in the US (+78% YoY). The q/q ~100bps take rate decline (10.1% in 4Q19) is primarily due to seasonality when the company has to pay higher incentives to couriers as the weather becomes much colder.

Source: 4Q19 Supplemental Materials
With the adjusted EBITDA for the Eats business improving to -$418M ex-India (-$461M with India), management highlighted the divestiture of the Eats business in India and the previously disclosed exit from Eats in South Korea as examples of its strategic discipline. Uber noted that it is now in first or second position in well over half of the countries, reflecting the significant majority of the gross bookings including the US, UK, France, Mexico, and Japan. From the transcript:
“In Eats, we steadily delivered on our strategy to be #1 or #2 in every market by leaning into our investment in some countries and exiting others. We grew gross bookings by over 70% and are now in first or second position in well over half of our countries reflecting the significant majority of our gross bookings, including the U.S., the U.K., France, Mexico, and Japan.”
Gross bookings for the US Eats business increased 44% YoY to $1.7B (ahead of GRUB at $1.55B in 4Q), with the company claiming to have maintained its strong number-two position in the market. At the same time, Uber emphasized it had increased the US Eats take rate 500bps YoY to the mid-teens, despite a competitive environment. Looking ahead to FY20, management is setting Eats on course to follow in the footsteps of the Rides business by re-aligning its focus from user acquisition towards profitable growth and market leadership, as it exits peak investment quarters in 4Q19 and 1Q20.

Source: 4Q19 Supplemental Materials
Potential Risks to Monitor
Key risks to monitor include the potential for an intensified competition environment as Uber Technologies confirmed Lyft had taken a more aggressive competitive posture around pricing/discounts of late. While this may be a test and/or may not impact Uber's market share, it bears watching, in my view.
“Yes. I'd say, as far as the competitive environment in the U.S., from a long-term standpoint, the competitive environment has been constructive, has rationalized. In the past month or so, we've seen Lyft, our competitor, probably be on balance more aggressive in terms of discounting and incentives. We'll see where that leads.”
Meanwhile, continued losses from the Other Bets segment will be worth monitoring as well – 4Q19 saw the segment posting ANR of $35M and Adj EBITDA loss of -$67M. While 4Q represents a seasonal drop for bikes and scooter businesses due to weather, the company remains focused on building a sustainable and scalable business that will inevitably take time.

Source: 4Q19 Press Release; Emphasis by Author
Sum-of-Parts Uber Technologies Valuation Highlights the Upside Potential
Uber’s shift in focus toward EBITDA profitability should drive a greater focus on EBITDA-based valuations. For instance, I believe the Rides business alone could drive ~$8-9bn in FY22 EBITDA if Uber Technologies can hit the targets disclosed in its latest presentation. Assuming ANR hits the 25% targeted take-rate by FY22 (implying an additional ~3-4%pts from current levels) on continued 20% growth in gross bookings, there is a clear path toward EBITDA inflection from here.
| FY20 | FY21 | FY22 | |
| Rides Gross Bookings | 59,433 | 70,575 | 84,691 |
| Growth (%) | 20% | 20% | 20% |
| Rides ANR | 13,483 | 16,744 | 21,173 |
| ANR Margin (%) | 22.9% | 23.7% | 25.0% |
| Rides Adj EBITDA | 3,478 | 5,999 | 8,469 |
Source: Company Filings, Author Est
Given Uber Technologies’s diverse portfolio of businesses, a sum-of-parts approach makes sense, in my view. Applying a 3.0x EV/Sales multiple on FY22 numbers (below peers such as Delivery Hero, in-line with GrubHub), and accounting for the other non-Rideshare businesses, the controlling stake in ATG, as well as its equity investments (e.g., Grab, Didi, Yandex, I believe Uber’s rideshare business is being valued at a significant discount to underlying, steady-state EBITDA at ~4.7x (~4x ex-ATG). A non-zero valuation on other-bets/freight would drive additional upside to the sum-of-parts.
| FY22 Net
Revs |
EV/
Sales Multiple |
Implied
EV |
|
| Uber Market Cap | 68,680 | ||
| (-) Net Cash | 3,523 | ||
| (=) Uber EV | 65,157 | ||
| (-) Eats | 4,207 | 3.0 | 12,621 |
| (-) Other Bets/Freight | 2,899 | 0 | 0 |
| (=) Implied Rideshare Value | 52,536 | ||
| (-) Rideshare Investments & JV | 13,164 | ||
| (=) Est UBER Rideshare EV | 39,372 | ||
| (-) ATG | 6,250 | ||
| (=) Est UBER Rideshare EV (ex-ATG) | 33,122 | ||
| Implied UBER Rideshare FY22 EV/EBITDA | 4.65x | ||
| Implied UBER Rideshare EV (ex-ATG) FY22 EV/EBITDA | 3.91x |
Source: Company Filings, Author Est


