Whitney Tilson’s email to investors S&P 500 return over the past and next decade; Tech and FAANG stocks. Looking at revenue and margin growth there may not be such great returns ahead.
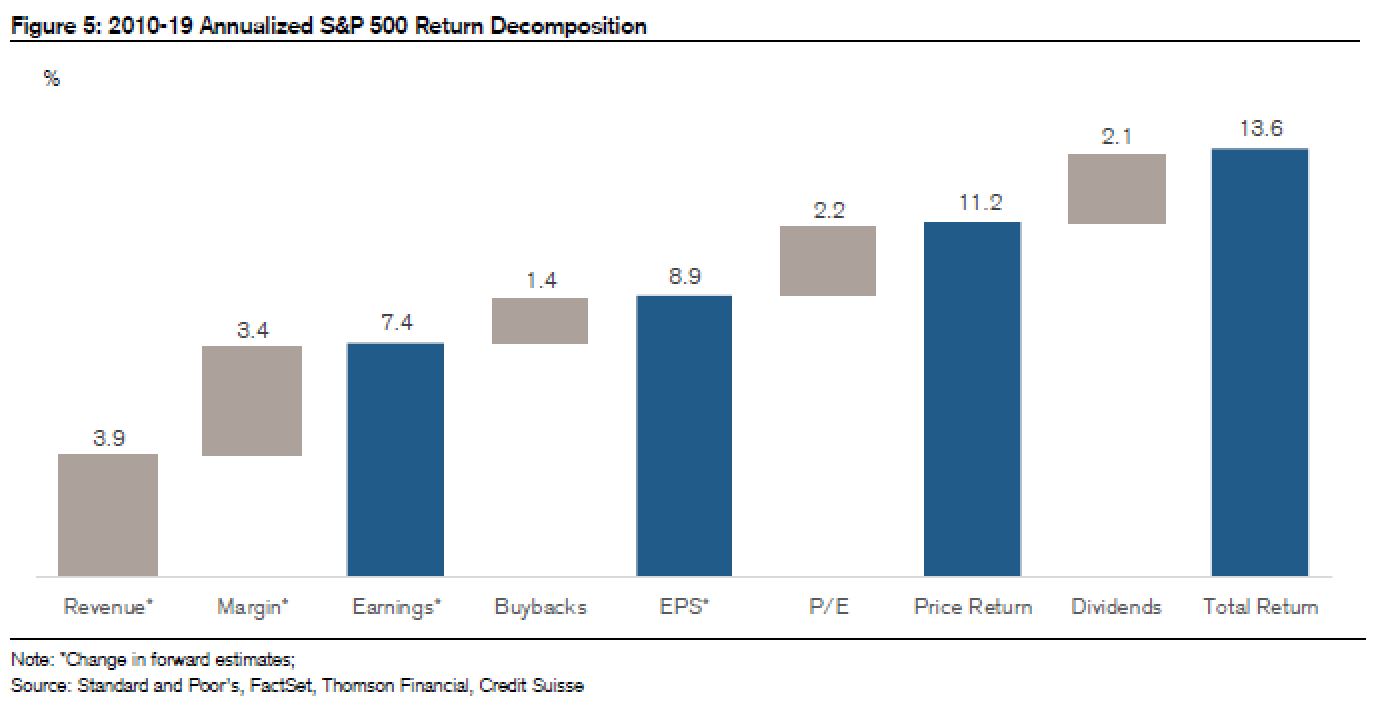
1) Analysts at Credit Suisse collected some interesting data about the past decade in a report entitled “Those Crazy Teen Years.” Over the decade, the S&P 500 Index compounded at 13.6%, after being negative over the prior decade. The chart below shows the five factors that drove the return: Revenue, margin, buybacks, the price-to-earnings (P/E) ratio, and dividends.

Q4 2019 hedge fund letters, conferences and more
And this chart shows how much the tech sector – and the five FAANG stocks in particular – outperformed the broad market:
This was driven by both exceptional revenue and margin growth, as these two charts show:
The first chart is a helpful framework for thinking about what the S&P 500 might return in the coming decade, and the last two charts indicate that we should have modest expectations for revenue and margin growth going forward – since it's highly unlikely that tech stocks will be such a driver of outperformance for another decade.
If I were to hazard some guesses, I'd say that revenue growth results in 3.0% compounding for the S&P 500 over the next decade (down somewhat from 3.9% last decade), margins and P/E multiples remain flat (at best), and buybacks and dividends remain constant at 1.4% and 2.1% contributors, respectively. This would result in the S&P 500 compounding at 6.5% annually.
That's decent – it would almost certainly beat the return on bonds by a wide margin – but it would be less than half of the growth rate of the past decade, so investors should adjust their expectations accordingly...


