The gold price history shows that gold valuations have both risen and fallen over many millennia. During some durations of time in various parts of the world, owning gold bullion could afford you more in terms of goods and services versus other historic timeframes.
Given that we human beings have become more efficient at producing many goods and some services, we expect the purchasing power for gold bullion stands to benefit as central bank fiat currencies get further discredited this century. In other words, we and our client bet better days are coming for gold bullion later this decade and even into the next.

Q4 2019 hedge fund letters, conferences and more
Gold Price History + Modern Gold Fundamentals
Valued by human beings for over 6,000 years, dating older than even recorded history. Gold has and will likely remain valued by mankind indefinitely due to various precious factors.
The following is a brief but long-running look into historical gold prices and valuations throughout recorded history.
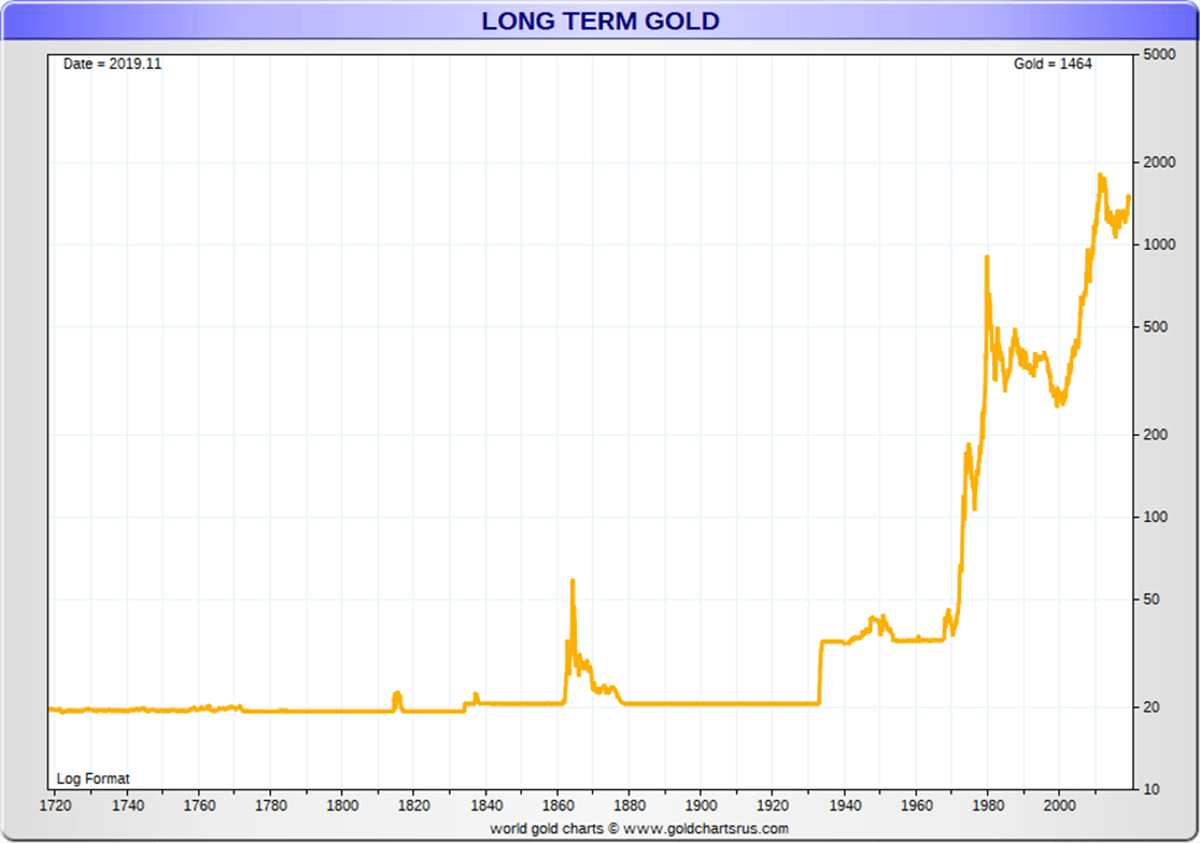
Most website visitors on Value Walk are from the USA and for that reason, we will begin with a gold price chart covering more the last 300 years denominated in US dollars and after 1971, fully fiat Federal Reserve notes.
For the majority of the history of the United States of America, historic gold prices were flat and fixed at $20.67 oz as much of the circulating coinage we used in the nation was defined as an explicit amount of precious specie money (either silver or gold).
As you can see in the historical gold price chart above, there was a mania in gold values that followed the Civil War Greenback era. The next major hump in the long term gold price chart above was the 1933 gold confiscation and revaluation from $20.67 oz eventually to $35 oz.
Once the London Gold Pool failed after operating from 1961 to 1968, the post-1971 free-floating fiat currency price of gold blasted from its artificially low levels to over $850 oz by early January 1980.
In our nation’s historically brief +240 year history, the price of gold has swung from as low as $20.67 oz to a high close to $2,000 oz in the late summer of 2011. As has already happened in nearly 100 fiat currencies worldwide, we fully expect early this decade in the 2020s to see new nominal price highs for gold priced in fiat US dollars.
We human beings have consistently mined more new gold ore over the last 200 years mainly due to ingenuity and other contributing factors from the industrial revolution of the mid-1800s and into the 20th and 21st Centuries.
It is common to see an annual gold mine supply of over 3,000 tonnes or near 100 million ounces of fresh physical gold mined from the Earth.
By watching the following short video clip, you can get a better understanding of the size and scale of the world's biggest gold miners beginning in 1900 and moving into the 2020s.
When the video's data begins, the USA was the world's leading gold producer in the year 1900 supplying over 100 tons to start that century. During the late 1960s, the government partnered central banks were buying as much physical gold bullion as they are once again today.
Gold Producing Countries
Back some fifty years ago it was the nation of South Africa that was yielding close to 1,000 tonnes of gold per year out of its famed massive gold mines.
Today, a handful of South African gold mines dive nearly two to 2.5 miles in-depth to mine the yellow precious metal. To date, South Africa has still mined over 1/4th of all the physical gold the world currently has either in jewelry, bullion, or spread about in industrial application forms.
During the 2010s and now in the 2020s, China regularly leads the world in gold mining output typically producing over 400 tonnes annually per year.
Most US citizens reading this are unaware that after World War 2 the United States had a relatively dominant Official Gold Reserve of over 20,000 tonnes. This fact is mainly why the prior version of the US dollar, now the fully fiat Federal Reserve note, was used in the Bretton Woods Agreement to anchor the global monetary system.
The Federal Reserve governor who oversaw some 12,000 tonnes of gold leave the USA (virtually the entire size of the 1933 gold nationalization hoard) for our foreign creditor's vaults during the London Gold Pool era was also one of the last honest central bankers, Mr. John Exter.
Now in the 21st Century, we are arguably living through the largest gold bull market measured by collective investor interest across the world. The amount of gold bullion and derivatives which have and are continually being traded today is more in size and scale than any time prior.
The value of gold today, considering its historic relative basis versus financial assets, for instance, is still very cheap considering all the fiat currency price inflation which has yet to fully dawn on the investing public.
In the broad scope of the US stock market using a 200-year timeframe of the DJIA vs Gold, we see a dead cat bounce in terms of gold values from the year 2000 internet bubble into this 2020s internet 2.0 bubble ongoing.
We expect in the next commodity bull market peak, we will again see a Dow Gold Ratio below 5 and even peak below 2, similar to January 1980 or after the US dollar devaluation during the Great Depression in 1934.
Historical Gold Prices
To learn more about Gold Price History and find daily gold price data during this full fiat currency era, visit us at SD Bullion.


