Forge First Asset Management commentary for the month ended November 30, 2019.
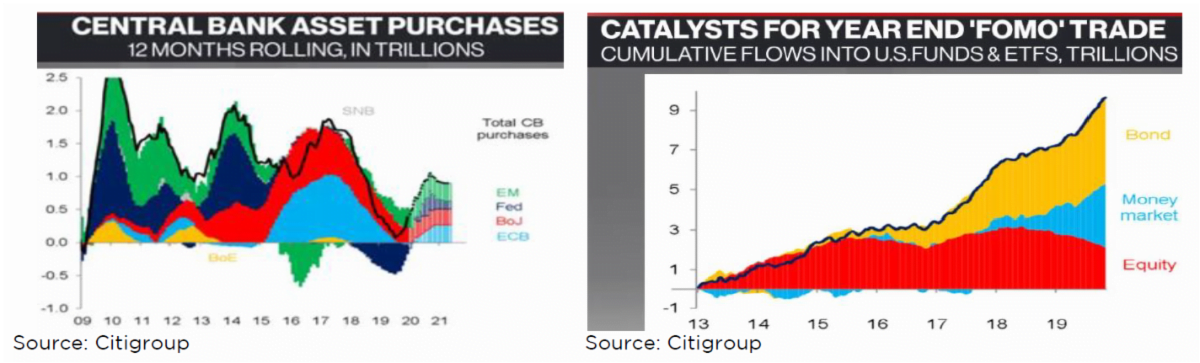
The attitude of investors towards equities was buoyed last month by optimism that a China U.S. trade deal would get done, belief that the rate of change in global economic activity had bottomed and news that the Federal Reserve was growing its balance sheet again. Whether one calls it QE or not, in joining the Bank of Japan and the ECB, the graph on the below left shows the clear reversal from the balance sheet tightening of late last year. In fact the dashed line of forward estimates on the right side of the graph shows this latest central bank party is just getting started. As a result, after having sold equities to buy money market and bond funds during the past couple of years (please see the graph on the below right), FOMO (‘fear of missing out’) catalyzed investors to start chasing stocks. This renewed buying drove the strong November for stocks, one that included 11 fresh all-time highs for the S&P 500.
Each of the two funds at Forge First joined this party with strong gains for the month, with each fund exiting November at an all-time high. The source of the profits was widespread although our long position in Canadian oil sands companies and short shares in U.S. energy companies topped the charts of sector performance. First discussed in our May 2019 commentary the Canadian oil companies held in our portfolios are minting cash at current oil prices whereas much of the U.S. E&P universe is struggling.
For example, top 10 holding Canadian Natural Resources Ltd. (CNQ.CA) generated $1.9B of free cash flow from the 1.1M BOE/day it produced during Q3. In contrast, a universe of U.S. mid-cap companies that collectively produced 8.5M BOE/day during the same time frame generated $1B of free cash flow. Given the combination of improving near term egress for Canadian oil (Line 3, crude by rail) and our forecast that WTI oil prices will remain in the $52-$62 price range during the next couple of quarters, we expect this divergence in performance to continue.
Other key contributors to November’s performance were core holdings Goeasy Ltd. (GSY.CA), Parkland Fuel Corp. (PKI.CA) and Microsoft Corp. (MSFT.US). The only losing sectors were ETFs, predictably as these funds are used as beta hedges to our portfolios, and materials, as the price of gold fell 3% on the month.
Assuming President Trump doesn’t upset the trade cart, we would expect FOMO to enable this Santa Claus rally to continue in the short term. We must admit the universal consensus of this constructive view towards equities gives us pause despite the fact that the last calendar month of the year has historically been a positive one for stocks 72.5% of the time.
However, in the end we’re comfortable with our net long common equity positioning (49.8% in the Long Short LP and 24.2% in the Multi Strategy LP) because 1) we’ve rolled our index puts to higher strikes, 2) hold listed option positions on many individual positions, and 3) we hold a diversified short book, as is part of our investing rulebook.
Looking ahead into 2020, while our outlook commentary will be released in early January, it’s tough to see how next year can get better than 2019 for the broader equity indices. According to Morgan Stanley, despite positive revenue growth, earnings for the S&P 500 have generally not grown for 3 consecutive quarters. Further, profits for small and mid-cap companies are down close to 10% from their peak while the payout ratio for the S&P 500 exceeds 100%. With valuation expansion having accounted for roughly 90% of the rise in stock prices this year, the PE ratio on 2020 EPS now exceeds 18.5X.
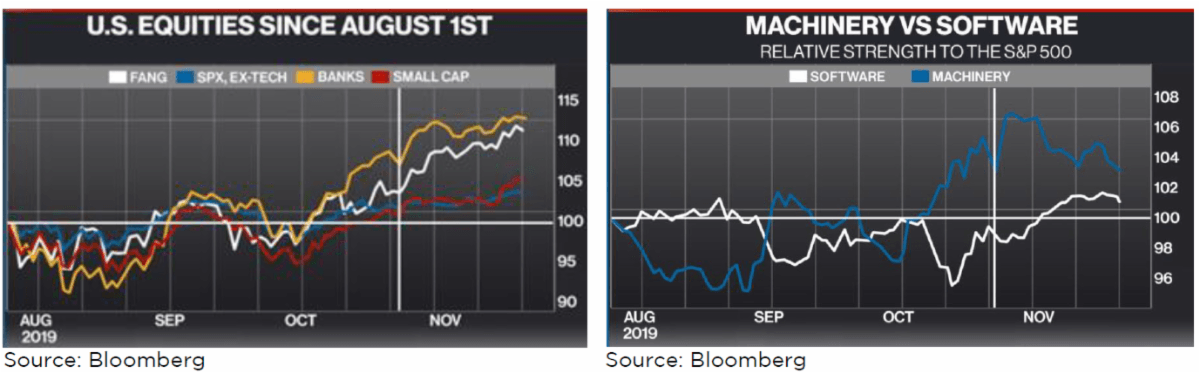
Consequently, while not owning enough stocks was the ‘pain trade’ for 2019, we believe sector rotation will be the pain trade for 2020. Each of the graphs of U.S. stocks shown below begins on August 1st, the inception of this latest rally, with the white vertical line marking the start of November. Generally speaking, this four-month move in stocks that we’ve now experienced has generally exhibited a value/cyclical versus growth/momentum bias. However, the graph on the left shows that banks (orange line) and the broader ‘FANG’ index (white) have outperformed small caps (red) and the non-tech components of the S&P 500 (blue), especially during November. This bit of a stall in the growth to value trade is particularly obvious from the graph on the right, the highly cyclical machinery index (blue line) versus epitome of growth and momentum, the software index (white line).
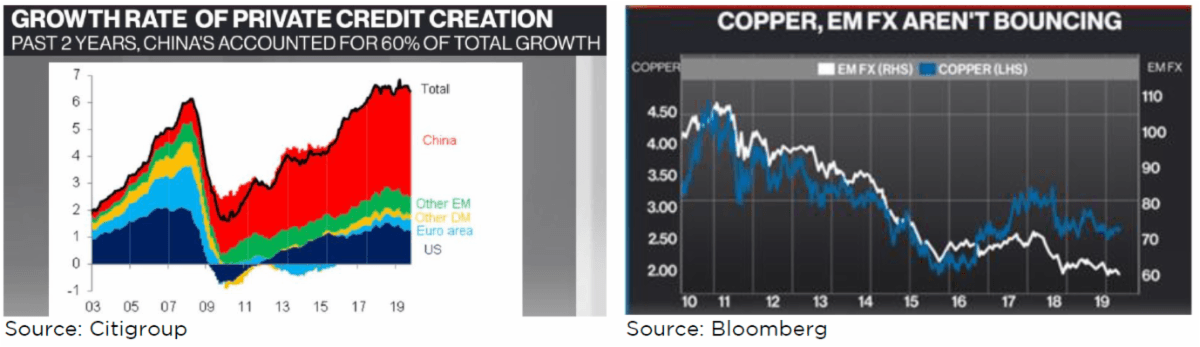
At this juncture there are reasons to be both optimistic and pessimistic towards the market’s current enthusiasm that global growth will accelerate. On the negative side of the ledger, the graph on the below left highlights that China has accounted for 60% of global private credit growth during the past two years. Neither the current trajectory of falling growth in industrial profits nor Beijing’s admission of concern towards the existing financial leverage in their economy is conducive to a continuation of above average credit creation. Meanwhile, the graph on the below right shows that two traditional leading indicators of improving growth (albeit more relevant for emerging vs developed markets) remain dormant.
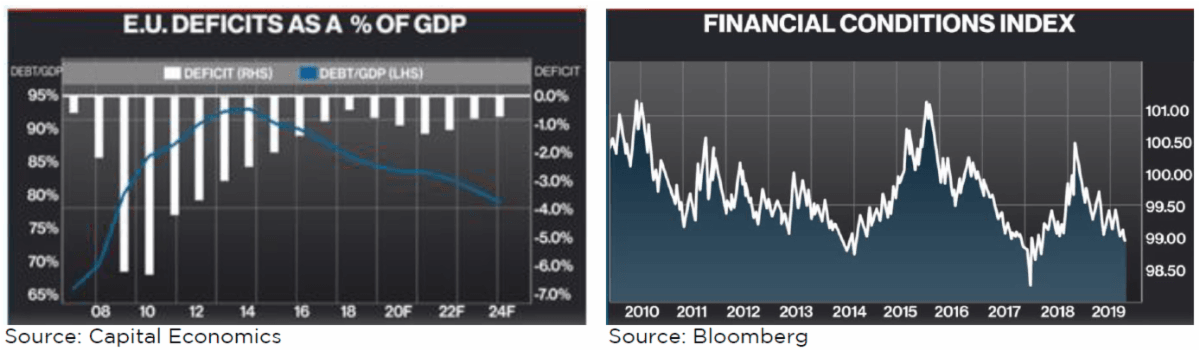
At the same time, it’s quite clear that the big 3 central banks intend to remain highly accommodative (low rates, growing balance sheets) until well into 2021. That’s just one of the reasons why the Goldman Sachs financial conditions index shown on the below right is as loose as it is right now. In addition, while we remain circumspect that we’ll see substantive fiscal stimulus from the EU in a timely fashion, the graph on the below left illustrates that the continent definitely has the financial wherewithal to move ahead with a sizeable program.
If growth does reaccelerate, we would expect to see a continued shift away from growth towards value and more cyclical businesses. However, with ‘no new China’ to drive a commodities boom, this equity shift would be more selective than that of previous upcycles. At the same time, while we don’t know the specific numbers, the implicit shift in the flow of funds could be very powerful for winning sub-sectors.
Macro cap tech stocks are universally owned. If 10% of the holders of these stocks sold 5% of their positions in favour of buying cyclical stocks, this amount of capital could dwarf the current market cap of the winning cyclicals without moving equity indices all that much. In contrast, if growth does not reaccelerate by Spring time, and by then equity markets start getting concerned about a Warren White House, the rotation that’s already occurred could reverse, again with little movement in the broader averages since such a ‘risk off’ trade would see the heavily weighted macro cap stocks sold across the board.
The other item that will play a key role in either scenario is the U.S. dollar. Reaccelerating global growth would finally push the Yankee buck lower whereas stall speed or worse could push the ‘DXY’ index to par. A bet on the dollar is a bet on which economic scenario you expect and hence how an investor likely wants to be positioned.
At Forge First, we’re not going to ‘make a bet’ either way. For example, as discussed in our last market commentary during mid-October, we made tactical shifts to our portfolios. These moves increased our exposure to more cyclical companies, without forsaking either of our free cash flow discipline nor substantially changing our drawdown potential.
One new name that fit this profile was Patrick Industries Inc. (PATK.US), a parts manufacturer for manufactured housing and RVs, a company with improving fundamentals and a double digit free cash flow yield. As for not materially changing our exposure to a significant drawdown, we shifted our index put spread exposure to owning straight puts. Also, we replaced several single stock shorts with broader market hedges via ETFs.
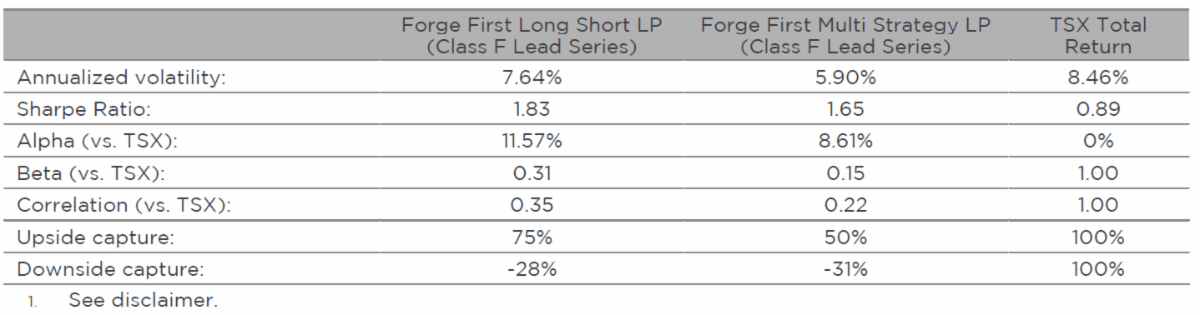
Consequently, we’re very comfortable that the current positioning of our portfolios offers solid cyclical upside yet excellent protection of the downside. Of course, that’s what alternative investment funds are supposed to be all about, and it’s why our funds have a solid risk-adjusted net return profile since their inception more than seven years ago.
As always, thank you for your consideration. Please visit our website at www.forgefirst.com for information on our funds. Should you have any questions, please contact us.
Most of all the team at Forge First would like to wish you and your loved ones a healthy and happy holiday season.
Thank you,
Daniel Lloyd
Portfolio Manager
Andrew McCreath, CFA
President and CEO


